
Government of Canada’s direct greenhouse gas emissions: Trends
Progress on all reported sources of direct GHG emissions for facilities and fleets. Updated data for fiscal year 2024 to 2025 shows that GHG emissions continue a downward trend. Operational improvements (e.g. portfolio rationalization, increased energy efficiency) and clean electricity procurement contributed to a reduction of GHG emissions from the previous year (2023-24).
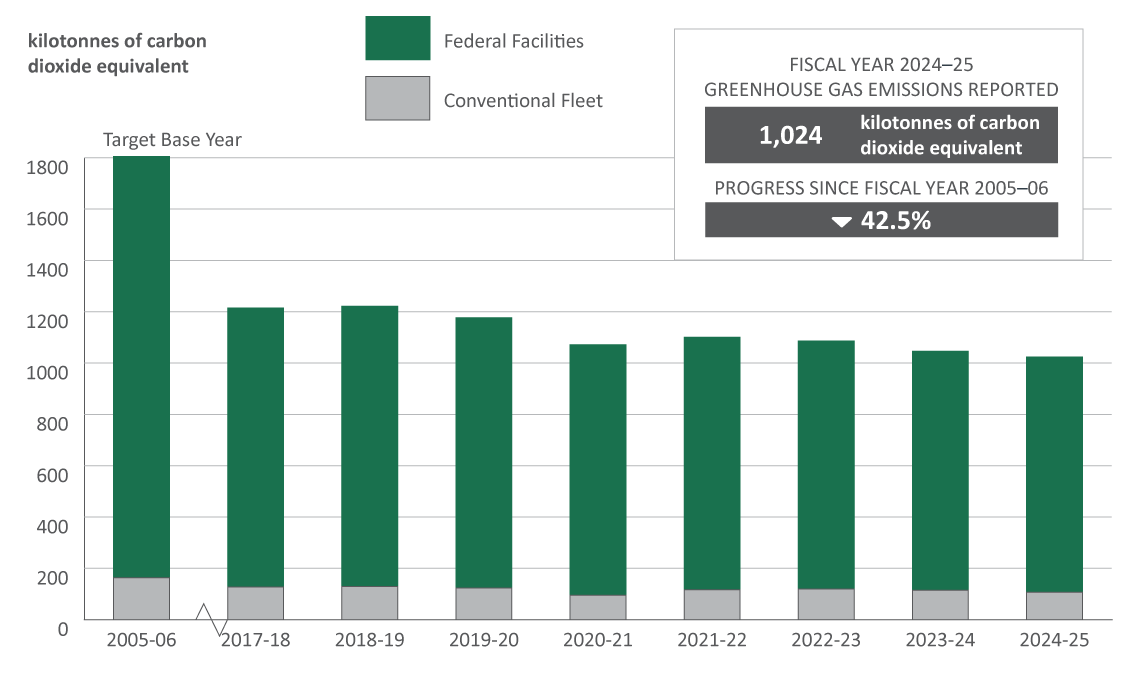
Figure 1 - Text version
The bar graph shows the total greenhouse gas emissions from facilities and conventional fleet operations in kilotonnes of carbon dioxide equivalent reported from fiscal years 2005 to 2006 to 2024 to 2025. In fiscal year 2024 to 2025 the federal government reported 1,024 kilotonnes of carbon dioxide equivalent, which represents a 42.5% reduction since fiscal year 2005 to 2006. Between fiscal years 2017 to 2018 and 2018 to 2019, the GHG inventory was expanded to cover all core departments owning facilities and/or fleets with more than 50 vehicles, increasing the number of reporting organizations from 15 to 29. Therefore, when comparing data from between fiscal years 2010 to 2011 and 2016 to 2017 to post-2017 years, one must account for this change. Comparisons of the current year with the 2005 to 2006 base year are always valid, because as departments were added, their emissions were also added to the base year.
| Fiscal Year | Federal Facilities Emissions (kt CO2 eq) | Conventional Fleet Emissions (kt CO2 eq) | Total Emissions (kt CO2 eq) | Percentage change compared with fiscal year 2005 to 2006 |
|---|---|---|---|---|
| 2005-06 | 1,616 | 165 | 1,781 | - |
| 2017-18 | 1,088 | 127 | 1,215 | -32.3% |
| 2018-19 | 1,092 | 129 | 1,221 | -31.9% |
| 2019-20 | 1,054 | 123 | 1,177 | -34.4% |
| 2020-21 | 976 | 95 | 1,071 | -40.3% |
| 2021-22 | 984 | 117 | 1,101 | -38.6% |
| 2022-23 | 966 | 120 | 1,086 | -39.8% |
| 2023-24 | 933 | 115 | 1,048 | -42.0% |
| 2024-25 | 917 | 107 | 1,024 | -42.5% |
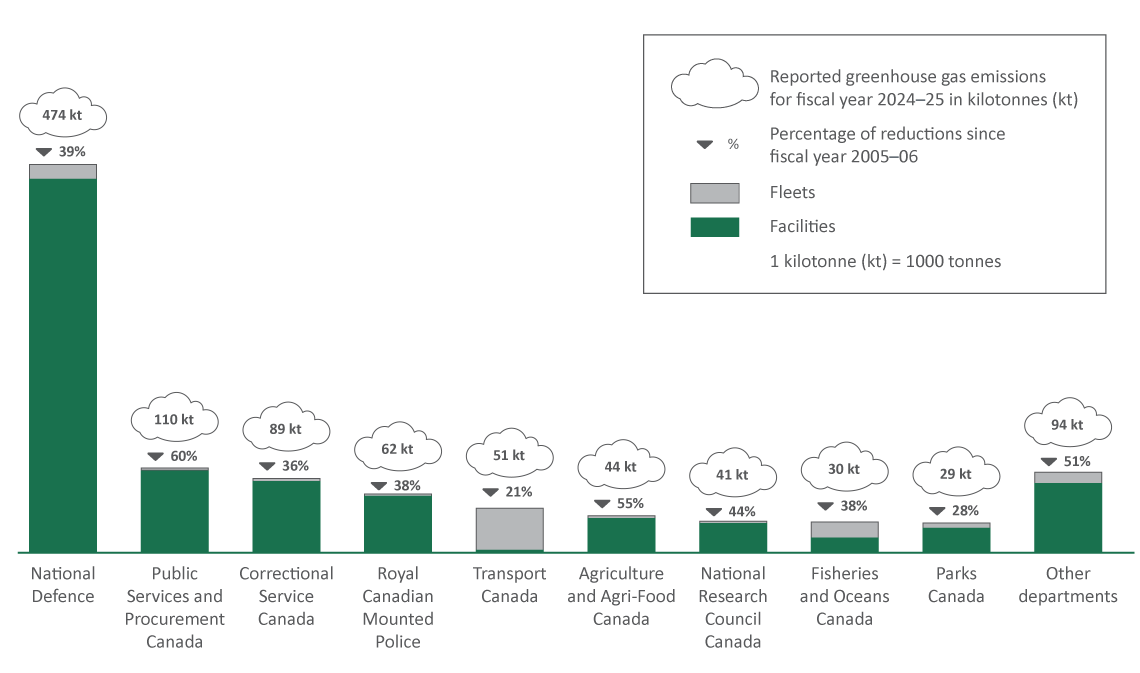
Figure 2 - Text version
The bar graph shows the total greenhouse gas emissions (in kilotonnes of carbon equivalent) reported in fiscal year 2024 to 2025, for facilities and conventional fleet operations by federal organization. The greenhouse gas emissions are separated by facilities or fleet. The percentage change compared with fiscal year 2005 to 2006 is also shown for each federal organization.
| Federal organization | Emissions from facilities for fiscal year 2024 to 2025 (kt CO2 eq) | Emissions from fleets for fiscal year 2024 to 2025 (kt CO2 eq) | Total Emissions for fiscal year 2024 to 2025 (kt CO2 eq) | Total Emissions for fiscal year 2005 to 2006 (kt CO2 eq) | Percentage change compared with fiscal year 2005 to 2006 |
|---|---|---|---|---|---|
| National Defence | 455.9 | 18.5 | 474.4 | 778.8 | -39% |
| Public Services and Procurement Canada | 109.1 | 0.6 | 109.8 | 271.3 | -60% |
| Correctional Service Canada | 87.3 | 1.9 | 89.2 | 140.2 | -36% |
| Royal Canadian Mounted Police | 61.2 | 0.9 | 62.1 | 99.8 | -38% |
| Transport Canada | 4.1 | 46.7 | 50.8 | 64.3 | -21% |
| Agriculture and Agri-Food Canada | 41.1 | 3.3 | 44.4 | 99.3 | -55% |
| National Research Council Canada | 39.8 | 1.1 | 41.0 | 72.6 | -44% |
| Fisheries and Oceans Canada | 22.9 | 7.2 | 30.0 | 48.2 | -38% |
| Parks Canada | 14.6 | 13.9 | 28.5 | 39.8 | -28% |
| Canadian Food Inspection Agency | 13.6 | 2.4 | 15.9 | 32.8 | -51% |
| Natural Resources Canada | 17.2 | 0.7 | 17.9 | 34.3 | -48% |
| Environment and Climate Change Canada | 9.9 | 2.4 | 12.4 | 22.0 | -43% |
| Canada Border Services Agency | 5.9 | 4.2 | 10.1 | 12.8 | -21% |
| Health Canada | 8.4 | 0.2 | 8.6 | 22.0 | -61% |
| Public Health Agency of Canada | 6.7 | 0.0 | 6.7 | 7.1 | -5% |
| Public Safety Canada | 4.7 | 0.0 | 4.7 | 6.8 | -30% |
| Communications Security Establishment | 5.4 | 0.0 | 5.4 | 10.1 | -46% |
| Library and Archives Canada | 2.5 | 0.0 | 2.5 | 4.0 | -38% |
| Indigenous Services Canada | 0.0 | 1.8 | 1.8 | 2.7 | -33% |
| Polar Knowledge Canada | 1.9 | 0.0 | 1.9 | N/A | N/A |
| Canadian Space Agency | 1.3 | 0.0 | 1.3 | 2.4 | -43% |
| Innovation, Science and Economic Development Canada | 0.5 | 0.6 | 1.2 | 2.9 | -59% |
| Shared Services Canada | 1.4 | 0.2 | 1.6 | 2.0 | -16% |
| Canadian Forces Morale and Welfare Services | 0.8 | 0.0 | 0.8 | 2.4 | -66% |
| Crown-Indigenous Relations and Northern Affairs Canada | 0.2 | 0.0 | 0.2 | 0.4 | -51% |
| National Battlefields Commission | 0.2 | 0.0 | 0.2 | 0.1 | -23% |
| Employment and Social Development Canada | 0.0 | 0.2 | 0.2 | 1.4 | -88% |
| Canada Revenue Agency | 0.0 | 0.1 | 0.1 | 0.4 | -70% |
| Immigration, Refugees and Citizenship Canada | 0.0 | 0.02 | 0.02 | 0.1 | -76% |
| Total | 917 | 107 | 1,024 | 1,781 | -42.5% |

Figure 3 - Text version
The bar graph shows the GHG emissions (in kilotonnes of carbon dioxide equivalent) reported between fiscal years 2018 to 2019 and 2024 to 2025, for national safety and security fleets.
| Fiscal Year | National Safety and Security Fleet Emissions (kt CO2 eq) |
|---|---|
| 2018-19 | 986 |
| 2019-20 | 951 |
| 2020-21 | 844 |
| 2021-22 | 878 |
| 2022-23 | 846 |
| 2023-24 | 802 |
| 2024-25 | 768 |
Key results
- 29 federal organizations reported GHG emissions between fiscal years 2018 to 2019 and 2024 to 2025
- The federal facilities and conventional fleet emissions for fiscal year 2024 to 2025 totaled 1,024 kilotonnes (kt) of carbon dioxide equivalent (CO2 eq), which represents a decrease of 757 kt CO2 eq or 42.5% (excluding National Safety and Security emissions), compared with fiscal year 2005 to 2006
- Emissions from facilities and fleets have been trending downward in recent years, even as operations rebound from the lows of the COVID-19 pandemic.
- GHG emissions from federal facilities in fiscal year 2024 to 2025 totaled 917 kt CO2 eq, which is a reduction of 699 kt CO2 eq or 43.3% compared with fiscal year 2005 to 2006
- In fiscal year 2024 to 2025, the federal conventional fleet generated 107 kt CO2 eq, which is a reduction of 58 kt CO2 eq or 35% lower than fleet emissions in fiscal year 2005 to 2006