
Government of Canada’s direct greenhouse gas emissions: Conventional fleets
Operating a fleet results in the combustion of fossil fuels and the emission of GHGs. The Government of Canada (GC) is transitioning to zero emission vehicles and has a large and diverse conventional fleet that includes:
- on-road vehicles and equipment, such as:
- cars
- vans
- trucks
- other vehicles
- off-road vehicles and equipment, such as:
- marine vessels (boats and ships)
- aircraft
- other mobile equipment (for example all-terrain vehicles, lawn mowers and generators)
Federal conventional fleets consist of vehicles and equipment primarily used to transport people and cargo in the conduct of government business, and excludes fleet used for National Safety and Security operations.
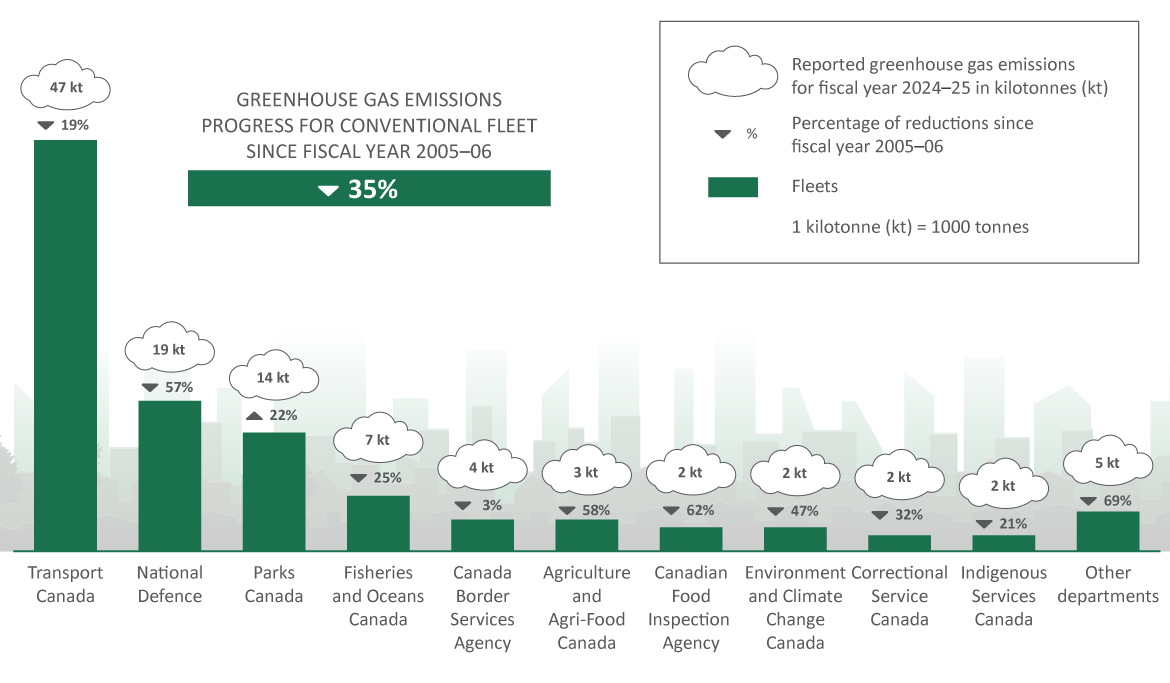
Figure 7 - Text version
The bar graph shows the total GHG emissions (in kilotonnes of carbon equivalent) reported in fiscal year 2024 to 2025, for conventional fleet by federal organization. Above each bar is the organization’s emissions in 2024 to 2025, as well as the percentage change compared with fiscal year 2005 to 2006 for each federal organization.
| Federal organization | Emissions from conventional fleet for fiscal year 2005 to 2006 (kt CO2 eq) | Emissions from conventional fleet for fiscal year 2024 to 2025 (kt CO2 eq) | Percentage change compared with fiscal year 2005 to 2006 |
|---|---|---|---|
| Transport Canada | 57.6 | 46.7 | -19% |
| National Defence | 43.3 | 18.5 | -57% |
| Parks Canada | 11.4 | 13.9 | 22% |
| Fisheries and Oceans Canada | 9.6 | 7.2 | -25% |
| Canada Border Services Agency | 4.4 | 4.3 | -3% |
| Agriculture and Agri-Food Canada | 8.1 | 3.3 | -58% |
| Canadian Food Inspection Agency | 6.3 | 2.4 | -62% |
| Environment and Climate Change Canada | 4.6 | 2.4 | -47% |
| Correctional Service Canada | 2.8 | 1.9 | -32% |
| Indigenous Services Canada | 2.2 | 1.8 | -21% |
| National Research Council Canada | 1.3 | 1.1 | -14% |
| Royal Canadian Mounted Police | 4.2 | 0.9 | -78% |
| Natural Resources Canada | 1.7 | 0.7 | -60% |
| Public Services and Procurement Canada | 1.5 | 0.6 | -62% |
| Innovation, Science and Economic Development Canada | 1.8 | 0.6 | -64% |
| Shared Services Canada | 0.7 | 0.3 | -61% |
| Health Canada | 1.6 | 0.2 | -86% |
| Employment and Social Development Canada | 1.4 | 0.2 | -88% |
| Canada Revenue Agency | 0.4 | 0.1 | -70% |
| Crown-Indigenous Relations and Northern Affairs Canada | 0.08 | 0.04 | -49% |
| Immigration, Refugees and Citizenship Canada | 0.09 | 0.02 | -76% |
| Canadian Space Agency | 0.7 | 0.02 | N/A |
| Communications Security Establishment | N/A | 0.01 | N/A |
| Public Safety Canada | N/A | 0.01 | N/A |
| Total | 165 | 107 | -35% |
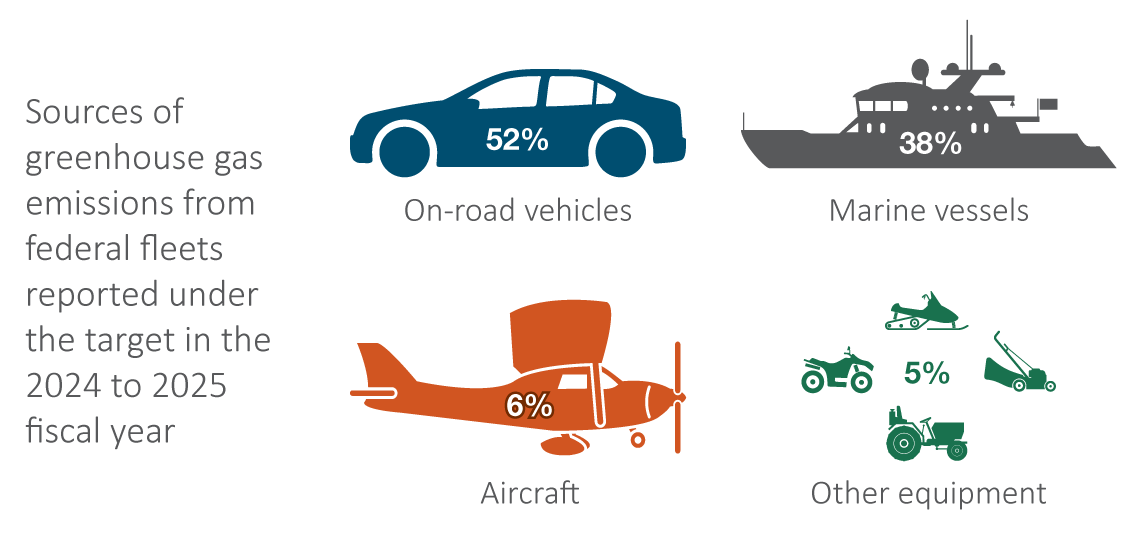
Figure 8 - Text version
The graphic shows the sources of GHG emissions from the federal fleet by vehicle type in fiscal year 2024 to 2025. From highest to lowest: on-road (50%), marine vessels (37%), aircraft (8%), and other mobile equipment (5%).
| Vehicle type | Emissions for fiscal year 2005 to 2006 (kt CO2 eq) | Emissions for fiscal year 2024 to 2025 (kt CO2 eq) | Percentage of 2024 to 2025 total emissions |
|---|---|---|---|
| On road vehicles | 103 | 55 | 52% |
| Marine vessels | 36 | 41 | 38% |
| Aircraft | 16 | 6 | 6% |
| Other mobile equipment | 9 | 5 | 5% |
| Total | 165 | 107 | 100% |
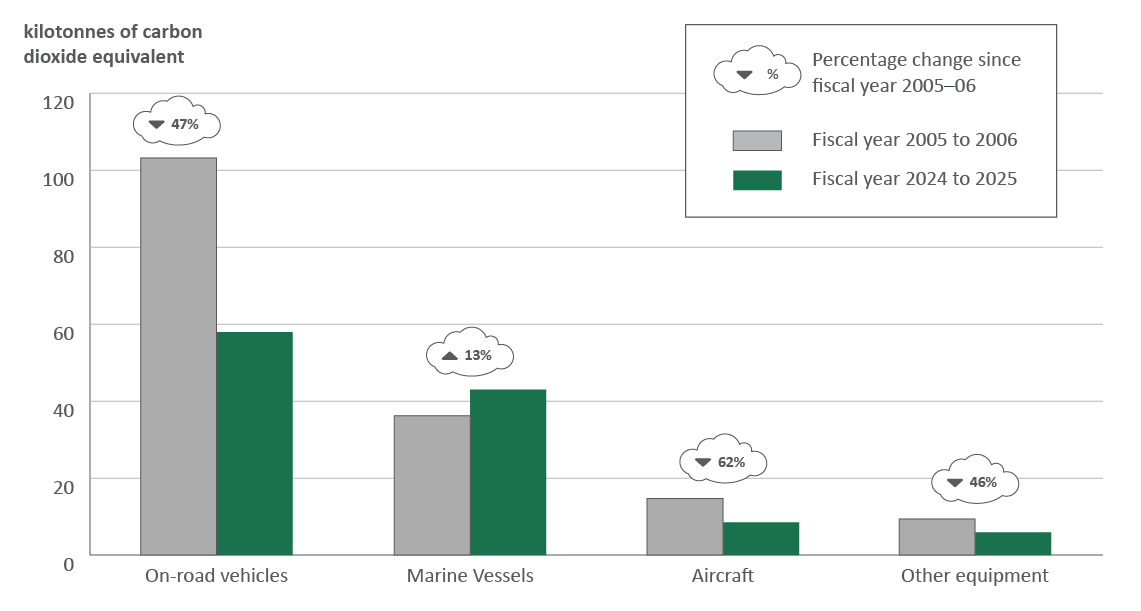
Figure 9 - Text version
The bar graph shows the GHG emissions generated by the federal conventional fleet in kilotonnes of carbon dioxide equivalent by vehicle type for fiscal years 2005 to 2006 and 2024 to 2025 and the percentage change in emissions compared with fiscal year 2005 to 2006.
| Vehicle type | Emissions for fiscal year 2005 to 2006 (kt CO2 eq) | Emissions for fiscal year 2024 to 2025 (kt CO2 eq) | Percentage change compared with fiscal year 2005 to 2006 |
|---|---|---|---|
| On road vehicles | 103 | 55 | -47% |
| Marine vessels | 36 | 41 | 13% |
| Aircraft | 16 | 6 | -62% |
| Other mobile equipment | 9 | 5 | -46% |
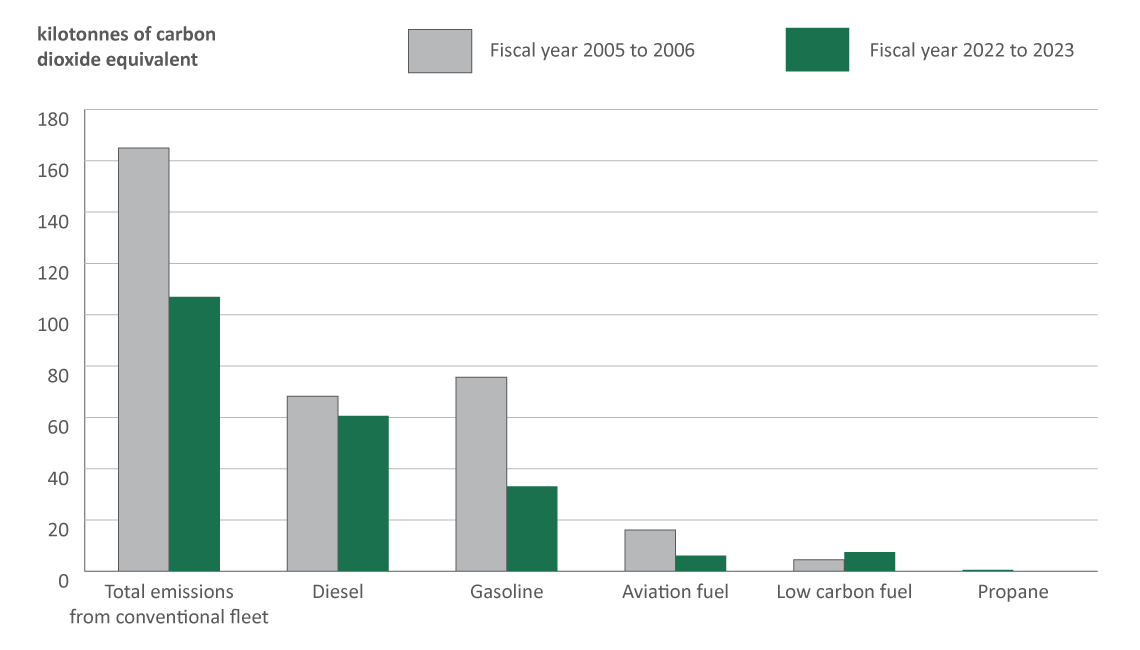
Figure 10 - Text version
The bar graph shows the GHG emissions generated by the federal conventional fleet in kilotonnes of carbon dioxide equivalent by fuel type for fiscal years 2005 to 2006 and 2024 to 2025.
| Fuel type | Emissions for fiscal year 2005 to 2006 (kt CO2 eq) | Emissions for fiscal year 2024 to 2025 (kt CO2 eq) | Percentage change compared with fiscal year 2005 to 2006 |
|---|---|---|---|
| Diesel | 68.2 | 60.6 | -11% |
| Gasoline | 75.6 | 33.1 | -56% |
| Aviation fuel | 16.1 | 6.1 | -63% |
| Low carbon fuel | 4.5 | 7.5 | 66% |
| Propane | 0.56 | 0.04 | -92% |
| Total | 165 | 107 | -35% |
Key results
- 24 federal organizations reported GHG emissions generated by federal conventional fleets in fiscal year 2024 to 2025
- The emissions for fiscal year 2024 to 2025 totaled 107 kilotonnes (kt) of carbon dioxide equivalent (CO2 eq) for conventional fleets, which represents a decrease of 58 kt CO2 eq or 35% compared with fiscal year 2005 to 2006
- In fiscal year 2024 to 2025, the top 5 emitting organizations (Transport Canada, National Defence, Parks Canada, Fisheries and Oceans Canada and Canada Border Service Agency) generated 85% of the GC’s conventional fleet GHG emissions
- The federal conventional fleet generated just under 11% of combined federal facilities and conventional fleet GHG emissions in fiscal year 2024 to 2025
- Half of the fleet’s GHG emissions (52%) were generated by on-road vehicles, while the balance was generated by marine vessels (38%), aircraft (6%) and other mobile equipment (5%) owned by federal organizations
- Since fiscal year 2005 to 2006, on-road vehicles have delivered both the largest absolute GHG reduction (48 kt CO2 eq) and percentage reduction (52%) within the conventional fleet. In fiscal year 2024 to 2025, GHG emissions from the federal fleet were influenced by:
- Vehicle right-sizing and the purchase of more efficient vehicles
- GHG emissions from gasoline, which were the largest source of the fleet’s emissions in 2005-06, decreasing by 43 kilotonnes (kt) of carbon dioxide equivalent (CO2 eq), or 56% compared with fiscal year 2005 to 2006
- GHG emissions from diesel, which were reduced by 7.6 kt of CO2 eq or 11% compared with fiscal year 2005 to 2006. The marine fleet accounted for 65% of emissions from diesel fuel, 30% from on-road vehicles and 5% from other mobile equipment
- GHG emissions from aviation fuel have decreased by 63% compared with fiscal year 2005 to 2006
- GHG emissions from propane were reduced by 92%.
More information
Visit the Open Government portal for more information on GHG emissions generated by federal fleets.