
Government of Canada’s direct greenhouse gas emissions: Facilities
The federal government has one of the largest and most diverse portfolios of facilities in the country, including:
- the buildings on Parliament Hill
- aircraft hangars on military bases
- laboratories
- correctional institutions
- office buildings and warehouses
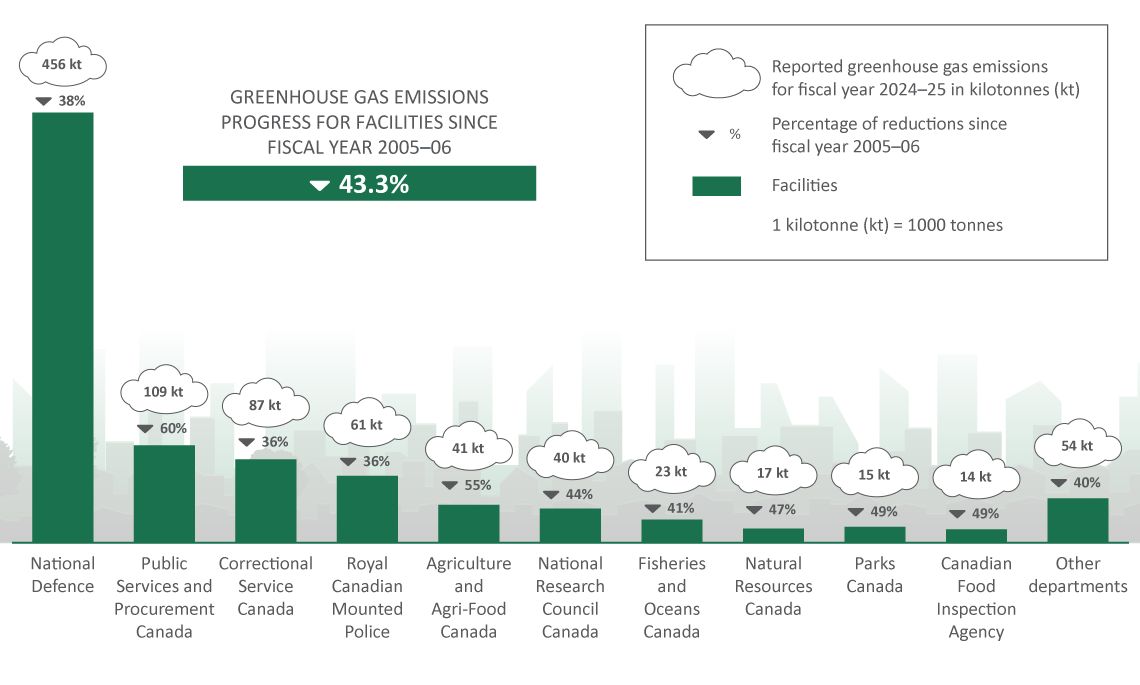
Figure 4 - Text version
The bar graph shows the total GHG emissions (in kilotonnes of carbon equivalent) reported in fiscal year 2024 to 2025, for facilities by federal organization. Above each bar is the organization’s emissions in 2024 to 2025, as well as the percentage change compared with fiscal year 2005 to 2006 for each federal organization.
| Federal organization | Emissions from facilities for fiscal year 2005 to 2006 (kt CO2 eq) | Emissions from facilities for fiscal year 2024 to 2025 (kt CO2 eq) | Percentage change compared with fiscal year 2005 to 2006 |
|---|---|---|---|
| National Defence | 735.5 | 455.9 | -38% |
| Public Services and Procurement Canada | 269.8 | 109.2 | -60% |
| Correctional Service Canada | 137.4 | 87.3 | -36% |
| Royal Canadian Mounted Police | 95.6 | 61.2 | -36% |
| Agriculture and Agri-Food Canada | 91.2 | 41.1 | -55% |
| National Research Council Canada | 71.3 | 39.8 | -44% |
| Fisheries and Oceans Canada | 38.5 | 22.9 | -41% |
| Natural Resources Canada | 32.5 | 17.2 | -47% |
| Parks Canada | 28.5 | 14.6 | -49% |
| Canadian Food Inspection Agency | 26.5 | 13.6 | -49% |
| Environment and Climate Change Canada | 17.4 | 9.9 | -43% |
| Health Canada | 20.4 | 8.3 | -59% |
| Canada Border Services Agency | 8.4 | 5.9 | -30% |
| Public Health Agency of Canada | 7.1 | 6.7 | -5% |
| Transport Canada | 6.8 | 4.1 | -40% |
| Communications Security Establishment | 10.1 | 5.4 | -47% |
| Public Safety Canada | 6.8 | 4.7 | -30% |
| Library and Archives Canada | 4.0 | 2.4 | -38% |
| Polar Knowledge Canada | N/A | 1.9 | N/A |
| Canadian Space Agency | 2.4 | 1.3 | -44% |
| Shared Services Canada | 1.3 | 1.3 | 7% |
| Innovation, Science and Economic Development Canada | 1.1 | 0.5 | -51% |
| Canadian Forces Morale and Welfare Services | 2.4 | 0.8 | -66% |
| Crown-Indigenous Relations and Northern Affairs Canada | 0.3 | 0.2 | -51% |
| National Battlefields Commission | 0.1 | 0.2 | 34% |
| Indigenous Services Canada | 0.5 | 0.04 | -92% |
| Total | 1,615 | 917 | -43.3% |
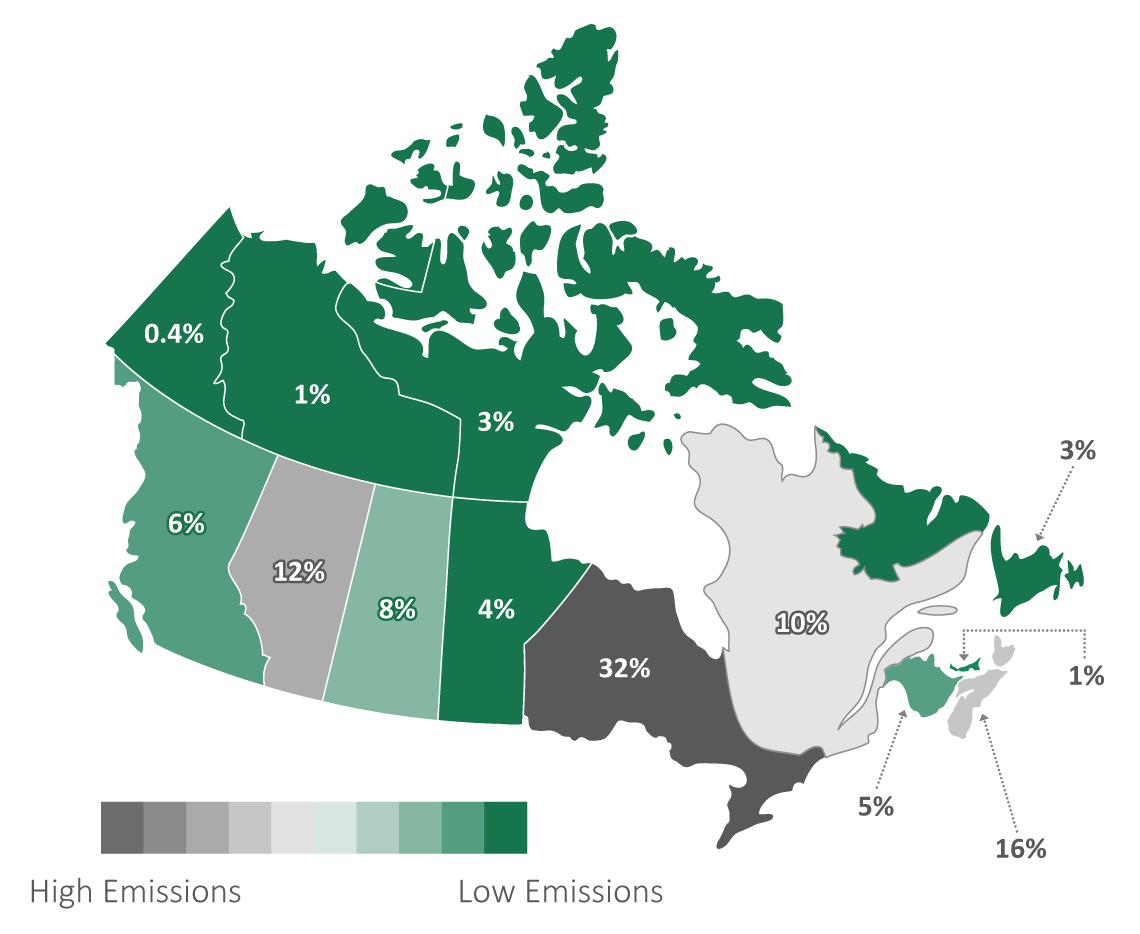
Figure 5 - Text version
The figure is a map of Canada that shows the regional distribution of GHG emissions from federal facilities in fiscal year 2024 to 2025.
| Region | Emissions from stationary combustion (kt CO2 eq) | Emissions from electricity (kt CO2 eq) | Emissions from district energy (kt CO2 eq) | Total from all sources (kt CO2 eq) | Percentage share of total GHG emissions |
|---|---|---|---|---|---|
| Ontario | 203.5 | 53.7 | 38.7 | 295.9 | 32% |
| Nova Scotia | 45.0 | 98.5 | 1.1 | 144.6 | 16% |
| Alberta | 101.9 | 2.6 | 0.0 | 106.5 | 12% |
| Quebec | 86.4 | 0.9 | 2.1 | 92.5 | 10% |
| Saskatchewan | 32.1 | 39.2 | 5.2 | 72.6 | 8% |
| British Columbia | 44.8 | 4.4 | 1.3 | 50.5 | 6% |
| New Brunswick | 25.4 | 20.8 | 0.5 | 46.7 | 5% |
| Manitoba | 31.0 | 0.3 | 1.3 | 32.5 | 4% |
| Nunavut | 22.8 | 5.8 | 0.0 | 28.6 | 3% |
| Newfoundland and Labrador | 25.4 | 1.3 | 0.0 | 26.7 | 3% |
| Northwest Territories | 6.0 | 2.9 | 0.0 | 9.0 | 1% |
| Prince Edward Island | 3.0 | 3.5 | 1.0 | 7.6 | 1% |
| Yukon | 3.1 | 0.5 | 0.0 | 3.3 | 0.4% |
| Total | 630 | 234 | 51 | 917 | 100% |
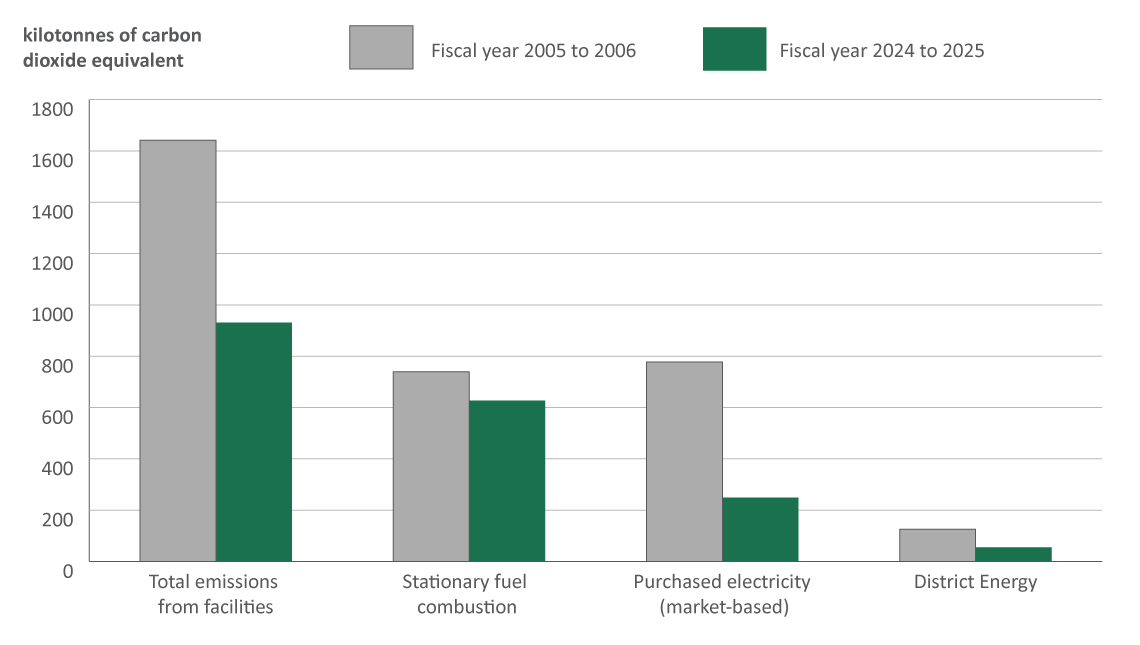
Figure 6 - Text version
The bar graph shows the GHG emissions generated by federal facilities in kilotonnes of carbon dioxide equivalent in total and by source for fiscal years 2005 to 2006 and 2024 to 2025.
| Source of Energy | Emissions for fiscal year 2005 to 2006 (kt CO2 eq) | Emissions in for fiscal year 2024 to 2025 (kt CO2 eq) | Percentage change compared with fiscal year 2005 to 2006 |
|---|---|---|---|
| Stationary fuel combustion | |||
| Natural gas | 550.7 | 537.4 | -2.4% |
| Light fuel oil | 60.3 | 50.1 | -17% |
| Heavy fuel oil | 68.8 | 0.0 | -100% |
| Jet fuel | 26.8 | 20.9 | -22% |
| Diesel | 21.3 | 11.6 | -46% |
| Propane | 10.9 | 11.2 | 3% |
| Kerosene | 0.0 | 0.6 | N/A |
| Purchased electricity | |||
| Market-based | 750.9 | 234.4 | -69% |
| Location-based | 750.9 | 329.6 | -58% |
| District energy | |||
| Heating | 102.3 | 50.4 | -51% |
| Cooling | 23.7 | 0.8 | -97% |
| Facilities total (market) | 1,616 | 917 | -43% |
| Facilities total (location) | 1,616 | 1,000 | -38% |
Key results
- 26 federal organizations reported GHG emissions generated by federal facilities in fiscal year 2024 to 2025
- The emissions for fiscal year 2024 to 2025 totaled 917 kilotonnes (kt) of carbon dioxide equivalent (CO2 eq) for facilities, which represents a decrease of 699 kt CO2 eq or 43.3% compared with fiscal year 2005 to 2006
- In fiscal year 2024 to 2025, the top 5 emitting organizations (National Defence, Public Services and Procurement Canada, Correctional Service Canada, Royal Canadian Mounted Police and Agriculture and Agri-Food Canada) generated 82% of the Government of Canada’s (GC) facilities emissions
- In fiscal year 2024 to 2025, operations in the top 6 regions (Ontario, Nova Scotia, Alberta, Quebec, Saskatchewan, and British Columbia) generated 83% of the GC’s facilities emissions
- A significant amount of emissions generated by purchased electricity comes from electricity use in regions that have high-carbon emitting electricity grids, including Nova Scotia (42%), Saskatchewan (17%), Alberta (1.1%) and New Brunswick (8.9%). Although 87% of electricity generated in Ontario is from non-emitting sources, the province still accounts for 23% of the government’s electricity emissions because it has the largest proportion of the facilities portfolio.
- Breakdown of emissions from natural gas used in federal facilities:
- 37% in Ontario
- 19% in Alberta
- 16% in Quebec
- 7% in British Columbia
- 46% of emissions from light fuel oil came from operations in Newfoundland and Labrador and an additional 35% of emissions from light fuel oil were generated in the other Atlantic provinces and Quebec
- 79% of GHG emissions from district energy came from plants located in the National Capital Region
- Stationary fuel combustion, primarily used to generate heat at facilities, was the source of a significant amount (69%) of GHG emissions in fiscal year 2024 to 2025, but has decreased by 15% compared with fiscal year 2005 to 2006
- Purchased electricity generated a significant amount (26%) of GHG emissions in fiscal year 2024 to 2025, but emissions from electricity use have decreased by 69% compared with fiscal year 2005 to 2006.
- The 699 kt CO2 eq reduction in emissions from federal facilities compared with fiscal year 2005 to 2006 can be attributed to:
- a reduction in the GHG intensity of electricity purchased across Canada, which accounted for a reduction of 350 kt CO2 eq
- contracting mechanisms, such as renewable energy certificates, which accounted for an additional reduction of 95 kt CO2 eq
- The reduction in GHG emissions from district heating (52kt CO2 eq) and cooling (23 kt CO2 eq) was significant, but it had a small impact on emission levels since district heating and cooling represents a smaller share of overall energy use
- The remaining 179 kt reduction in emissions can be attributed to the rationalization of the government’s portfolio of buildings, energy efficiency measures and fuel switching resulting in reductions of energy use in the form of:
- stationary fuel combustion (108 kt CO2 eq)
- purchased electricity (71 kt CO2 eq)
More information
Stationary fuel combustion generates heating, cooling, and electricity at federal facilities. Sources of stationary fuel combustion within facilities often include:
- boilers and furnaces to produce heat
- absorption chillers or gas-driven compression units used for cooling
- generators, turbines or co-generation equipment that produce electricity
- other equipment used in facilities, such as lab equipment and kitchen appliances
These GHG emissions are considered to be “direct” because they are generated at the facility.
Purchased electricity refers to the purchase of conventional, grid-tied electricity. GHG emissions from purchased electricity are considered to be “indirect” because the electricity is generated off-site.
Federal organizations use 2 accounting methods to calculate GHG emissions from purchased electricity:
- The location-based method considers the average GHG intensity of the electricity grids that provide electricity, regardless of any contractual arrangements that an organization has for clean electricity. To quantify indirect emissions using the location-based method, reporting organizations use emission factors that are based on the geographic location of each facility and that correspond to the grid-average emission factor of power-generating facilities that supply power to the grid.
- The market-based method reflects GHG emissions from sources of electricity that reporting organizations have chosen. For example, an organization may establish a contractual arrangement to procure clean electricity from specific sources through the use of clean power purchase agreements or renewable energy certificates. For all remaining electricity use at a facility that is not covered by a contractual arrangement, the appropriate grid-average emission factor based on the location of the facility will apply. Progress toward the federal GHG reduction target will be measured using the market-based methodology.
District energy represents the energy used for heating or cooling that is generated off-site. GHG emissions from district energy are also considered to be indirect because the emissions occur at the facility where heating or cooling is generated.
Visit the Open Government portal for more information on GHG emissions generated by federal facilities.