
Indirect greenhouse gas emissions: Procurement
Working with CIRAIG (International Reference Centre for the Life Cycle of Products, Processes and Services) the government has estimated the embodied carbon footprint of the goods and services bought by its central procurement organizations: Public Service and Procurement Canada and Shared Services Canada. This embodied carbon consists of the Scope 3 greenhouse gases released during the lifecycle of a good or the delivery of a service as shown in Figure 1 below. The “use” phase is counted as Scope 1 and 2 emissions. An estimation of the greenhouse gases released in the supply chain for major procurement categories is shown in figure 2 below.

Figure 1 - Text version
The graphic shows the 6 stages of the supply chain lifecycle of a good or service. Extraction is the harvesting of raw materials. Processing is the conversion of raw materials into useful materials. Manufacturing is the assembly of the product into its final form. Distribution is the transport of the product to the end user. Use refers to the use of the product by the end user. End of life refers to the fate of the product after the end user no longer needs it.
This analysis estimated the emissions attributed to the goods and services procured by Public Services and Procurement Canada and Shared Services Canada over the period from 2016 to 2020. The average annual emissions were 4 124 kt CO2 eq for the extraction, processing, manufacturing and distribution lifecycle stages. These Scope 3 emissions were calculated using open IO-Canada, a model for environmentally extended input-output analysis (EEIO), which uses spending to estimate the Scope 3 emissions from the goods and services procured. Figure 2 summarizes the government’s estimated embodied carbon emissions associated with its procurement.
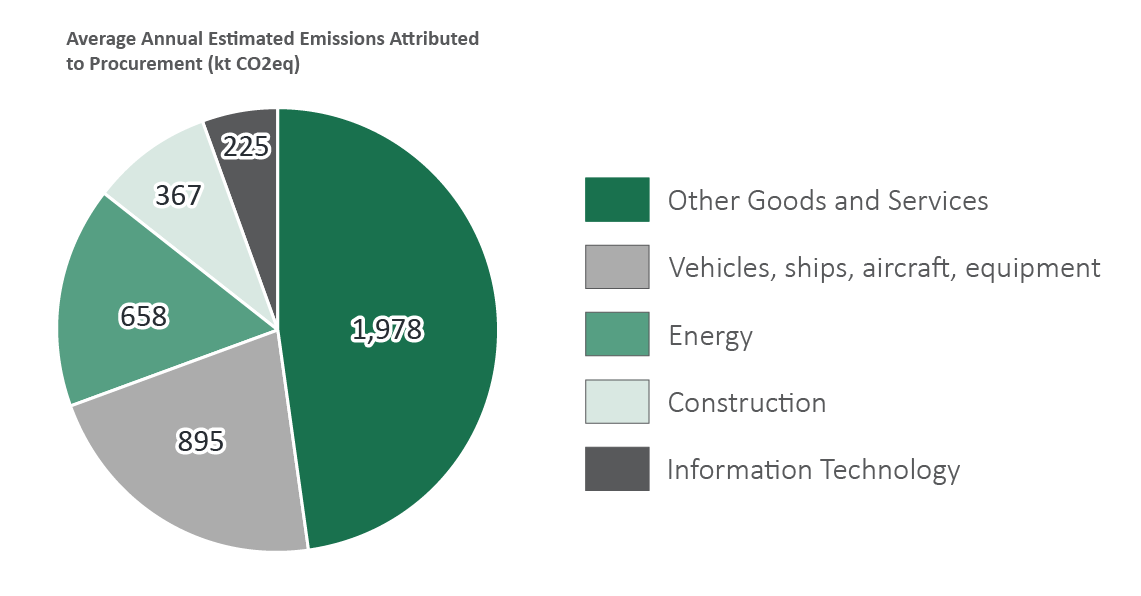
Figure 2 - Text version
The graph shows the 2016-2020 average annual estimated Scope 3 GHG emissions (in kilotonnes of carbon equivalent) attributable to each category of centralized procurement.
Data for the graph
| Procurement Category | Average Annual Estimated Emissions Attributable to Procurement (kt CO2 eq) |
|---|---|
| Other Goods and Services | 1,978 |
| Vehicles, ships, aircraft and equipment | 895 |
| Energy | 658 |
| Construction | 367 |
| Information Technology | 225 |
| Total | 4,124 |
More Information
CIRAIG’s analysis was captured in three reports. The first report estimated the embodied carbon footprint of goods and services procured by Public Services and Procurement Canada in Quebec. Subsequently, the same exercise was completed for the rest of Canada. As a third phase CIRAIG developed an estimate of the footprint of the government’s IT operations for Shared Services Canada.
This study evaluated the life-cycle greenhouse gas emissions associated with procurement in the 5 Public Services and Procurement Canada regions, namely Pacific (British Columbia and the Yukon Territory), Western (Manitoba, Saskatchewan, Alberta, Nunavut, and the Northwest Territories), Ontario, the National Capital Region (Ottawa and Gatineau), and Atlantic (New Brunswick, Nova Scotia, Prince Edward Island and Newfoundland and Labrador). It identified the procurement categories to prioritize for action based on those that generate the most greenhouse gas emissions.
Carbon footprint of purchases by Public Services and Procurement Canada – Quebec Region - CIRAIG
This study identified the procurement categories in the Public Services and Procurement Canada - Quebec region that generated the most greenhouse gas emissions.
Environmental footprint of procurement by Shared Services Canada - CIRAIG
This study builds on and extends the previous carbon footprint studies conducted in 2018 and 2019 by the CIRAIG for Public Services and Procurement Canada. The study used the same methodology to estimate the carbon footprint of Shared Services Canada’s procurement, but it was expanded to cover energy and water consumption.