
The Government of Canada’s progress on environmental indicators: Trends
The Government of Canada is committed to greening multiple aspects of its operations and reporting on progress. The following targets are outlined in the Greening Government Strategy:
- enhance the climate resilience of its critical assets, services and activities by 2035 while managing financial risks related to the impacts of climate change
- divertFootnote 1 at least 75% by weight of non-hazardous operational (NHO) waste from landfills by 2030
- divert at least 90% by weight of all construction, renovation and demolition (CRD) waste from landfills; by 2030, departments will strive to achieve 100% diversion for all CRD waste from landfills
- reduce water consumption and load on municipal systems

Figure 1 - Text version
For each fiscal year from 2021–22 to 2024-25, the bar graph shows the number of federal organizations that have completed, initiated or not initiated a departmental climate risk assessment.
| Fiscal year | Completed | Initiated | Not initiated |
|---|---|---|---|
| 2021–22 | 6 | 8 | 12 |
| 2022–23 | 12 | 6 | 8 |
| 2023–24 | 15 | 7 | 6 |
| 2024–25 | 15 | 12 | 3 |
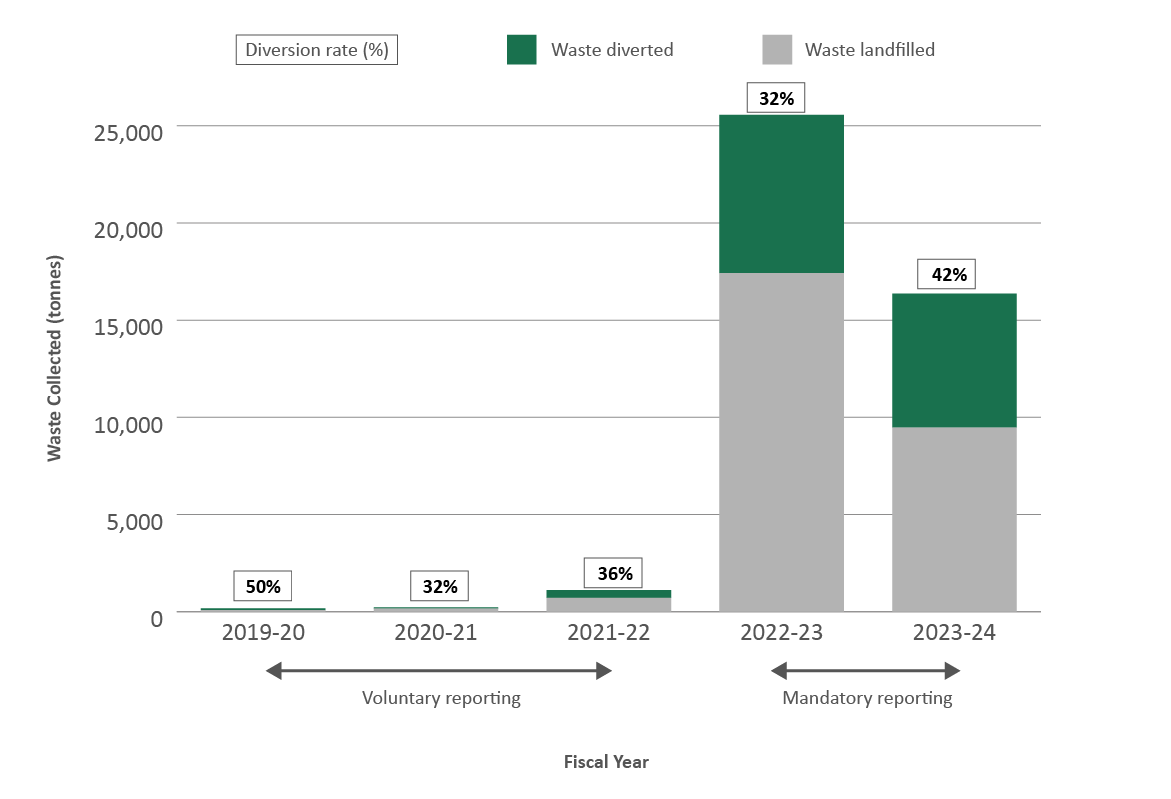
Figure 2 - Text version
For each fiscal year from 2022–23 to 2024–25, the bar graph shows the weight of non-hazardous operational waste that is diverted from landfill and not diverted. Above each bar is the percentage of waste diversion.
| Fiscal year | Waste diverted (tonnes (t)) | Waste to landfill (t) | Diversion rate | Number of organizations |
|---|---|---|---|---|
| 2022–23 | 8,134 | 17,422 | 32% | 22 |
| 2023–24 | 6,893 | 9,469 | 42% | 22 |
| 2024–25 | 8,608 | 10,034 | 46% | 22 |
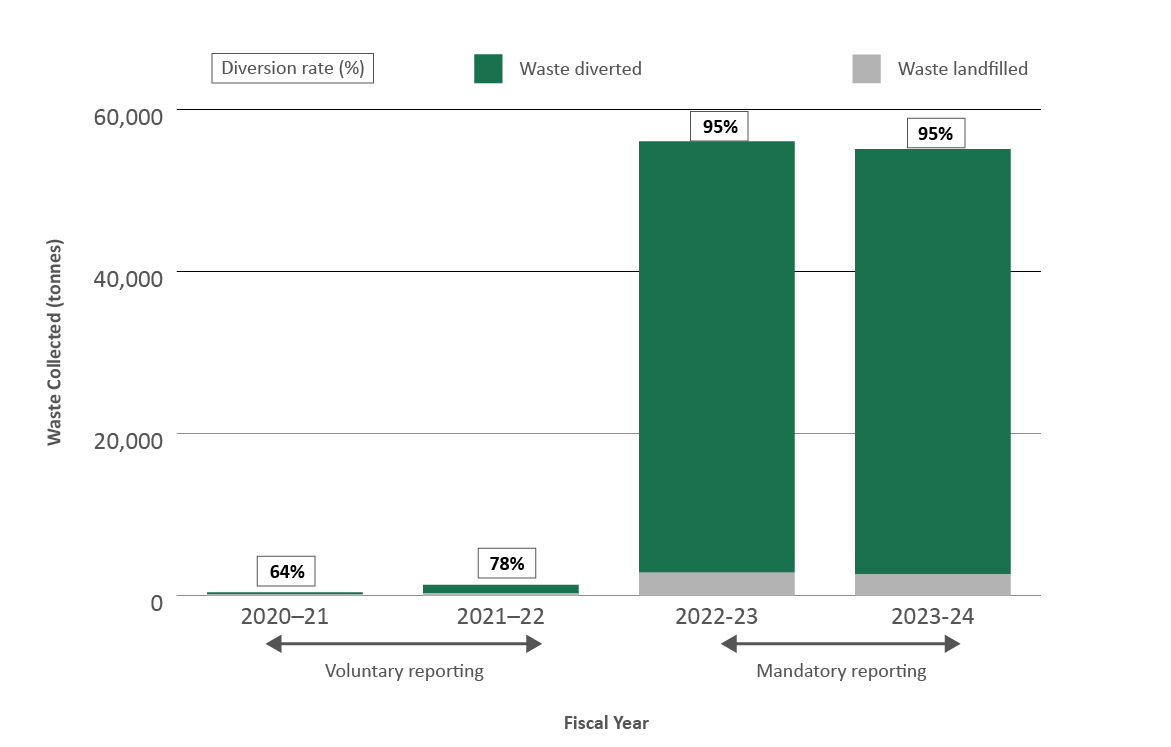
Figure 3 - Text version
For each fiscal year from 2022–23 to 2024–25, the bar graph shows the weight of construction, renovation and demolition waste that is diverted from landfill and not diverted. Above each bar is the percentage of waste diversion.
| Fiscal year | Waste diverted (t) | Waste to landfill (t) | Diversion rate | Number of organizations |
|---|---|---|---|---|
| 2022–23 | 53,231 | 2,835 | 95% | 8 |
| 2023–24 | 52,526 | 2,608 | 95% | 7 |
| 2024–25 | 17,940 | 7,107 | 72% | 4 |

Figure 4 - Text version
For each fiscal year from 2022–23 to 2024–25, the bar graph shows the amount of water consumed in federal operations by municipal or other water source. Above each bar is the number of federal organizations reporting.
| Fiscal year | Municipal (cubic metres (m3)) | Other (m3) | Number of organizations |
|---|---|---|---|
| 2022–23 | 13,321,577 | 7,704,193 | 23 |
| 2023–24 | 13,396,834 | 5,560,016 | 24 |
| 2024–25 | 11,942,886 | 3,274,166 | 23 |
Key results
- Over the last three years, federal organizations have made progress on assessing climate risks to their services, activities and assets. Once the risks are known, organizations can determine appropriate response measures to reduce the risks and minimize the disruption to the delivery of services to Canadians. Climate risk assessments and response measures complement existing business continuity planning by federal organizations.
- The proportion of non-hazardous operational waste diverted from landfill has been increasing. Occupancy levels in federal buildings have been increasing in line with the Direction on prescribed presence in the workplace. Departments are resuming waste audits to enable quantification of the waste stream and report on more facilities.
- For CRD waste diversion the 90% target was exceeded for 2 years but moderated in 2024-25 due to a large amount of asphalt that was difficult to divert from landfill.
- For CRD projects, diversion rates vary with the number of projects completed in any given year. They are also affected by the type of project and building, which will drive the types of waste generated. Some waste streams are more easily diverted than others, depending on locally available options. The Greening Government Strategy includes an aspirational target for departments to strive to achieve 100% diversion from landfill for all CRD waste by 2030.
- Water consumption levels will vary in the coming years based on fluctuating building occupancy levels. Municipal water systems are the dominant source of water for federal buildings, particularly in urban areas. In more remote areas, other sources, such as groundwater, surface water and rainwater, would be more prevalent.