
The Government of Canada’s progress on environmental indicators: Non-hazardous operational waste
The Government of Canada is reducing the amount of waste going to landfill. Non-hazardous operational (NHO) waste comes from our buildings, including offices, military facilities, laboratories and correctional facilities, among others. It consists of materials such as paper, cardboard, plastics, metals, organics and glass. Reporting by departments is mandatory for their facilities that have a floor area of over 10,000 square metres (m2), in an area with a population of over 100,000 and/or where waste diversion services are available.
The following figures provide an overview of the progress toward the target of diverting at least 75% by weight of NHO waste from landfills by 2030.
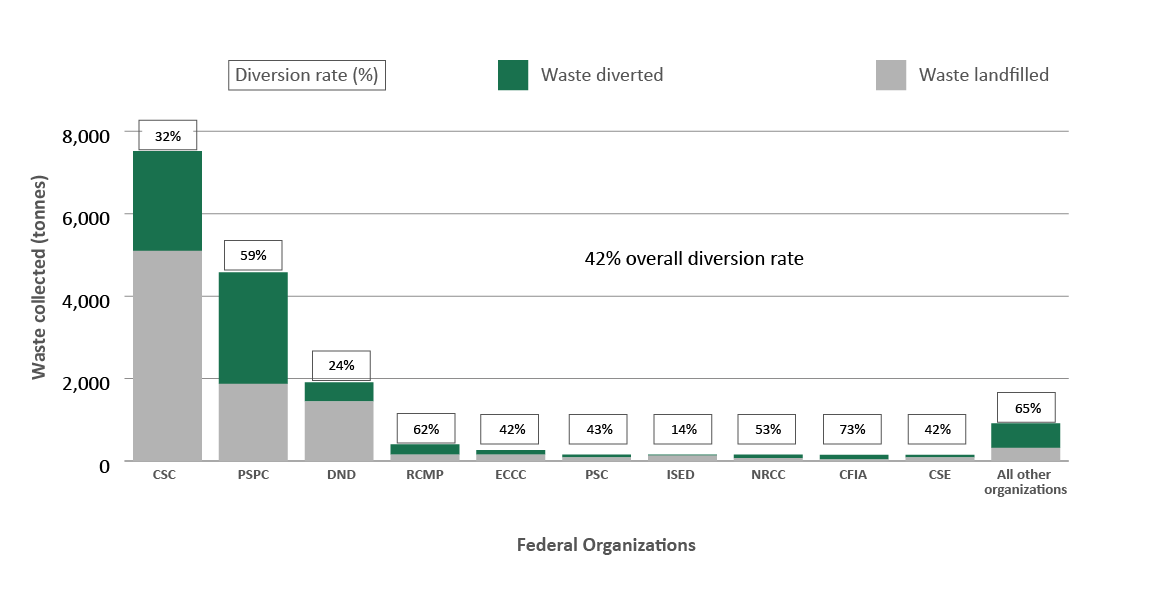
Figure 8 - Text version
The bar graph shows the weight of non-hazardous operational waste diverted and landfilled in fiscal year 2024–25 by federal organization. Above each bar is the organization’s percentage diversion rate.
| Federal organization | Waste diverted (t) | Waste landfilled (t) | Diversion rate | Facilities reporting |
|---|---|---|---|---|
| Correctional Service Canada | 2,534 | 6,133 | 29% | 41 |
| Public Services and Procurement Canada | 2,333 | 1,434 | 62% | 164 |
| Royal Canadian Mounted Police | 2,086 | 154 | 93% | 6 |
| National Defence | 462 | 1,449 | 24% | 4 |
| Communications Security Establishment Canada | 138 | 123 | 53% | 1 |
| Fisheries and Oceans Canada | 176 | 48 | 79% | 16 |
| Environment and Climate Change Canada | 81 | 137 | 37% | 3 |
| Agriculture and Agri-Food Canada | 103 | 75 | 58% | 4 |
| Health Canada | 83 | 79 | 51% | 6 |
| National Research Council Canada | 81 | 73 | 53% | 8 |
| All other organizations | 529 | 330 | 62% | 35 |
Canadian Food Inspection Agency |
111 | 40 | 73% | 1 |
Public Safety Canada |
73 | 70 | 51% | 1 |
Library and Archives Canada |
122 | 21 | 85% | 4 |
Natural Resources Canada |
61 | 44 | 58% | 15 |
Canadian Space Agency |
87 | 17 | 84% | 2 |
Canadian Forces Morale and Welfare Services |
36 | 31 | 54% | 4 |
Innovation, Science and Economic Development Canada |
17 | 30 | 36% | 1 |
Canada Border Services Agency |
8 | 37 | 19% | 1 |
Transport Canada |
8 | 27 | 22% | 1 |
Shared Services Canada |
6 | 4 | 59% | 2 |
Indigenous Services Canada |
0 | 9 | 0% | 1 |
Public Health Agency of Canada |
1 | 0.2 | 75% | 2 |
| Total | 7,854 | 10,034 | 44% | 288 |

Figure 9 - Text version
The bar graph shows the weight of non-hazardous operational waste diverted and landfilled in fiscal year 2024–25 by waste category. Above each bar is the percentage diversion rate for each waste category.
| Waste category | Waste diverted (t) | Waste landfilled (t) | Diversion rate |
|---|---|---|---|
| Compostable | 3,561 | 5,169 | 41% |
| Other | 683 | 2,184 | 24% |
| Paper | 1,806 | 968 | 65% |
| Cardboard | 1,667 | 446 | 79% |
| Plastics | 329 | 1,020 | 24% |
| Metal | 513 | 176 | 74% |
| Glass | 48 | 51 | 48% |
| Jurisdiction | Waste diverted (t) | Waste landfilled (t) | Percentage diversion |
|---|---|---|---|
| Ontario | 3,311 | 2,952 | 53% |
| Quebec | 1,836 | 2,402 | 43% |
| British Columbia | 948 | 823 | 54% |
| Alberta | 510 | 893 | 36% |
| Manitoba | 309 | 1,009 | 23% |
| Saskatchewan | 335 | 801 | 29% |
| New Brunswick | 217 | 761 | 22% |
| Nova Scotia | 219 | 245 | 47% |
| Newfoundland and Labrador | 45 | 77 | 37% |
| Yukon | 69 | 19 | 79% |
| Prince Edward Island | 30 | 45 | 40% |
| Northwest Territories | 25 | 7 | 78% |
| Canada | 7,854 | 10,034 | 44% |
Key results
- Federal organizations are making progress toward 75% diversion of non-hazardous operational (NHO) waste by 2030. Diversion increased from 42% to 44% year over year.
- As of 2024–25, five organizations have met or exceeded the target. An additional two organizations are within 15% of the target, with four years remaining to achieve it.
- Waste audits, which form the basis of diversion reporting, are resuming as building occupancy levels establish a new normal following the pandemic.
- Diversion rates for cardboard, metal and paper are high, ranging from 65% to 79%.
- The compostable organic and “other” waste categories are the largest waste categories by weight. The “other” category represents materials that are not easily classified into the other categories.
- Waste diversion rates vary across the country. This is both a function of the types of waste generated and the availability of local diversion options for the types of waste generated.
- The greatest opportunities for diversion are in Ontario and Quebec, which have the largest share of the federal real property portfolio and account for 60% of the total waste generated for reported facilities.