
Progress on greening procurement: Clean electricity
In Canada, provinces and territories determine the mix of fuels used to generate electricity. Some fuels, such as coal and natural gas, emit greenhouse gases (GHGs) while others, such as hydro, wind and solar, do not. As a result, the proportion of electricity consumed by federal buildings that is generated from clean (non-emitting) sources varies by jurisdiction. Furthermore, the Government of Canada (GC) purchases renewable energy certificates (RECs) for some of its electricity consumption.
A REC is an instrument that certifies ownership of one megawatt-hour (MWh) of electricity generated from renewable sources, in addition to the associated reduction in emissions. RECs provide a financial incentive to generators to add more renewable electricity supply (such as wind and solar) to the grid, which may displace sources that emit GHGs. The GC prefers to buy RECs or clean electricity in the province where the electricity is consumed.
The GC:
- consumed 2,639 gigawatt hours (GWh) of electricity in 2024-25
- purchased 224 GWh of RECs to compensate for the emissions from electricity consumed in provinces with grids that are emission intensive
About 85 % of the electricity consumed by the GC was from non-emitting sources, including the impact of purchasing RECs. Figure 8 accounts for the purchase of RECs in the calculation of clean electricity as a percentage of total electricity consumed.
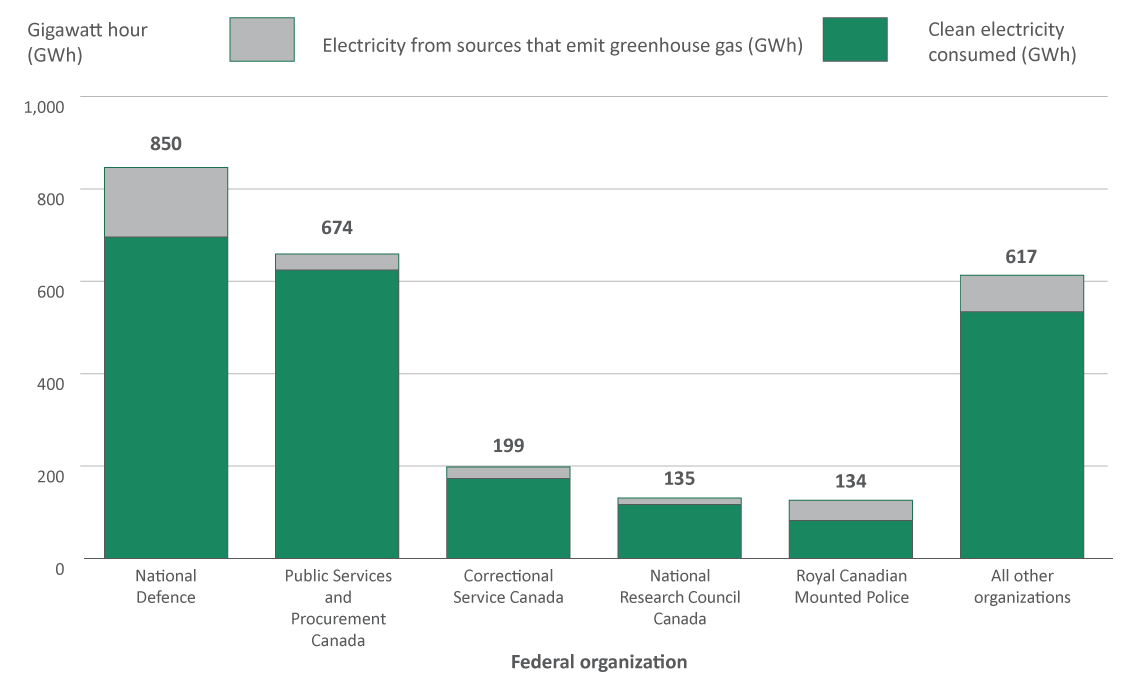
Figure 7 - Text version
The bar graph shows the proportion of electricity consumed from emitting and non-emitting sources for each of the top 5 consuming organizations. A single bar shows the combined consumption proportions for the remaining organizations.
| Federal organization | Total electricity consumed (GWh) | Clean electricity consumed (GWh) | Electricity consumed from sources that emit greenhouse gas (GWh) |
|---|---|---|---|
| National Defence | 882 | 716 | 166 |
| Public Services and Procurement Canada | 673 | 618 | 55 |
| Correctional Service Canada | 193 | 168 | 25 |
| National Research Council Canada | 140 | 121 | 19 |
| Royal Canadian Mounted Police | 126 | 92 | 34 |
| All other organizations | 625 | 535 | 90 |
Note: Totals may not add due to rounding.
| Jurisdiction | Clean electricity consumed as a percentage of the total electricity consumed by the federal government |
|---|---|
| Manitoba | 100% |
| Quebec | 99% |
| Newfoundland and Labrador | 98% |
| British Columbia | 96% |
| Alberta | 98% |
| Yukon | 88% |
| Ontario | 87% |
| New Brunswick | 70% |
| Prince Edward Island | 67% |
| Northwest Territories | 43% |
| Saskatchewan | 40% |
| Nova Scotia | 28% |
| Nunavut | 11% |
| Canada | 85% |
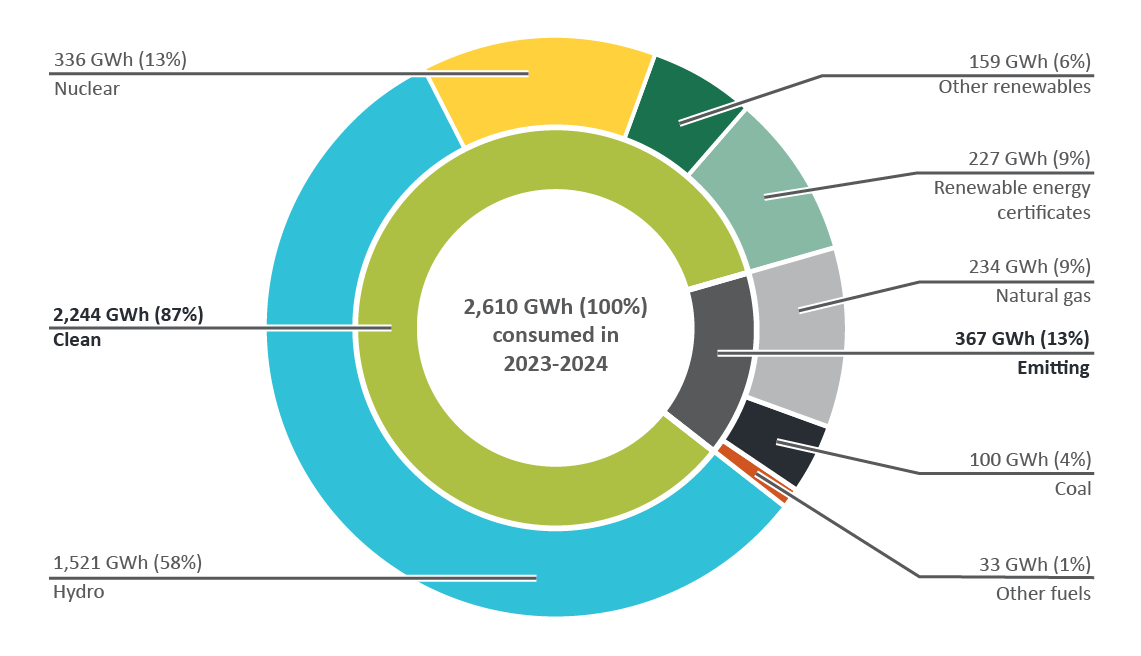
Figure 9 - Text version
The inner circle of the sunburst diagram shows the proportion of electricity consumption from emitting and non-emitting sources. The outer circle further breaks down the emitting and non-emitting segments by generation energy type.
| Source of electricity by type | GWh consumed by the federal government | Percentage of total electricity consumed by the federal government |
|---|---|---|
| Clean sources | 2,205 | 84 % |
Hydro |
1,429 | 54 % |
Nuclear |
363 | 14 % |
Other renewables |
188 | 7 % |
Renewable energy certificates |
224 | 9% |
| Emitting sources | 431 | 16 % |
Natural gas |
308 | 12 % |
Coal |
94 | 3 % |
Other fuels |
29 | 1% |
| Total | 2,639 | 100% |
Key results
- 85 % of the electricity consumed by GC operations was generated from clean sources, including the purchase of renewable energy certificates (RECs).
- Before considering the impact of REC purchases, electricity consumed in Manitoba, Quebec, British Columbia, and Newfoundland and Labrador was the cleanest. Electricity in Nunavut, Nova Scotia, Alberta and Saskatchewan was the most emissions intensive given the high proportion of electricity generation from fuels that emit greenhouse gas (GHG). However, the purchase of RECs in these provinces reduced GHG emissions from electricity use.
- 75 % of electricity consumed by the federal government was generated from clean sources, such as nuclear, hydro, and other renewables, excluding the impact of RECs. Between 2023 and 2024, generation from emitting sources in Ontario increased from 13% to 16%. This has an impact on the GHG emissions of federal operations because the largest proportion of the real property portfolio is in Ontario.
More information
RECs are market instruments that certify ownership of one megawatt-hour (MWh) of electricity generated from renewable sources in addition to the associated reduction in emissions. The purchase of RECs encourages renewable electricity generators to feed more power into the grid, which may displace the generation of electricity from sources that emit GHGs, such as coal and natural gas.