
IRCC Deputy Minister Transition Binder 2019 – Demographics: At a Glance
Workforce Demographics
Includes employment types occupying a substantive position. Data pulled July 26th, 2019.
Workforce excludes EX and EX-feeders.
- 4,518 total employees
- English as a primary language: 69%
- French as a primary language: 31%
Sector Breakdown
Primary Language by Sector
| Primary Language | EXE | Corporate Management Sector (CMS) | Operations Sector (OPS) | Settlement and Integration Sector (SIS) | Strategic and Program Policy Sector (SPP) | Transformation and Digital Sector (TDS) |
|---|---|---|---|---|---|---|
| English | 68% | 46% | 71% | 90% | 76% | 68% |
| French | 31% | 52% | 27% | 9% | 21% | 31% |
| N/A | 1% | 2% | 1% | 2% | 3% | 0% |
Minorities and Gender Breakdown
Employment Equity data includes active Indeterminate and terms >3 months.
- 34% of workforce are visible minorities
- workforce adjustment: 16%
- 67% of workforce are women
- workforce adjustment: 70%
- 4% of workforce are peoples with disabilities
- workforce adjustment: 4%
- 3% of workforce are Indigenous Peoples
- workforce adjustment: 4%
Occupational Group
- Clerical and Regulatory (CR): 40%
- Programme Administration (PM): 38%
- Administrative Services (AS): 12%
- Economics and Social Science Services (EC): 3%
- Foreign Service (FS): 1%
- Others: 6%
Workforce – Locations
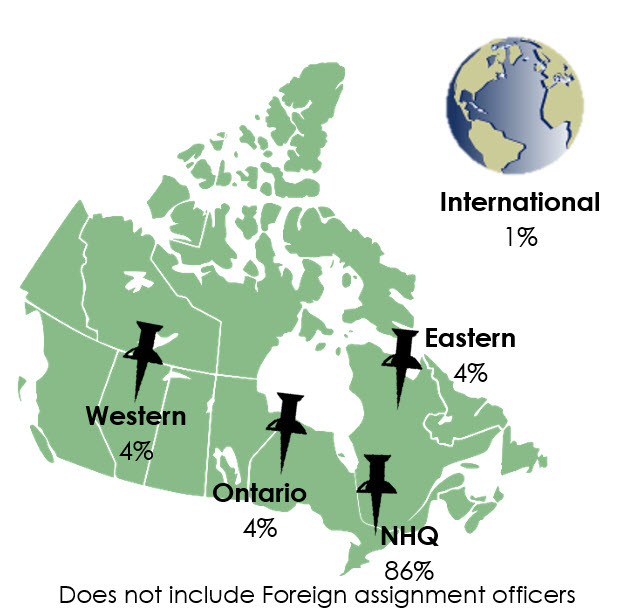
Text version: Workforce – Locations
- 86% National Headquarters (NHQ)
- 4% Western Canada
- 4% Ontario
- 4% Eastern Canada
- 1% International
Doesn’t include Foreign assignment officers
Time at IRCC
- Less than 3 years of service: 47%
- 3-5 years of service: 14%
- 5-10 years of service: 20%
- 10+ years of service: 19%
Workforce – Age Distribution

Text version: Workforce – Age Distribution
Average age: 39| Age Range | 60+ years old | 50-59 years old | 40-49 years old | 30-39 years old | 25-29 years old |
|---|---|---|---|---|---|
| Number of employees | 286 | 952 | 1,282 | 1,678 | 1,802 |
| Percentage of Employees | 5% | 16% | 21% | 28% | 30% |
Workforce – Eligible for retirement (cumulative)
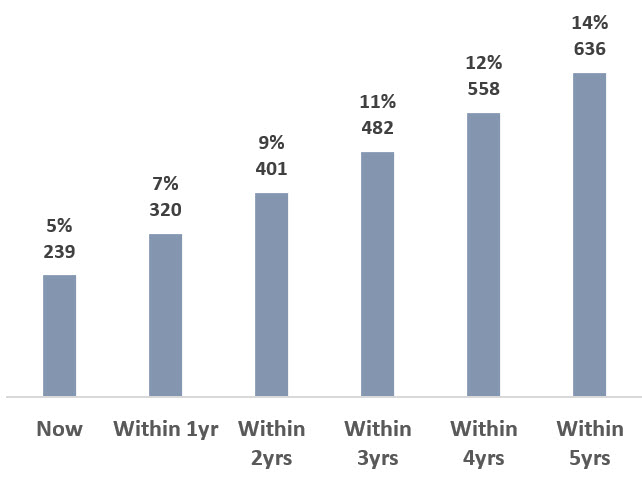
Text version: Workforce – Eligible for retirement (cumulative)
| Eligibility | Now | Within 1 year | Within 2 years | Within 3 years | Within 4 years | Within 5 years |
|---|---|---|---|---|---|---|
| Number of employees | 239 | 320 | 401 | 482 | 558 | 636 |
| Percentage of Employees | 5% | 7% | 9% | 11% | 12% | 14% |
EX Demographics
Includes employment types occupying a substantive position. Data pulled July 26th, 2019.
- 186 total employees
- English as a primary language: 69%
- French as a primary language: 31%
Sector Breakdown
Primary Language by Sector
| Primary Language | Executive Staff (EXE) | Corporate Management Sector (CMS) | Operations Sector (OPS) | Settlement and Integration Sector (SIS) | Strategic and Program Policy Sector (SPP) | Transformation and Digital Sector (TDS) |
|---|---|---|---|---|---|---|
| English | 82% | 43% | 68% | 89% | 82% | 50% |
| French | 18% | 57% | 32% | 11% | 18% | 40% |
| N/A | 0% | 0% | 0% | 0% | 0% | 10% |
Minorities and Gender Breakdown
Employment Equity data includes active Indeterminate and terms >3 months.
- 16% of executives are visible minorities
- workforce adjustment: 8%
- 51% of executives are women
- workforce adjustment: 50%
- 7% of executives are peoples with disabilities
- workforce adjustment: 2%
- <5% of executives are Indigenous Peoples
- workforce adjustment: 6%
Occupational Group
| EX Group | EX-01 | EX-02 | EX-03 | EX-04 | EX-05 |
|---|---|---|---|---|---|
| Number of employees | 115 | 24 | 300 | 4 | 3 |
| Percentage of Employees | 65% | 14% | 17% | 2% | 2% |
EX – Locations
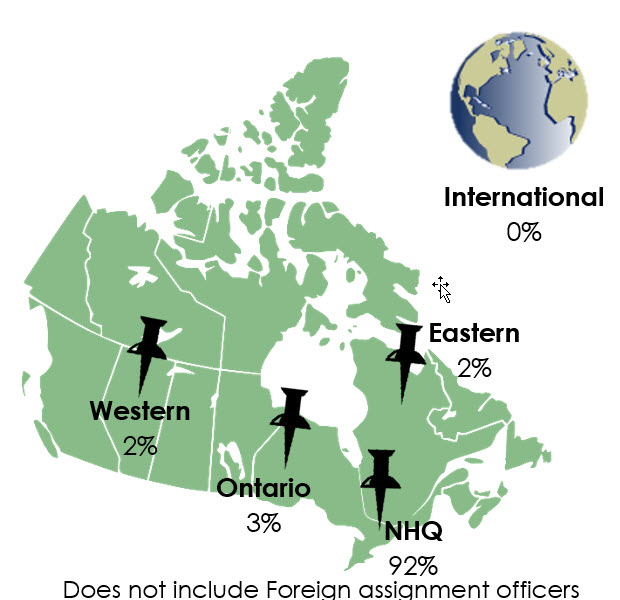
Text version: EX – Locations
- 92% National Headquarters (NHQ)
- 3% Ontario
- 2% Western Canada
- 2% Eastern Canada
- 0% International
Doesn’t include Foreign assignment officers
Time at IRCC
- Less than 3 years of service: 13%
- 3-5 years of service: 11%
- 5-10 years of service: 20%
- 10+ years of service: 55%
EX – Age Distribution
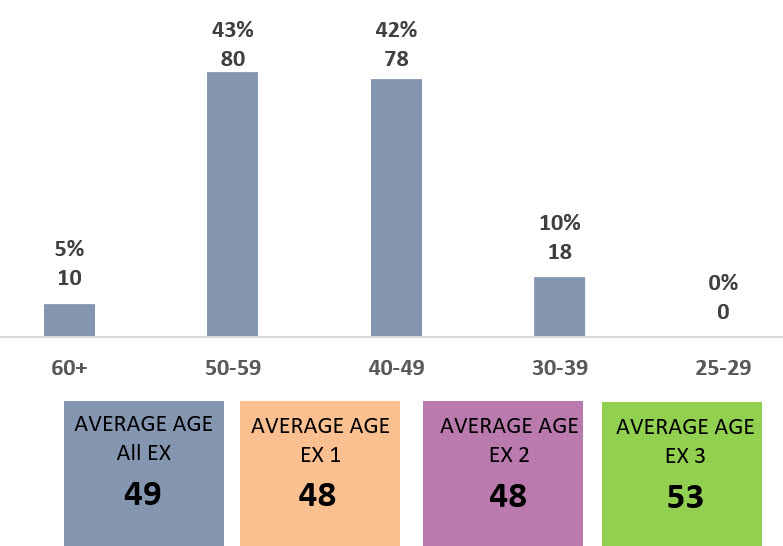
Text version: EX – Age Distribution
- Average age of all EX: 49
- Average age of EX-01: 48
- Average age of EX-02: 48
- Average age of EX-03: 53
| Age Range | 60+ years old | 50-59 years old | 40-49 years old | 30-39 years old | 25-29 years old |
|---|---|---|---|---|---|
| Number of employees | 10 | 80 | 78 | 18 | 0 |
| Percentage of Employees | 5% | 43% | 42% | 10% | 0% |
EX – Eligible for retirement (cumulative)
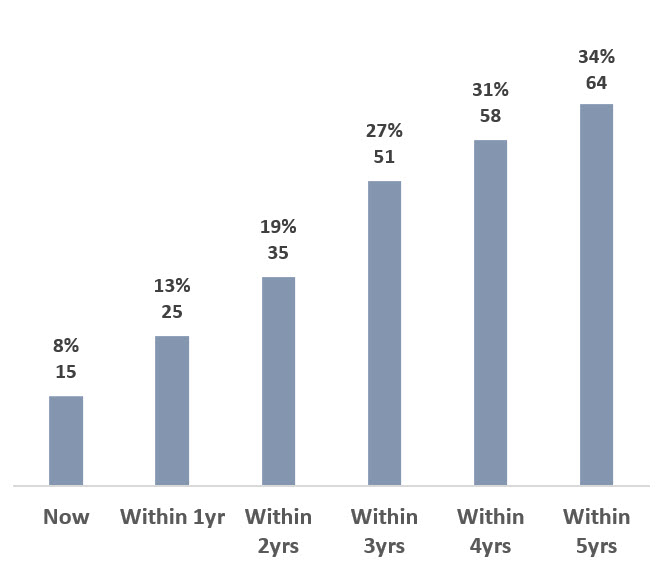
Text version: EX – Eligible for retirement (cumulative)
| Eligibility | Now | Within 1 year | Within 2 years | Within 3 years | Within 4 years | Within 5 years |
|---|---|---|---|---|---|---|
| Number of employees | 15 | 25 | 35 | 51 | 58 | 64 |
| Percentage of Employees | 8% | 13% | 19% | 27% | 31% | 34% |
EX Feeder Demographics
Includes employment types occupying a substantive position. Data pulled July 26th, 2019.
Feeders include EX equivalent, EX minus 1 through 3.
- EX minus 1: 365 employees
- EX minus 2: 1,034 employees
- 2,672 total employees
- English as a primary language: 67%
- French as a primary language: 33%
Sector Breakdown
Primary Language by Sector
| Primary Language | Executive Staff (EXE) | Corporate Management Sector (CMS) | Operations Sector (OPS) | Settlement and Integration Sector (SIS) | Strategic and Program Policy Sector (SPP) | Transformation and Digital Sector (TDS) |
|---|---|---|---|---|---|---|
| English | 68% | 40% | 69% | 74% | 83% | 69% |
| French | 30% | 59% | 31% | 26% | 16% | 30% |
| N/A | 2% | 1% | 0% | 0% | 1% | 1% |
Minorities and Gender Breakdown
Employment Equity data includes active Indeterminate and terms >3 months.
- 24% of EX feeders are visible minorities
- workforce adjustment: 17%
- 60% of EX feeders are women
- workforce adjustment: 58%
- 4% of EX feeders are peoples with disabilities
- workforce adjustment: 4%
- 3% of EX feeders are Indigenous Peoples
- workforce adjustment: 4%
Occupational Group
- Programme Administration (PM): 40%
- Economics and Social Science Services (EC): 18%
- Computer Systems (CS): 14%
- Foreign Service (FS): 10%
- Financial Management (FI): 6%
- Information Services (IS): 4%
- Administrative Services (AS): 4%
- Personnel Administration (PE): 3%
- Others: 1%
EX Feeders – Locations
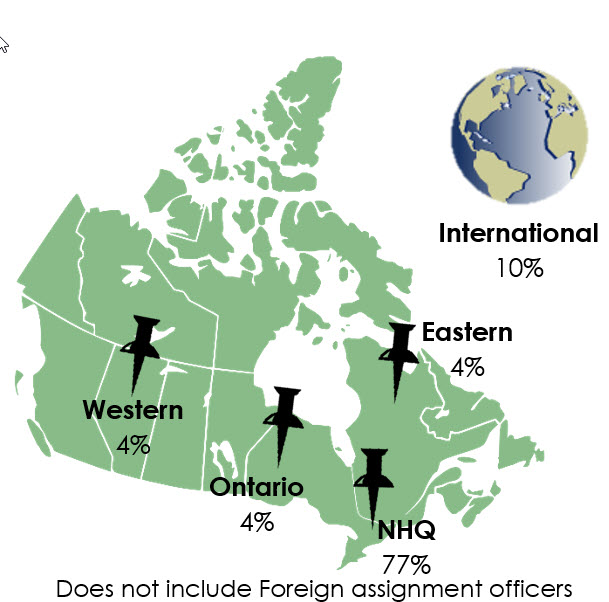
Text version: EX Feeders – Locations
- 77% National Headquarters (NHQ)
- 10% International
- 4% Ontario
- 4% Western Canada
- 4% Eastern Canada
Doesn’t include Foreign assignment officers
Time at IRCC
- Less than 3 years of service: 16%
- 3-5 years of service: 10%
- 5-10 years of service: 30%
- 10+ years of service: 43%
EX Feeders – Age Distribution
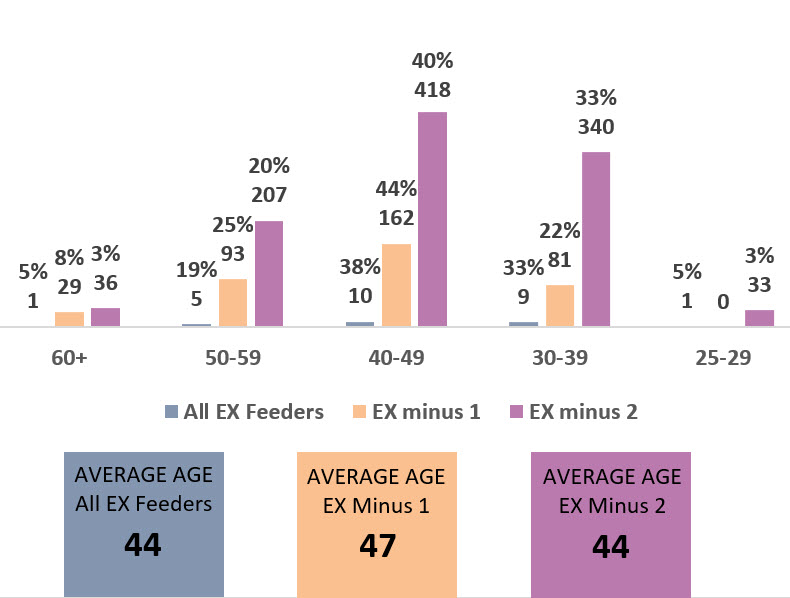
Text version: EX – Age Distribution
- Average age of all EX Feeders: 44
- Average age of EX Minus 1: 47
- Average age of EX Minus 2: 44
| Age Range – All EX Feeders | 60+ years old | 50-59 years old | 40-49 years old | 30-39 years old | 25-29 years old |
|---|---|---|---|---|---|
| Number of employees | 1 | 5 | 10 | 9 | 1 |
| Percentage of Employees | 5% | 43% | 42% | 10% | 0% |
| Age Range – EX Minus 1 | 60+ years old | 50-59 years old | 40-49 years old | 30-39 years old | 25-29 years old |
|---|---|---|---|---|---|
| Number of employees | 29 | 93 | 162 | 81 | 0 |
| Percentage of Employees | 8% | 25% | 44% | 22% | 0% |
| Age Range – EX Minus 2 | 60+ years old | 50-59 years old | 40-49 years old | 30-39 years old | 25-29 years old |
|---|---|---|---|---|---|
| Number of employees | 36 | 207 | 418 | 340 | 33 |
| Number of employees | 3% | 27% | 40% | 33% | 3% |
EX Feeders – Eligible for retirement (cumulative)
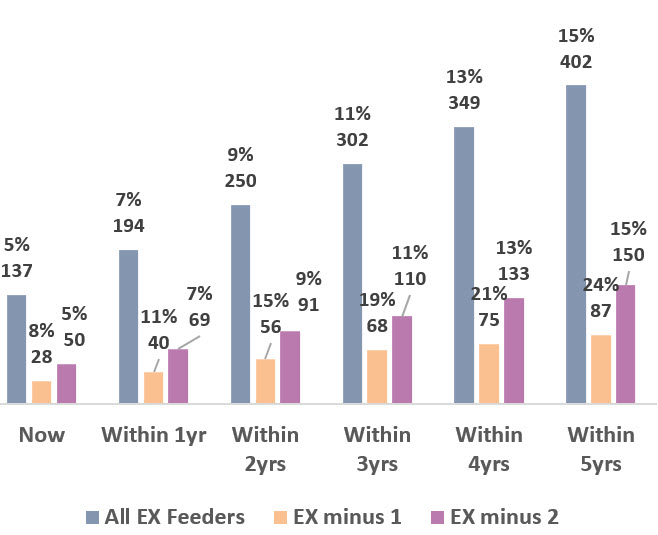
Text version: EX Feeders – Eligible for retirement (cumulative)
| Eligibility – All EX Feeders | Now | Within 1 year | Within 2 years | Within 3 years | Within 4 years | Within 5 years |
|---|---|---|---|---|---|---|
| Number of employees | 137 | 194 | 250 | 302 | 349 | 402 |
| Percentage of Employees | 5% | 7% | 9% | 11% | 13% | 15% |
| Eligibility – All EX Minus 1 | Now | Within 1 year | Within 2 years | Within 3 years | Within 4 years | Within 5 years |
|---|---|---|---|---|---|---|
| Number of employees | 28 | 40 | 56 | 68 | 75 | 87 |
| Percentage of Employees | 8% | 11% | 15% | 19% | 21% | 24% |
| Eligibility – All EX Minus 2 | Now | Within 1 year | Within 2 years | Within 3 years | Within 4 years | Within 5 years |
|---|---|---|---|---|---|---|
| Number of employees | 50 | 69 | 91 | 110 | 133 | 150 |
| Percentage of Employees | 5% | 7% | 9% | 11% | 13% | 15% |
Number of employees
Total number of employees: 8,907
1,168 employees have no position number or location.
Number of employees across Canada
Total number of employees across Canada: 7,437
| Province, Territory or Region | Number of Employees |
|---|---|
| Yukon | 1 |
| Northwest Territories | 1 |
| British Columbia | 253 |
| Alberta | 406 |
| Saskatchewan | 35 |
| Manitoba | 81 |
| Ontario | 811 |
| National Capital Region (NCR) – Ottawa & Gatineau | 4,493 |
| Quebec | 830 |
| New Brunswick | 14 |
| Prince Edward Island | 2 |
| Nova Scotia | 39 |
| Newfoundland and Labrador | 3 |
| City | Number of Employees |
|---|---|
| Whitehorse | 1 |
| Yellowknife | 1 |
| Vancouver | 244 |
| Surrey | 9 |
| Edmonton | 331 |
| Calgary | 75 |
| Saskatoon | 35 |
| Winnipeg | 81 |
| Windsor | 21 |
| London | 16 |
| Hamilton | 31 |
| Kitchener | 19 |
| Niagara Falls | 30 |
| Etobicoke | 309 |
| Mississauga | 281 |
| Toronto | 18 |
| Scarborough | 80 |
| Kingston | 6 |
| Ottawa | 3,316 |
| Gatineau | 1,177 |
| Montréal | 830 |
| Fredericton | 14 |
| Charlottetown | 2 |
| Halifax | 39 |
| Sydney | 468 |
| St. John’s | 3 |
Number of employees around the world
| Country, Territory or City | Number of Employees |
|---|---|
| Canada | 7,437 |
| United States of America | 9 |
|
4 |
|
2 |
|
2 |
|
1 |
| Mexico | 13 |
| Jamaica | 6 |
| Haiti | 2 |
| Colombia | 7 |
| Peru | 2 |
| Trinidad and Tobago | 1 |
| Brazil | 3 |
| Argentina | 2 |
| United Kingdom | 17 |
| Belgium | 1 |
| France | 8 |
| Switzerland | 2 |
| Italy | 6 |
| Germany | 1 |
| Poland | 6 |
| Austria | 4 |
| Ukraine | 2 |
| Romania | 2 |
| Russia | 2 |
| Morocco | 3 |
| Algeria | 1 |
| Tunisia | 2 |
| Egypt | 3 |
| Senegal | 7 |
| Ghana | 5 |
| Nigeria | 2 |
|
1 |
|
1 |
| Kenya | 12 |
| Tanzania | 5 |
| South Africa | 3 |
| Turkey | 14 |
| Lebanon | 10 |
| Israel | 1 |
| Jordan | 7 |
| Saudi Arabia | 3 |
| United Arab Emirates (UAE) | 11 |
| Pakistan | 3 |
| India | 43 |
|
34 |
|
7 |
|
2 |
| Sri Lanka | 4 |
| China | 32 |
|
14 |
|
5 |
|
5 |
|
8 |
| Japan | 1 |
| Thailand | 2 |
| Philippines | 18 |
| Vietnam | 5 |
| Singapore | 6 |
| Indonesia | 2 |
| Australia | 1 |