
2022 Public Service Employee Survey results: Gender
About the data
Methodological notes
About the dashboards
The dashboards show the Public Service Employee Survey (PSES) results for specific demographic groups in comparison with the results for other employees.
About the data
Percentages reflect the total of different possible affirmative responses (in other words, “Strongly agree” and “Somewhat agree” responses; “Always/Almost always” and “Often” responses; “Very high” and “High” responses; “To a large extent” and “To a very large extent” responses; or the selected response from a list).
Percentages exclude the responses “Don’t know” and “Not applicable.”
Results by employment equity group are on the Open Government Portal, in the EEInfoDV dataset.
Results by gender and other identity factors
Women
In the 2022 PSES, 109,150 respondents identified as women.
| Question | Result for women (2020) | Result for women (2022) | Result for all other employees (2022) |
|---|---|---|---|
| Got a sense of satisfaction from their work | 81% | 81% | 76% |
| Felt valued at work | 73% | 75% | 71% |
| Felt encouraged to be innovative | 73% | 75% | 70% |
| Felt they have opportunities to provide input | 72% | 72% | 70% |
| Experienced “high” or “very high” levels of work-related‑ stress | 18% | 18% | 19% |
| Felt emotionally drained after their workday | 33% | 30% | 26% |
| Felt their workplace is psychologically healthy | 70% | 70% | 67% |
| Felt their organization does a good job of raising awareness of mental health in the workplace | 83% | 75% | 71% |
| Experienced harassment in the workplace in the last 12 months | 11% | 10% | 10% |
| Experienced discrimination in the workplace in the last 12 months | 7% | 7% | 8% |
Women with a disability
In the 2022 PSES, 14,590 respondents identified as women with a disability.
| Question | Result for women with a disability | Result for women without a disability |
|---|---|---|
| Got a sense of satisfaction from their work | 77% | 79% |
| Felt valued at work | 68% | 74% |
| Felt encouraged to be innovative | 70% | 74% |
| Felt they have opportunities to provide input | 65% | 72% |
| Experienced “high” or “very high” levels of work-related‑ stress | 28% | 17% |
| Felt emotionally drained after their workday | 43% | 26% |
| Felt their workplace is psychologically healthy | 60% | 70% |
| Felt their organization does a good job of raising awareness of mental health in the workplace | 68% | 74% |
| Experienced harassment in the workplace in the last 12 months | 19% | 9% |
| Experienced discrimination in the workplace in the last 12 months | 15% | 6% |
Indigenous women
In the 2022 PSES, 4,412 identified as Indigenous women.
| Question | Result for Indigenous women | Result for non- Indigenous women |
|---|---|---|
| Got a sense of satisfaction from their work | 81% | 79% |
| Felt valued at work | 72% | 74% |
| Felt encouraged to be innovative | 74% | 73% |
| Felt they have opportunities to provide input | 71% | 71% |
| Experienced “high” or “very high” levels of work-related‑ stress | 20% | 18% |
| Felt emotionally drained after their workday | 33% | 28% |
| Felt their workplace is psychologically healthy | 66% | 69% |
| Felt their organization does a good job of raising awareness of mental health in the workplace | 72% | 74% |
| Experienced harassment in the workplace in the last 12 months | 17% | 10% |
| Experienced discrimination in the workplace in the last 12 months | 11% | 7% |
Racialized women
In the 2022 PSES, 22,878 identified as women in a racialized group (Black, East/Southeast Asian, Latino/Latina/Latinx, Middle Eastern, South Asian, or another racial group).
| Question | Result for racialized women | Result for non- racialized women |
|---|---|---|
| Got a sense of satisfaction from their work | 82% | 79% |
| Felt valued at work | 78% | 74% |
| Felt encouraged to be innovative | 76% | 74% |
| Felt they have opportunities to provide input | 73% | 72% |
| Experienced “high” or “very high” levels of work-related‑ stress | 16% | 18% |
| Felt emotionally drained after their workday | 26% | 27% |
| Felt their workplace is psychologically healthy | 74% | 69% |
| Felt their organization does a good job of raising awareness of mental health in the workplace | 77% | 74% |
| Experienced harassment in the workplace in the last 12 months | 9% | 10% |
| Experienced discrimination in the workplace in the last 12 months | 8% | 6% |
Men
In the 2022 PSES, 69,785 respondents identified as men.
| Question | Result for men employees (2020) | Result for men (2022) | Result for all other employees (2022) |
|---|---|---|---|
| Got a sense of satisfaction from their work | 75% | 76% | 81% |
| Felt valued at work | 70% | 71% | 75% |
| Felt encouraged to be innovative | 69% | 70% | 75% |
| Felt they have opportunities to provide input | 70% | 70% | 72% |
| Experienced “high” or “very high” levels of work-related‑ stress | 18% | 19% | 18% |
| Felt emotionally drained after their workday | 29% | 25% | 30% |
| Felt their workplace is psychologically healthy | 66% | 67% | 70% |
| Felt their organization does a good job of raising awareness of mental health in the workplace | 78% | 71% | 75% |
| Experienced harassment in the workplace in the last 12 months | 10% | 10% | 11% |
| Experienced discrimination in the workplace in the last 12 months | 7% | 7% | 7% |
Another gender
In the 2022 PSES, 716 respondents identified as another gender.
| Question | Result for employees of another gender (2020) | Result for employees of another gender (2022) | Result for all other employees (2022) |
|---|---|---|---|
| Got a sense of satisfaction from their work | 64% | 72% | 79% |
| Felt valued at work | 61% | 72% | 73% |
| Felt encouraged to be innovative | 60% | 69% | 73% |
| Felt they have opportunities to provide input | 58% | 65% | 71% |
| Experienced “high” or “very high” levels of work-related‑ stress | 33% | 28% | 19% |
| Felt emotionally drained after their workday | 49% | 42% | 28% |
| Felt their workplace is psychologically healthy | 47% | 55% | 69% |
| Felt their organization does a good job of raising awareness of mental health in the workplace | 61% | 52% | 73% |
| Experienced harassment in the workplace in the last 12 months | 21% | 23% | 10% |
| Experienced discrimination in the workplace in the last 12 months | 20% | 24% | 7% |
Comparative results by gender and other identity factors
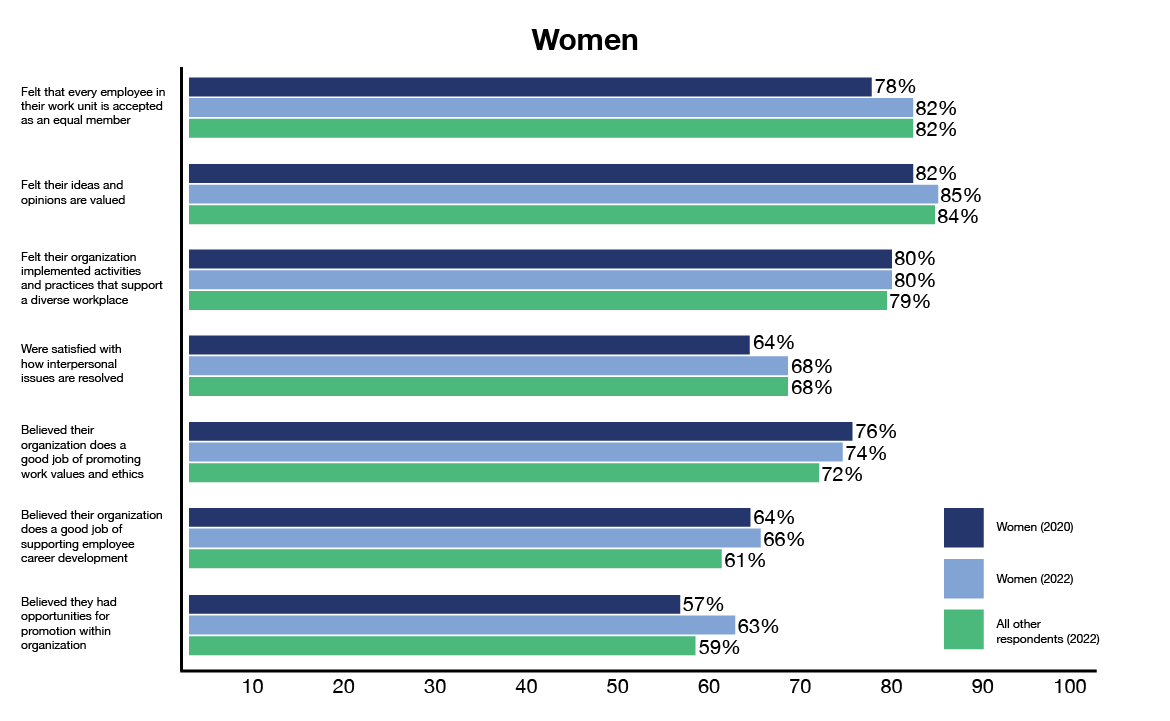
Figure 1 - Text version
| Question | Result for women (2020) | Result for women (2022) | Result for all other employees (2022) |
|---|---|---|---|
| Felt that every employee in their work unit is accepted as an equal member | 78% | 82% | 82% |
| Felt their ideas and opinions are valued | 82% | 85% | 84% |
| Felt their organization implemented activities and practices that support a diverse workplace | 80% | 80% | 79% |
| Were satisfied with how interpersonal issues are resolved | 64% | 68% | 68% |
| Believed their organization does a good job of promoting work values and ethics | 76% | 74% | 72% |
| Believed their organization does a good job of supporting employee career development | 64% | 66% | 61% |
| Believed they had opportunities for promotion within organization | 57% | 63% | 59% |

Figure 2 - Text version
| Question | Result for women with a disability | Result for women without a disability |
|---|---|---|
| Felt that every employee in their work unit is accepted as an equal member | 76% | 83% |
| Felt their ideas and opinions are valued | 79% | 85% |
| Felt their organization implemented activities and practices that support a diverse workplace | 74% | 81% |
| Were satisfied with how interpersonal issues are resolved | 61% | 69% |
| Believed their organization does a good job of promoting work values and ethics | 67% | 74% |
| Believed their organization does a good job of supporting employee career development | 59% | 65% |
| Believed they had opportunities for promotion within organization | 54% | 62% |
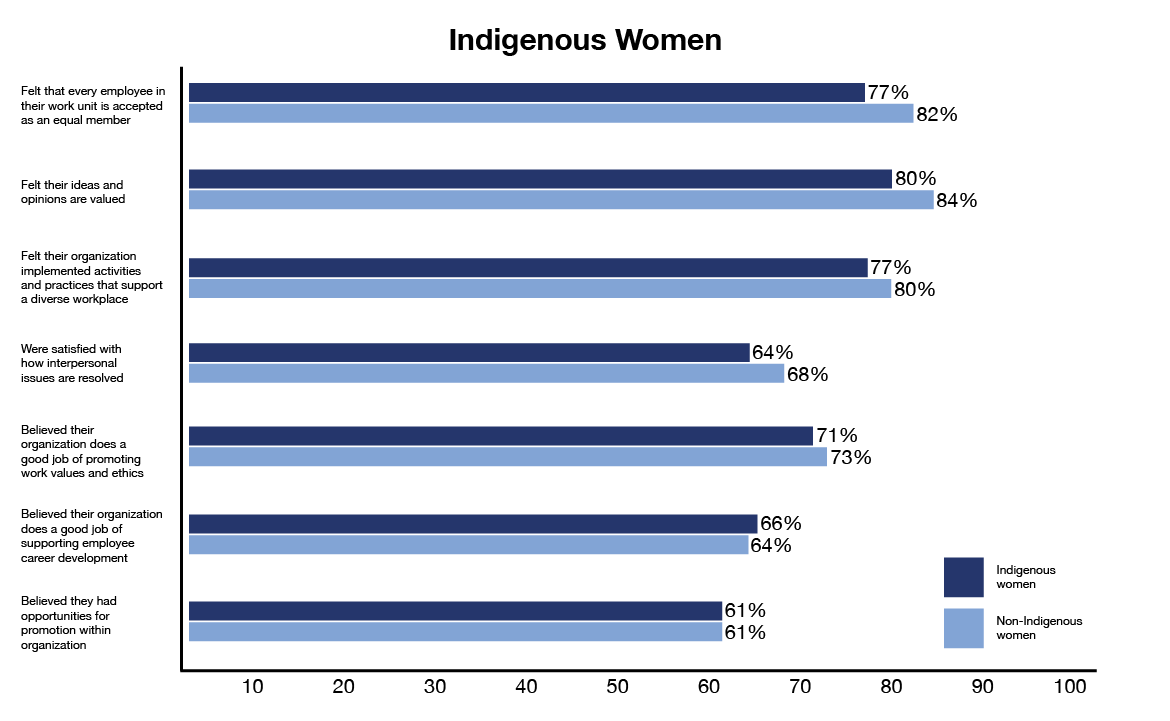
Figure 3 - Text version
| Question | Result for Indigenous women | Result for non-Indigenous women |
|---|---|---|
| Felt that every employee in their work unit is accepted as an equal member | 77% | 82% |
| Felt their ideas and opinions are valued | 80% | 84% |
| Felt their organization implemented activities and practices that support a diverse workplace | 77% | 80% |
| Were satisfied with how interpersonal issues are resolved | 64% | 68% |
| Believed their organization does a good job of promoting work values and ethics | 71% | 73% |
| Believed their organization does a good job of supporting employee career development | 66% | 64% |
| Believed they had opportunities for promotion within organization | 61% | 61% |
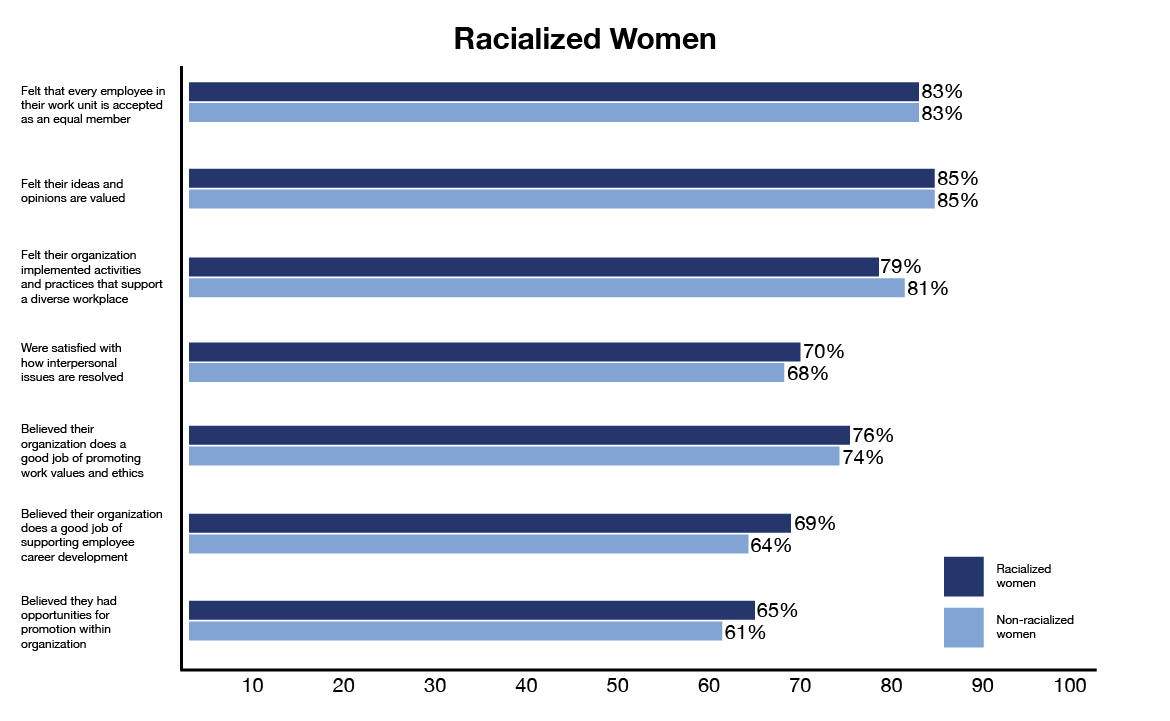
Figure 4 - Text version
| Question | Result for racialized women | Result for non-racialized women |
|---|---|---|
| Felt that every employee in their work unit is accepted as an equal member | 83% | 83% |
| Felt their ideas and opinions are valued | 85% | 85% |
| Felt their organization implemented activities and practices that support a diverse workplace | 79% | 81% |
| Were satisfied with how interpersonal issues are resolved | 70% | 68% |
| Believed their organization does a good job of promoting work values and ethics | 76% | 74% |
| Believed their organization does a good job of supporting employee career development | 69% | 64% |
| Believed they had opportunities for promotion within organization | 65% | 61% |
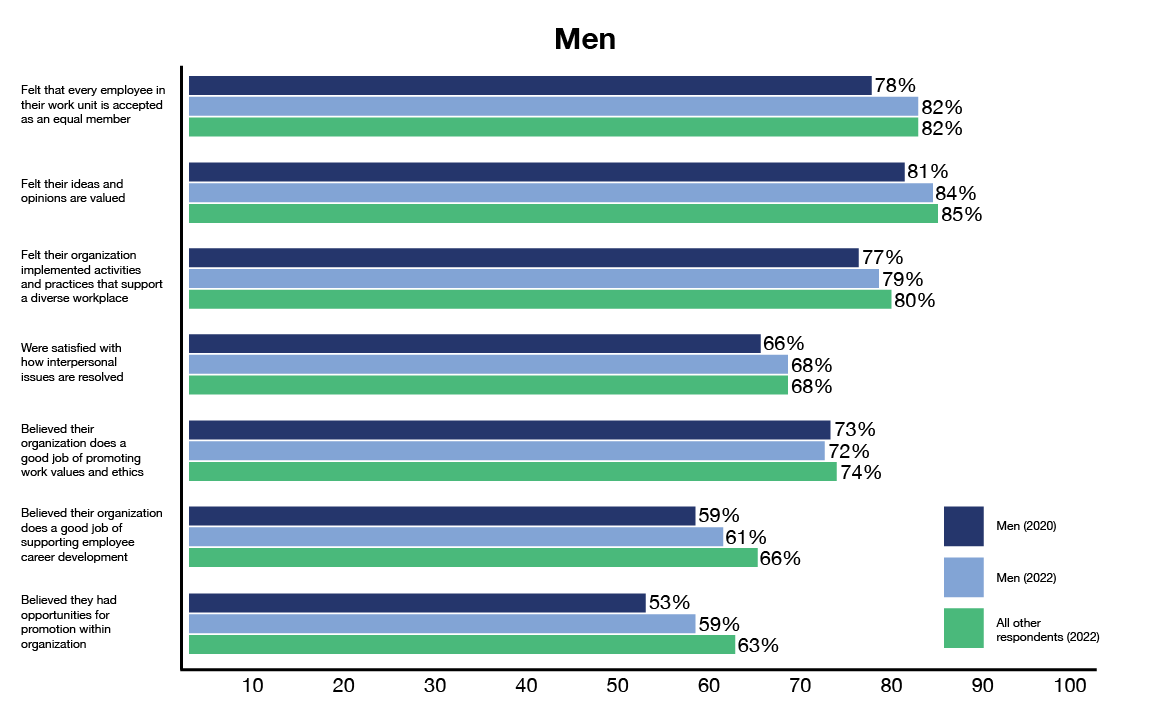
Figure 5 - Text version
| Question | Result for men (2020) | Result for men (2022) | Result for all other employees (2022) |
|---|---|---|---|
| Felt that every employee in their work unit is accepted as an equal member | 78% | 82% | 82% |
| Felt their ideas and opinions are valued | 81% | 84% | 85% |
| Felt their organization implemented activities and practices that support a diverse workplace | 77% | 79% | 80% |
| Were satisfied with how interpersonal issues are resolved | 66% | 68% | 68% |
| Believed their organization does a good job of promoting work values and ethics | 73% | 72% | 74% |
| Believed their organization does a good job of supporting employee career development | 59% | 61% | 66% |
| Believed they had opportunities for promotion within organization | 53% | 59% | 63% |
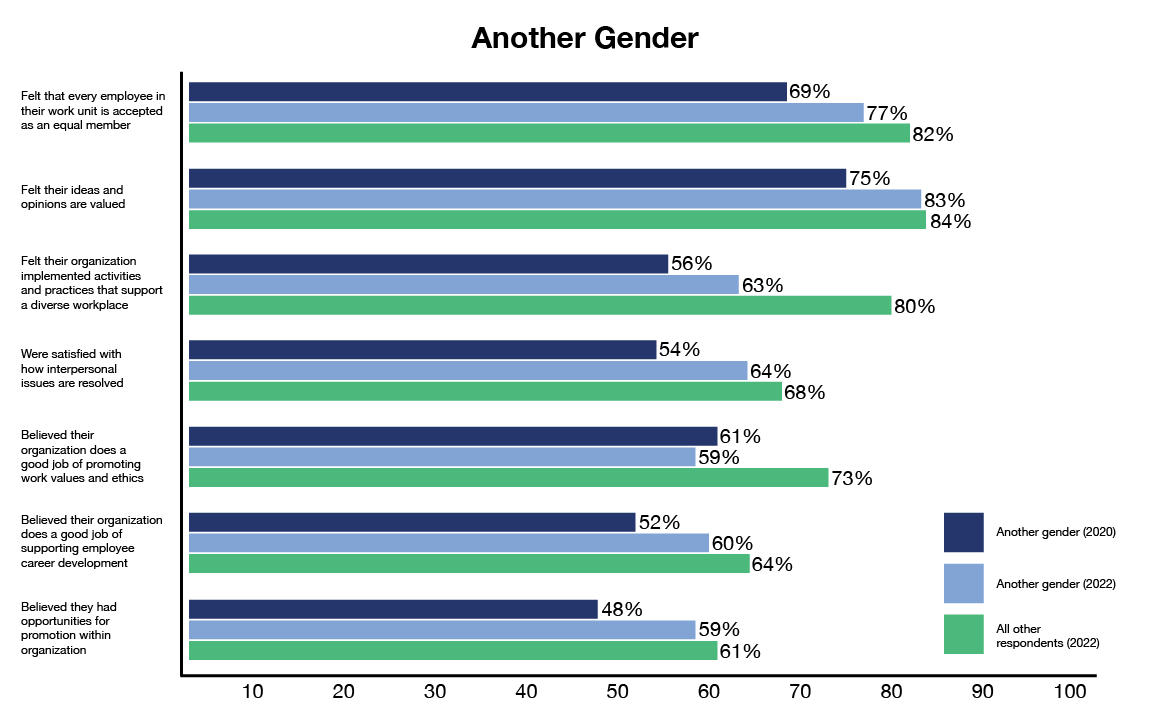
Figure 6 - Text version
| Question | Result for employees of another gender (2020) | Result for employees of another gender (2022) | Result for all other employees (2022) |
|---|---|---|---|
| Felt that every employee in their work unit is accepted as an equal member | 69% | 77% | 82% |
| Felt their ideas and opinions are valued | 75% | 83% | 84% |
| Felt their organization implemented activities and practices that support a diverse workplace | 56% | 63% | 80% |
| Were satisfied with how interpersonal issues are resolved | 54% | 64% | 68% |
| Believed their organization does a good job of promoting work values and ethics | 61% | 59% | 73% |
| Believed their organization does a good job of supporting employee career development | 52% | 60% | 64% |
| Believed they had opportunities for promotion within organization | 48% | 59% | 61% |