
2022 Public Service Employee Survey results: Executives
About the data
Methodological notes
About the dashboards
The dashboards show the Public Service Employee Survey (PSES) results for specific demographic groups in comparison with the results for other employees.
About the data
Percentages reflect the total of different possible affirmative responses (in other words, “Strongly agree” and “Somewhat agree” responses; “Always/Almost always” and “Often” responses; “Very high” and “High” responses; “To a large extent” and “To a very large extent” responses; or the selected response from a list).
Percentages exclude the responses “Don’t know” and “Not applicable.”
Results by employment equity group are on the Open Government Portal, in the EEInfoDV dataset.
Results by group
Executives
In the 2022 PSES, 5,590 respondents were executives.
| Question | Result for executives (2020) | Result for executives (2022) | Result for all other employees (2022) |
|---|---|---|---|
| Felt valued at work | 84% | 82% | 72% |
| Were proud of the work they do | 94% | 93% | 85% |
| Liked their job | 89% | 87% | 81% |
| Intended to leave their position | 40% | 47% | 38% |
| Felt their workplace is psychologically healthy | 76% | 72% | 68% |
| Experienced “high” or “very high” levels of work-related stress | 30% | 37% | 19% |
| Experienced harassment in the workplace in the last 12 months | 8% | 10% | 11% |
| Experienced discrimination in the workplace in the last 12 months | 5% | 6% | 8% |
Executives compared with assistant deputy ministers
| Question | Result for EX 01s, EX 02s and EX 03s | Result for ADMs |
|---|---|---|
| Felt valued at work | 82% | 86% |
| Were proud of the work they do | 93% | 97% |
| Liked their job | 86% | 93% |
| Intended to leave their position | 48% | 44% |
| Felt their workplace is psychologically healthy | 72% | 84% |
| Experienced “high” or “very high” levels of work-related stress | 37% | 32% |
| Experienced harassment in the workplace in the last 12 months | 10% | 8% |
| Experienced discrimination in the workplace in the last 12 months | 6% | 4% |
Executives compared with middle managers
In the 2022 PSES, 5,590 respondents were executives; 40,180 respondents were middle managers (in other words, supervisors but not executives).
| Question | Result for executives | Result for middle managers |
|---|---|---|
| Felt valued at work | 82% | 74% |
| Were proud of the work they do | 93% | 88% |
| Liked their job | 87% | 82% |
| Intended to leave their position | 47% | 37% |
| Felt their workplace is psychologically healthy | 72% | 65% |
| Experienced “high” or “very high” levels of work-related stress | 37% | 28% |
| Experienced harassment in the workplace in the last 12 months | 10% | 11% |
| Experienced discrimination in the workplace in the last 12 months | 6% | 8% |
Middle managers
In the 2022 PSES, 40,180 respondents said they were middle managers (in other words, supervisors but not executives).
| Question | Result for middle managers | Result for all other employees |
|---|---|---|
| Felt valued at work | 74% | 72% |
| Were proud of the work they do | 88% | 84% |
| Liked their job | 82% | 81% |
| Intended to leave their position | 37% | 38% |
| Felt their workplace is psychologically healthy | 65% | 68% |
| Experienced “high” or “very high” levels of work-related stress | 28% | 17% |
| Experienced harassment in the workplace in the last 12 months | 11% | 11% |
| Experienced discrimination in the workplace in the last 12 months | 8% | 8% |
Executive women
In the 2022 PSES, 2,966 respondents were executive women.
| Question | Result for executive women | Result for all other employees |
|---|---|---|
| Felt valued at work | 82% | 73% |
| Were proud of the work they do | 94% | 86% |
| Liked their job | 88% | 82% |
| Intended to leave their position | 46% | 38% |
| Felt their workplace is psychologically healthy | 72% | 69% |
| Experienced “high” or “very high” levels of work-related stress | 37% | 18% |
| Experienced harassment in the workplace in the last 12 months | 12% | 10% |
| Experienced discrimination in the workplace in the last 12 months | 6% | 7% |
Executives with a disability
| Question | Result for executives with a disability | Result for all other employees |
|---|---|---|
| Felt valued at work | 76% | 73% |
| Were proud of the work they do | 93% | 86% |
| Liked their job | 83% | 82% |
| Intended to leave their position | 50% | 38% |
| Felt their workplace is psychologically healthy | 66% | 69% |
| Experienced “high” or “very high” levels of work-related stress | 45% | 19% |
| Experienced harassment in the workplace in the last 12 months | 19% | 10% |
| Experienced discrimination in the workplace in the last 12 months | 13% | 7% |
Racialized executives
| Question | Result for racialized executives | Result for all other employees |
|---|---|---|
| Felt valued at work | 83% | 74% |
| Were proud of the work they do | 94% | 86% |
| Liked their job | 87% | 83% |
| Intended to leave their position | 45% | 38% |
| Felt their workplace is psychologically healthy | 72% | 70% |
| Experienced “high” or “very high” levels of work-related stress | 38% | 18% |
| Experienced harassment in the workplace in the last 12 months | 15% | 10% |
| Experienced discrimination in the workplace in the last 12 months | 11% | 7% |
Indigenous executives
| Question | Result for Indigenous executives | Result for all other employees |
|---|---|---|
| Felt valued at work | 82% | 73% |
| Were proud of the work they do | 94% | 86% |
| Liked their job | 89% | 82% |
| Intended to leave their position | 46% | 38% |
| Felt their workplace is psychologically healthy | 69% | 69% |
| Experienced “high” or “very high” levels of work-related stress | 36% | 19% |
| Experienced harassment in the workplace in the last 12 months | 12% | 10% |
| Experienced discrimination in the workplace in the last 12 months | 8% | 7% |
Comparative results for executives and middle managers
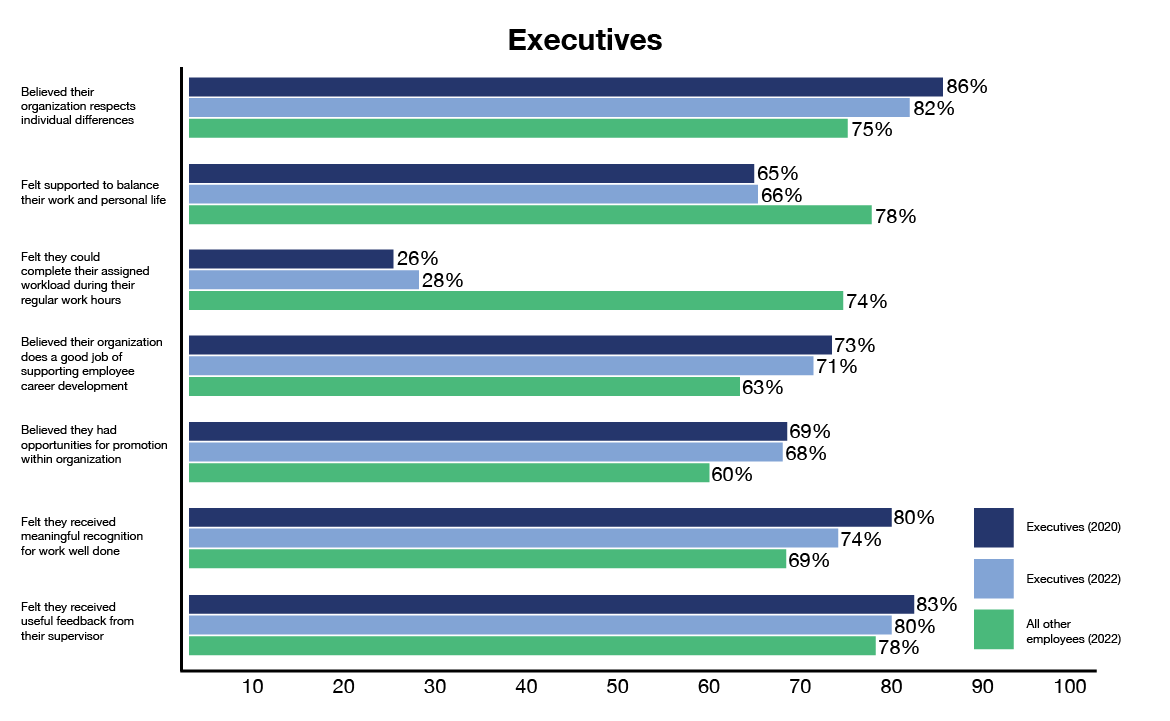
Figure 1 - Text version
| Question | Result for executives (2020) | Result for executives (2022) | Result for all other employees (2022) |
|---|---|---|---|
| Believed their organization respects individual differences | 86% | 82% | 75% |
| Felt supported to balance their work and personal life | 65% | 66% | 78% |
| Felt they could complete their assigned workload during their regular work hours | 26% | 28% | 74% |
| Believed their organization does a good job of supporting employee career development | 73% | 71% | 63% |
| Believed they had opportunities for promotion within organization | 69% | 68% | 60% |
| Felt they received meaningful recognition for work well done | 80% | 74% | 69% |
| Felt they received useful feedback from their supervisor | 83% | 80% | 78% |
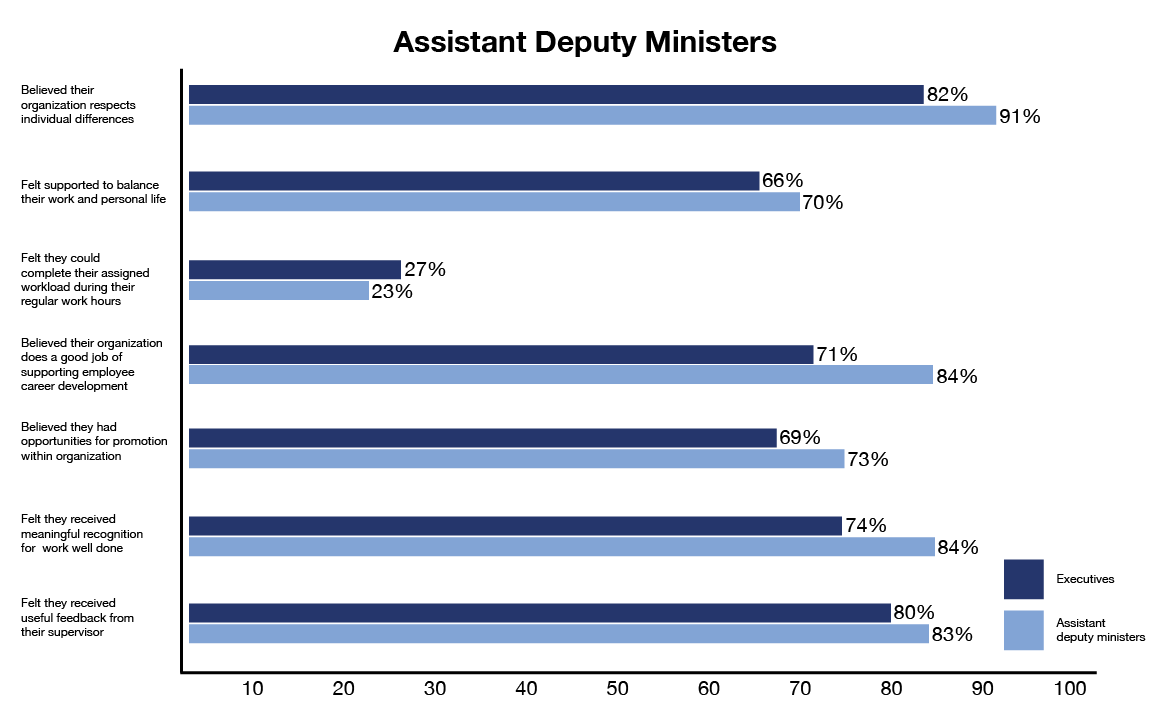
Figure 2 - Text version
| Question | Result for executives | Result for assistant deputy ministers |
|---|---|---|
| Believed their organization respects individual differences | 82% | 91% |
| Felt supported to balance their work and personal life | 66% | 70% |
| Felt they could complete their assigned workload during their regular work hours | 27% | 23% |
| Believed their organization does a good job of supporting employee career development | 71% | 84% |
| Believed they had opportunities for promotion within organization | 69% | 73% |
| Felt they received meaningful recognition for work well done | 74% | 84% |
| Felt they received useful feedback from their supervisor | 80% | 83% |
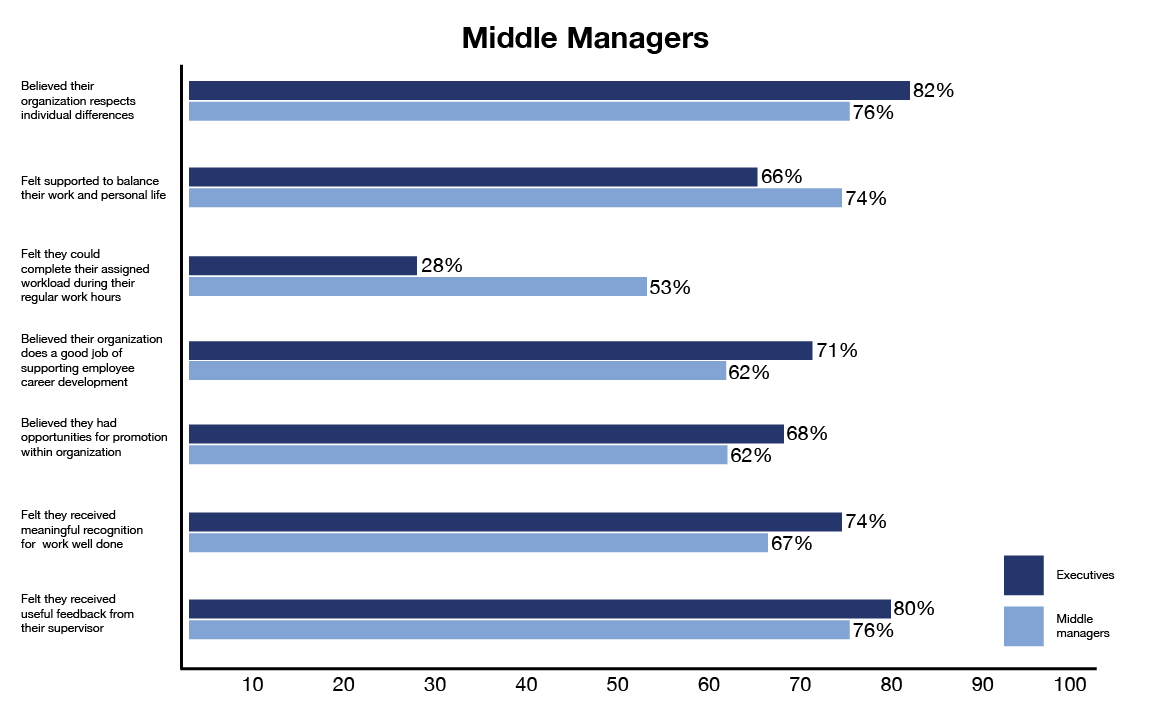
Figure 3 - Text version
| Question | Result for executives | Result for middle managerstable 1 note * |
|---|---|---|
| Believed their organization respects individual differences | 82% | 76% |
| Felt supported to balance their work and personal life | 66% | 74% |
| Felt they could complete their assigned workload during their regular work hours | 28% | 53% |
| Believed their organization does a good job of supporting employee career development | 71% | 62% |
| Believed they had opportunities for promotion within organization | 68% | 62% |
| Felt they received meaningful recognition for work well done | 74% | 67% |
| Felt they received useful feedback from their supervisor | 80% | 76% |
Table 1 Notes
|
||
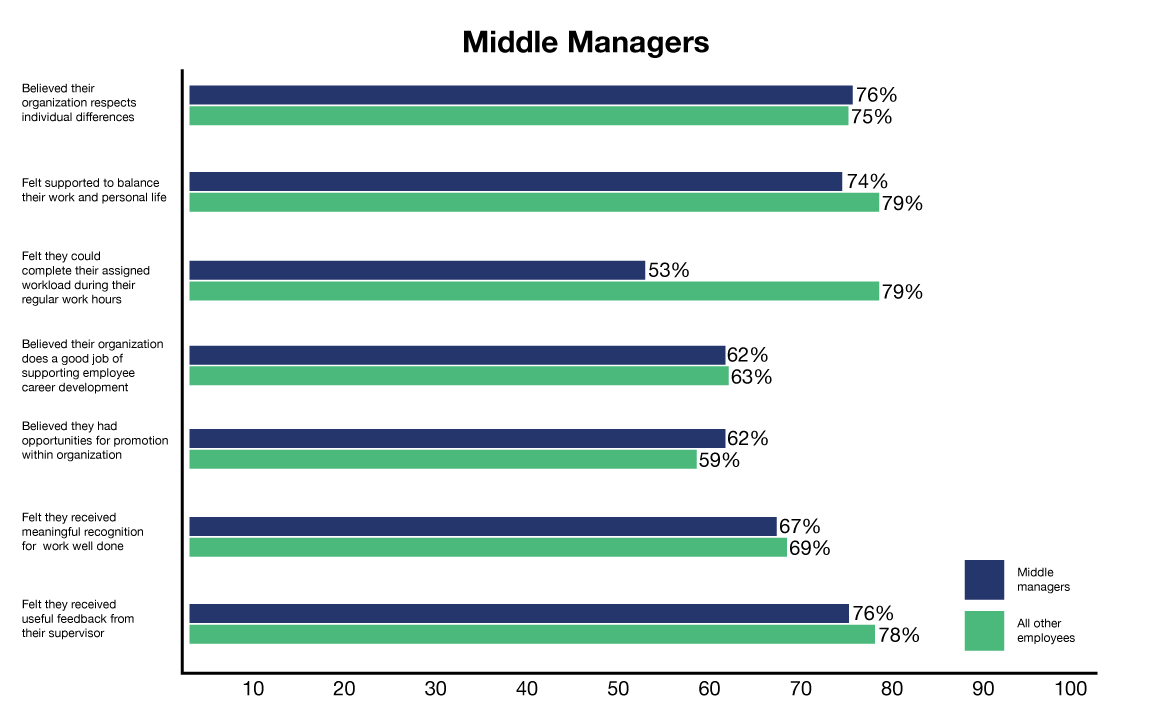
Figure 4 - Text version
| Question | Result for middle managerstable 1 note * | Result for all other employees |
|---|---|---|
| Believed their organization respects individual differences | 76% | 75% |
| Felt supported to balance their work and personal life | 74% | 79% |
| Felt they could complete their assigned workload during their regular work hours | 53% | 79% |
| Believed their organization does a good job of supporting employee career development | 62% | 63% |
| Believed they had opportunities for promotion within organization | 62% | 59% |
| Felt they received meaningful recognition for work well done | 67% | 69% |
| Felt they received useful feedback from their supervisor | 76% | 78% |
Table 1 Notes
|
||

Figure 5 - Text version
| Question | Result for executive women | Result for all other employees |
|---|---|---|
| Believed their organization respects individual differences | 81% | 76% |
| Felt supported to balance their work and personal life | 67% | 79% |
| Felt they could complete their assigned workload during their regular work hours | 24% | 74% |
| Believed their organization does a good job of supporting employee career development | 72% | 64% |
| Believed they had opportunities for promotion within organization | 70% | 61% |
| Felt they received meaningful recognition for work well done | 74% | 70% |
| Felt they received useful feedback from their supervisor | 79% | 79% |
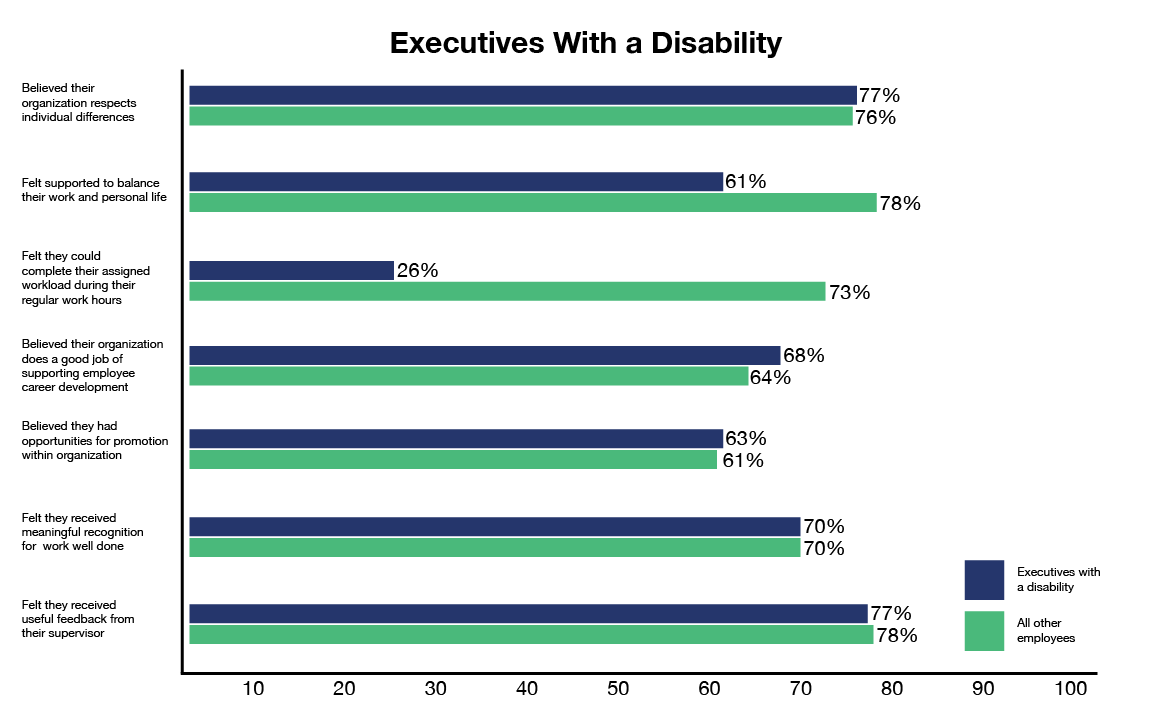
Figure 6 - Text version
| Question | Result for executives with a disability | Result for all other employees |
|---|---|---|
| Believed their organization respects individual differences | 77% | 76% |
| Felt supported to balance their work and personal life | 61% | 78% |
| Felt they could complete their assigned workload during their regular work hours | 26% | 73% |
| Believed their organization does a good job of supporting employee career development | 68% | 64% |
| Believed they had opportunities for promotion within organization | 63% | 61% |
| Felt they received meaningful recognition for work well done | 70% | 70% |
| Felt they received useful feedback from their supervisor | 77% | 78% |

Figure 7 - Text version
| Question | Result for racialized executives | Result for all other employees |
|---|---|---|
| Believed their organization respects individual differences | 77% | 77% |
| Felt supported to balance their work and personal life | 69% | 79% |
| Felt they could complete their assigned workload during their regular work hours | 28% | 73% |
| Believed their organization does a good job of supporting employee career development | 68% | 65% |
| Believed they had opportunities for promotion within organization | 67% | 61% |
| Felt they received meaningful recognition for work well done | 74% | 70% |
| Felt they received useful feedback from their supervisor | 82% | 79% |
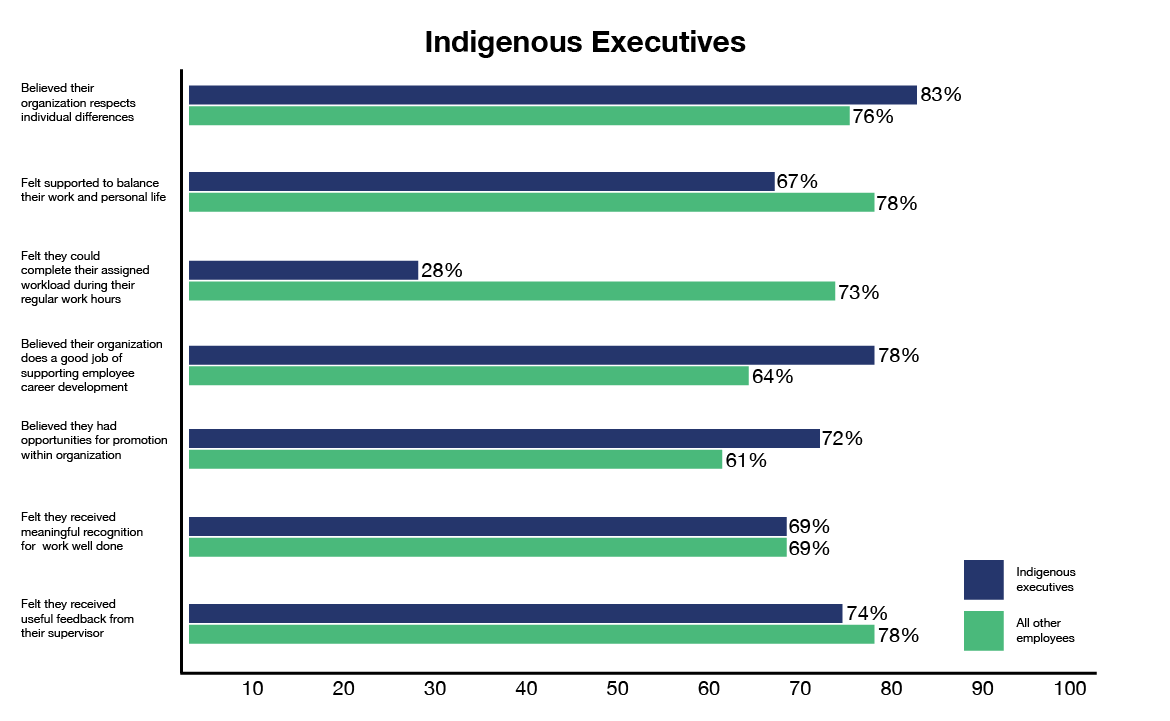
Figure 8 - Text version
| Question | Result for Indigenous executives | Result for all other employees |
|---|---|---|
| Believed their organization respects individual differences | 83% | 76% |
| Felt supported to balance their work and personal life | 67% | 78% |
| Felt they could complete their assigned workload during their regular work hours | 28% | 73% |
| Believed their organization does a good job of supporting employee career development | 78% | 64% |
| Believed they had opportunities for promotion within organization | 72% | 61% |
| Felt they received meaningful recognition for work well done | 69% | 69% |
| Felt they received useful feedback from their supervisor | 74% | 78% |