
Access to Information and Privacy Statistical Report for the 2017 to 2018 Fiscal Year
The Access to Information Act and the Privacy Act both came into effect on .
Paragraph 70(1)(c.1) of the Access to Information Act assigns responsibility to the President of the Treasury Board, as the designated minister, to collect statistics on an annual basis. These statistics are used to assess the performance of the Government of Canada’s access to information and privacy programs.
The Access to Information and Privacy Statistical report is an annual report of statistical information about the Government of Canada’s access to information and privacy programs.
The tables and figures in this report present data from the period of , to , provided by government institutions subject to the Acts. They also present cumulative data from , to .
The complete statistical dataset will be made available in open format on the Government of Canada’s Open Data Portal.
Each institution subject to the Access to Information Act and the Privacy Act tables an annual report in Parliament on the administration of each Act in their institution. These reports can be found on institutions’ websites.
On this page
- Access to Information Act statistics for the 2017 to 2018 fiscal year
-
Privacy Act statistics for the 2017 to 2018 fiscal year
In this section
- Requests under the Privacy Act
- Timeliness
- Disposition
- Complexity
- Extensions
- Exemptions
- Exclusions
- Consultations
- Costs
- Disclosures under subsection 8(2) of the Privacy Act
- Requests for correction of personal information and notations
- Privacy impact assessments
- Personal information banks
- Privacy Act requests since 1983

Access to Information Act statistics for the 2017 to 2018 fiscal year
Requests under the Access to Information Act
106,255 requests were received in the 2017 to 2018 fiscal year, an increase of 15.6% from the 2016 to 2017 fiscal year.
Of the 125,329 requests that were either received in the 2017 to 2018 fiscal year or outstanding from the previous fiscal year, 78% were closed. This is a decrease from the 2016 to 2017 fiscal year: of the 105,973 requests received in the 2016 to 2017 fiscal year or outstanding from the previous fiscal year, 82% were closed.
10 government institutions received 85.5% of all new requests in the 2017 to 2018 fiscal year.
| Requests under the Access to Information Act | Number of requests |
|---|---|
| Outstanding from 2016 to 2017 reporting periodtable 1 note 1 | 19,074 |
| Received during 2017 to 2018 reporting period | 106,255 |
| Total | 125,329 |
| Closed during 2017 to 2018 reporting period | 97,705 |
| Carried over to 2018 to 2019 reporting period | 27,624 |
Table 1 Notes
|
|
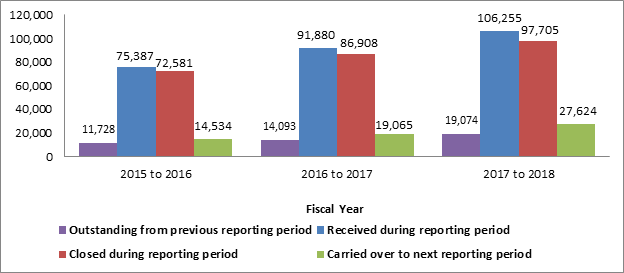
Figure 1 - Text version
This table compares the number of requests under the Access to Information Act received, closed and carried forward from the 2015 to 2016 reporting period to the 2016 to 2017 reporting period, and from the 2016 to 2017 reporting period to the 2017 to 2018 reporting period.
| Requests under the Access to Information Act | 2015 to 2016 | 2016 to 2017 | 2017 to 2018 |
|---|---|---|---|
| Outstanding from previous reporting period | 11,728 | 14,093 | 19,074 |
| Received during reporting period | 75,387 | 91,880 | 106,255 |
| Closed during reporting period | 72,581 | 86,908 | 97,705 |
| Carried over to next reporting period | 14,534 | 19,065 | 27,624 |
| Rank | Name of institution | Number of requests received | Requests received as percentage | Number of pages processedtable 2 note 1 |
|---|---|---|---|---|
| 1 | Immigration Refugees and Citizenship Canada | 64,234 | 60.5 | 3,713,374 |
| 2 | Canada Border Services Agency | 7,466 | 7.0 | 15,688,670table 2 note 2 |
| 3 | Royal Canadian Mounted Police | 5,203 | 4.9 | 358,854 |
| 4 | Canada Revenue Agency | 2,750 | 2.6 | 1,641,339 |
| 5 | National Defence | 2,055 | 1.9 | 170,771 |
| 6 | Environment and Climate Change Canada | 1,999 | 1.9 | 110,138 |
| 7 | Employment and Social Development Canada | 1,942 | 1.8 | 970,992 |
| 8 | Health Canada | 1,806 | 1.7 | 374,021 |
| 9 | Innovation Science and Economic Development Canada | 1,700 | 1.6 | 236,699 |
| 10 | Global Affairs Canada | 1,680 | 1.6 | 141,778 |
| Other institutions | 15,420 | 14.5 | 4,129,700 | |
| Total | 106,255 | 100.0 | 27,536,336 | |
Table 2 Notes
|
||||
| Source | Number of requests | Percentage of requests |
|---|---|---|
| Business (private sector) | 48,806 | 45.9 |
| Public | 34,641 | 32.6 |
| Media | 7,808 | 7.3 |
| Organizationtable 3 note 1 | 5,059 | 4.8 |
| Academia | 3,657 | 3.4 |
| Decline to identifytable 3 note 2 | 6,284 | 5.9 |
| Total | 106,255 | 100.0 |
Table 3 Notes
|
||
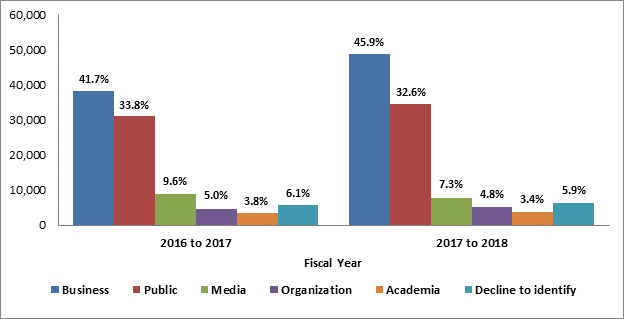
Figure 2 - Text version
This table compares requester types (the sources of requests) from the 2016 to 2017 reporting period with those for the 2017 to 2018 reporting period.
| Source | 2016 to 2017 | 2017 to 2018 |
|---|---|---|
| Business | 38,319 | 48,806 |
| Public | 31,030 | 34,641 |
| Media | 8,838 | 7,808 |
| Organization | 4,631 | 5,059 |
| Academia | 3,452 | 3,657 |
| Decline to identify | 5,610 | 6,284 |
Timeliness
76.2% of requests were closed within established timelines (that is, closed within the statutory deadline of 30 days or within an extension period provided for in the Act). The comparable figure in the 2016 to 2017 fiscal year was 80.7%.
Of 97,705 requests closed in the 2017 to 2018 fiscal year, 54,143, or 55.4%, were closed within the initial statutory deadline of 30 days.
| Status of closed requests | Requests as percentage | Number of requests | ||
|---|---|---|---|---|
| 2016 to 2017 | 2017 to 2018 | 2016 to 2017 | 2017 to 2018 | |
| Closed within statutory deadline, including extensions | 80.7 | 76.2 | 70,128 | 74,453 |
| Closed beyond statutory deadline, including extensions | 19.3 | 23.8 | 16,780 | 23,252 |
| Total | 100.0 | 100.0 | 86,908 | 97,705 |
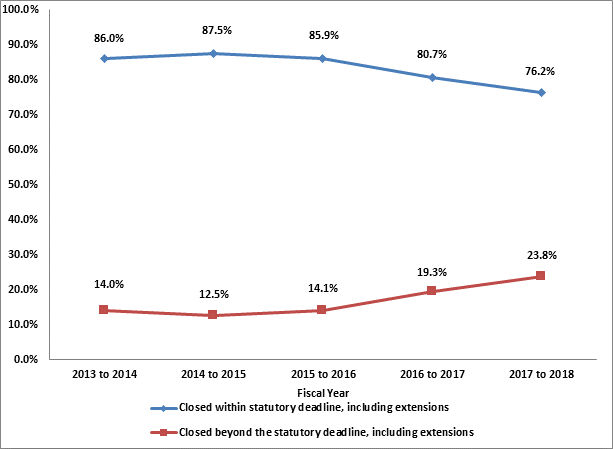
Figure 3 - Text version
This table compares the status of requests closed in the last 5 years, from 2013 to 2014 fiscal year to 2017 to 2018 fiscal year.
| Status of closed request | 2013 to 2014 | 2014 to 2015 | 2015 to 2016 | 2016 to 2017 | 2017 to 2018 |
|---|---|---|---|---|---|
| Closed within statutory deadline, including extensions | 86.0% | 87.5% | 85.9% | 80.7% | 76.2% |
| Closed beyond statutory deadline, including extensions | 14.0% | 12.5% | 14.1% | 19.3% | 23.8% |
| Disposition of requests (including requests for which extensions were required) | Closure timetable 5 note 1 | ||||||
|---|---|---|---|---|---|---|---|
| 0 to 30 days | 31 to 60 days | 61 to 120 days | 121 to 180 days | 181 to 365 days | More than 365 days | Total | |
| All disclosed | 14,963 | 6,436 | 1,787 | 478 | 456 | 313 | 24,433 |
| Disclosed in part | 27,077 | 14,245 | 8,118 | 2,611 | 2,382 | 2,019 | 56,452 |
| All exempted | 316 | 105 | 120 | 54 | 64 | 9 | 668 |
| All excluded | 186 | 53 | 72 | 21 | 10 | 6 | 348 |
| No records exist | 5,412 | 894 | 441 | 143 | 138 | 61 | 7,089 |
| Request transferred | 718 | 11 | 4 | 1 | 0 | 0 | 734 |
| Request abandonedtable 5 note 2 | 5,235 | 340 | 258 | 144 | 422 | 1,306 | 7,705 |
| Neither confirmed nor deniedtable 5 note 3 | 236 | 19 | 10 | 5 | 2 | 4 | 276 |
| Total number of requests | 54,143 | 22,103 | 10,810 | 3,457 | 3,474 | 3,718 | 97,705 |
| Total as percentage | 55.4 | 22.6 | 11.1 | 3.5 | 3.6 | 3.8 | 100.0 |
Table 5 Notes
|
|||||||
| Closure time | Requests as percentage | Number of requests | ||
|---|---|---|---|---|
| 2016 to 2017 | 2017 to 2018 | 2016 to 2017 | 2017 to 2018 | |
| 0 to 30 days | 64.5 | 55.4 | 56,084 | 54,143 |
| 31 to 60 days | 18.0 | 22.6 | 15,616 | 22,103 |
| 61 to 120 days | 9.5 | 11.1 | 8,248 | 10,810 |
| 121 to 180 days | 2.7 | 3.5 | 2,359 | 3,457 |
| 181 to 365 days | 2.6 | 3.6 | 2,275 | 3,474 |
| More than 365 days | 2.7 | 3.8 | 2,326 | 3,718 |
| Total | 100.0 | 100.0 | 86,908 | 97,705 |
|
Note: The Access to Information Act provides for the extension of the time limit to respond to a request beyond 30 days if:
|
||||
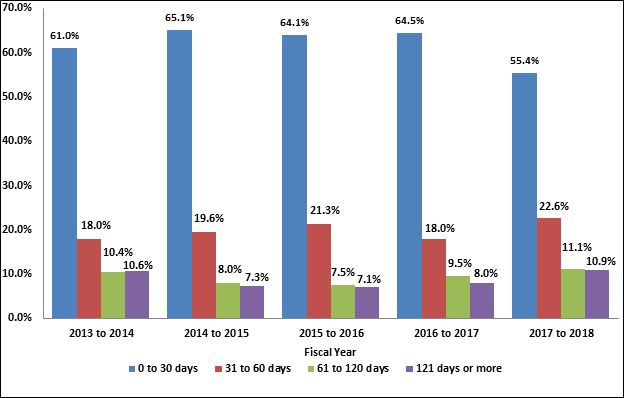
Figure 4 - Text version
This table compares the time required to close requests, listed according to time periods, for the last 5 years, from 2013 to 2014 fiscal year to 2017 to 2018 fiscal year.
| Closure time | 2013 to 2014 | 2014 to 2015 | 2015 to 2016 | 2016 to 2017 | 2017 to 2018 |
|---|---|---|---|---|---|
| 0 to 30 days | 61.0% | 65.1% | 64.1% | 64.5% | 55.4% |
| 31 to 60 days | 18.0% | 19.6% | 21.3% | 18.0% | 22.6% |
| 61 to 120 days | 10.4% | 8.0% | 7.5% | 9.5% | 11.1% |
| 121 days or more | 10.6% | 7.3% | 7.1% | 8.0% | 10.9% |
Note: Before the 2011 to 2012 reporting period, only 4 time periods for closing requests were recorded. The data for the 2011 to 2012 reporting period onwards has therefore been consolidated for time periods of more than 121 days. The data for the 2013 to 2014 reporting period for 121 days or more indicated in previous years 10.7%, this was an administrative error. The correct amount is 10.6%.
| Principal reason | Total number of requests closed beyond the statutory deadline including extensions (deemed refusal) |
|---|---|
| Workload | 21,273 |
| External consultation | 463 |
| Internal consultation | 365 |
| Othertable 7 note 1 | 1,151 |
| Total | 23,252 |
Table 7 Notes
Note: The information in this table reflects requests that were neither closed in the initial 30 days nor closed within the timeframe covered by an extension. These requests are referred to as “deemed refusals.” |
|
| Number of days past deadline | Number of requests past deadline where no extension was taken | Number of requests past deadline where an extension was taken | Total requests closed beyond the statutory deadline including extensions | Total as percentage |
|---|---|---|---|---|
| 1 to 30 days | 9,658 | 1,115 | 10,773 | 46.3 |
| 31 to 60 days | 2,189 | 489 | 2,678 | 11.5 |
| 61 to 120 days | 2,271 | 568 | 2,839 | 12.2 |
| 121 to 180 days | 1,293 | 365 | 1,658 | 7.1 |
| 181 to 365 days | 1,534 | 611 | 2,145 | 9.2 |
| More than 365 days | 2,195 | 964 | 3,159 | 13.6 |
| Total | 19,140 | 4,112 | 23,252 | 100.0 |
Disposition
Records were disclosed either in full or in part for 83% of closed requests. This is an increase compared with the previous period.
| Disposition of closed requests | Requests as percentage | Number of requests | ||
|---|---|---|---|---|
| 2016 to 2017 | 2017 to 2018 | 2016 to 2017 | 2017 to 2018 | |
| All disclosed | 19.8 | 25.0 | 17,176 | 24,433 |
| Disclosed in part | 61.2 | 57.8 | 53,170 | 56,452 |
| All exempted | 1.0 | 0.7 | 870 | 668 |
| All excluded | 0.5 | 0.4 | 403 | 348 |
| No records exist | 7.5 | 7.3 | 6,483 | 7,089 |
| Request transferred | 0.7 | 0.8 | 646 | 734 |
| Request abandoned | 9.1 | 7.9 | 7,886 | 7,705 |
| Neither confirmed nor denied | 0.3 | 0.3 | 274 | 276 |
| Total | 100.0 | 100.0 | 86,908 | 97,705 |
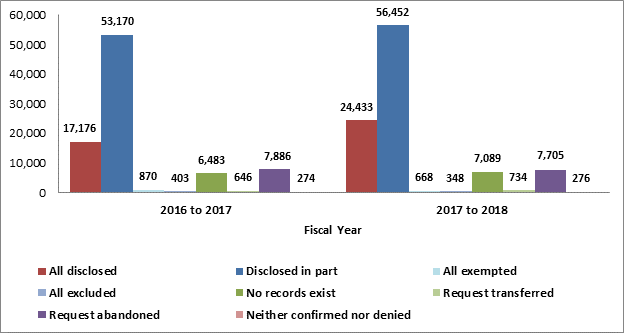
Figure 5 - Text version
This table compares the disposition of closed requests from the 2016 to 2017 reporting period with the disposition of those for the 2017 to 2018 reporting period.
| Disposition of closed requests | 2016 to 2017 | 2017 to 2018 |
|---|---|---|
| All disclosed | 17,176 | 24,433 |
| Disclosed in part | 53,170 | 56,452 |
| All exempted | 870 | 668 |
| All excluded | 403 | 348 |
| No records exist | 6,483 | 7,089 |
| Request transferred | 646 | 734 |
| Request abandoned | 7,886 | 7,705 |
| Neither confirmed nor denied | 274 | 276 |
Complexity
In the 2017 to 2018 fiscal year, government institutions processed about 27.5 million pages for closed requests, an increase of about 11.5 million pages over the 2016 to 2017 fiscal year; 87.7% of pages were disclosed either in full or in part. The significant increase in number of pages processed was largely due to a single request involving approximately 14.8 million pages.
Government institutions undertook outside consultations in 8.1% of all closed requests.
| Disposition of requests | Number of pages processed | Number of pages disclosed | Number of requeststable 10 note 1 | |||
|---|---|---|---|---|---|---|
| 2016 to 2017 | 2017 to 2018 | 2016 to 2017 | 2017 to 2018 | 2016 to 2017 | 2017 to 2018 | |
| All disclosed | 3,165,256 | 17,088,864 | 3,116,170 | 17,005,921 | 17,176 | 24,433 |
| Disclosed in part | 10,200,570 | 9,201,216 | 6,832,982 | 7,010,977 | 53,170 | 56,452 |
| All exempted | 389,436 | 295,304 | 0 | 0 | 870 | 668 |
| All excludetable 10 note 2 | 16,497 | 37,052 | 0 | 0 | 403 | 348 |
| Request abandonedb | 2,275,487 | 912,900 | 51,976 | 126,599 | 7,886 | 7,705 |
| Total | 16,047,246 | 27,536,336table 10 note 3 | 10,001,128 | 24,143,497 | 79,505 | 89,606 |
Table 10 Notes
|
||||||
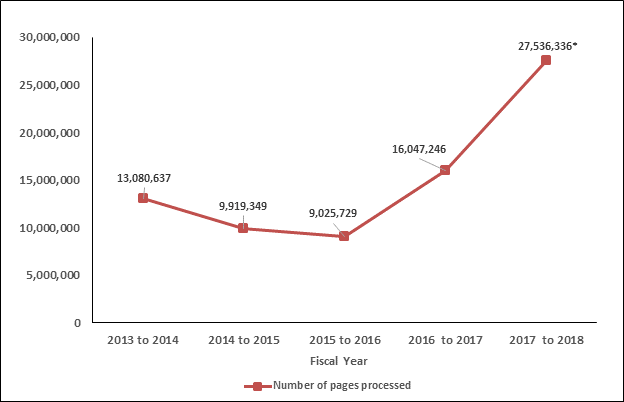
Figure 6 - Text version
This table identifies the number of pages processed over 5 years, from 2013 to 2014 fiscal year to 2017 to 2018 fiscal year.
| 2013 to 2014 | 2014 to 2015 | 2015 to 2016 | 2016 to 2017 | 2017 to 2018 | |
|---|---|---|---|---|---|
| Total number of pages processed | 13,080,637 | 9,919,349 | 9,025,729 | 16,047,246 | 27,536,336 |
Note: The number of pages processed rose significantly compared to the 2016 to 2017 fiscal year due to 1 request of approximately 14.8 million pages.
| Disposition | Consultation required | Assessment of fees | Legal advice sought | Othertable 11 note 1 | Total |
|---|---|---|---|---|---|
| All disclosed | 843 | 15 | 11 | 472 | 1,341 |
| Disclosed in part | 6,603 | 21 | 332 | 1,155 | 8,111 |
| All exempted | 160 | 0 | 22 | 32 | 214 |
| All excluded | 116 | 0 | 19 | 18 | 153 |
| Request abandoned | 234 | 12 | 19 | 185 | 450 |
| Neither confirmed nor denied | 1 | 0 | 1 | 7 | 9 |
| Total | 7,957 | 48 | 404 | 1,869 | 10,278 |
Table 11 Notes
|
|||||
Extensions
42.3% of all extensions taken for closed requests cited paragraph 9(1)(a) of the Access to Information Act as a reason for the extension, relating to interference with government operations. 21.4% of all extensions taken for closed requests were for 30 days or less, and 90.4% were for 120 days or less.
| Length of extensionstable 12 note 1 | 9(1)(a) - Interference with operations | 9(1)(b) - Consultation | 9(1)(c) - Third-party notice | Total | |
|---|---|---|---|---|---|
| Section 69table 12 note 2 | Othertable 12 note 3 | ||||
| 30 days or less | 2,211 | 137 | 1,244 | 161 | 3,753 |
| 31 to 60 days | 1,946 | 185 | 3,410 | 1,504 | 7,045 |
| 61 to 120 days | 2,225 | 604 | 1,936 | 274 | 5,039 |
| 121 to 180 days | 487 | 65 | 298 | 66 | 916 |
| 181 to 365 days | 426 | 27 | 123 | 50 | 626 |
| 365 days or more | 117 | 0 | 28 | 1 | 146 |
| Total | 7,412 | 1,018 | 7,039 | 2,054 | 17,523 |
Table 12 Notes
|
|||||
ExemptionsFootnote 1
The tables that follow indicate exemptions applied under the Access to Information Act to requests closed during the reporting period.
| Provision | Number of requests |
|---|---|
| 13(1)(a) | 4,509 |
| 13(1)(b) | 357 |
| 13(1)(c) | 823 |
| 13(1)(d) | 497 |
| 13(1)(e) | 19 |
| Provision | Number of requests |
|---|---|
| 14 | 604 |
| 14(a) | 467 |
| 14(b) | 168 |
| Provision | Number of requests |
|---|---|
| 15(1) | 1,060 |
| 15(1) International Affairs | 11,416 |
| 15(1) Defence | 1,605 |
| 15(1) Subversive activities | 2,656 |
| Provision | Number of requests |
|---|---|
| 16(1)(a)(i) | 502 |
| 16(1)(a)(ii) | 277 |
| 16(1)(a)(iii) | 372 |
| 16(1)(b) | 689 |
| 16(1)(c) | 20,138 |
| 16(1)(d) | 53 |
| 16(2) | 1,482 |
| 16(2)(a) | 28 |
| 16(2)(b) | 99 |
| 16(2)(c) | 2,754 |
| 16(3) | 0 |
| 16.1(1)(a) | 6 |
| 16.1(1)(b) | 18 |
| 16.1(1)(c) | 32 |
| 16.1(1)(d) | 62 |
| 16.2(1) | 14 |
| 16.3 | 16 |
| 16.4(1)(a) | 1 |
| 16.4(1)(b) | 0 |
| 16.5 | 13 |
| Provision | Number of requests |
|---|---|
| 17 | 691 |
| Provision | Number of requests |
|---|---|
| 18(a) | 275 |
| 18(b) | 413 |
| 18(c) | 25 |
| 18(d) | 313 |
| 18.1(1)(a) | 52 |
| 18.1(1)(b) | 32 |
| 18.1(1)(c) | 4 |
| 18.1(1)(d) | 57 |
| Provision | Number of requests |
|---|---|
| 19(1) | 38,145 |
| Provision | Number of requests |
|---|---|
| 20(1)(a) | 142 |
| 20(1)(b) | 2,850 |
| 20(1)(b.1) | 44 |
| 20(1)(c) | 2,224 |
| 20(1)(d) | 541 |
| 20.1 | 3 |
| 20.2 | 0 |
| 20.4 | 0 |
| Provision | Number of requests |
|---|---|
| 21(1)(a) | 4,680 |
| 21(1)(b) | 5,195 |
| 21(1)(c) | 927 |
| 21(1)(d) | 427 |
| Provision | Number of requests |
|---|---|
| 22 | 308 |
| 22.1(1) | 66 |
| Provision | Number of requests |
|---|---|
| 23 | 2,354 |
| Provision | Number of requests |
|---|---|
| 24(1) | 2,155 |
| Provision | Number of requests |
|---|---|
| 26 | 203 |
ExclusionsFootnote 2
The tables that follow indicate exclusions applied under the Access to Information Act to requests closed during the reporting period.
| Provision | Number of requests |
|---|---|
| 68(a) | 501 |
| 68(b) | 6 |
| 68(c) | 11 |
| 68.1 | 67 |
| 68.2(a) | 8 |
| 68.2(b) | 0 |
| Provision | Number of requests |
|---|---|
| 69(1) | 114 |
| 69(1)(a) | 234 |
| 69(1)(b) | 13 |
| 69(1)(c) | 52 |
| 69(1)(d) | 176 |
| 69(1)(e) | 435 |
| 69(1)(f) | 42 |
| 69(1)(g) re (a) | 1,167 |
| 69(1)(g) re (b) | 23 |
| 69(1)(g) re (c) | 588 |
| 69(1)(g) re (d) | 415 |
| 69(1)(g) re (e) | 724 |
| 69(1)(g) re (f) | 296 |
| Provision | Number of requests |
|---|---|
| 69.1(1) | 37 |
Consultations
The number of consultations between federal government institutions in the 2017 to 2018 fiscal year increased by 13% from the 2016 to 2017 fiscal year. However, the number of pages to review remained relatively consistent, decreasing by 0.1%.
| Consultations | Number of consultations | Number of pages to review | ||
|---|---|---|---|---|
| 2016 to 2017 | 2017 to 2018 | 2016 to 2017 | 2017 to 2018 | |
| Received during reporting period | 8,532 | 9,338 | 533,526 | 493,913 |
| Outstanding from the previous reporting period | 564 | 949 | 117,101 | 156,002 |
| Total | 9,096 | 10,287 | 650,627 | 649,915 |
| Closed during the reporting period | 8,101 | 8,880 | 409,929 | 433,559 |
| Pending at the end of the reporting period | 685 | 1,407 | 111,736 | 216,356 |
| Recommendation | Number of days required to close consultation requests | ||||||
|---|---|---|---|---|---|---|---|
| 1 to 30 days | 31 to 60 days | 61 to 120 days | 121 to 180 days | 181 to 365 days | More than 365 days | Total | |
| Disclose entirely | 3,738 | 800 | 233 | 49 | 55 | 17 | 4,892 |
| Disclose in part | 1,599 | 910 | 494 | 126 | 111 | 29 | 3,269 |
| Exempt entirely | 106 | 27 | 22 | 6 | 3 | 1 | 165 |
| Exclude entirely | 18 | 3 | 0 | 0 | 0 | 0 | 21 |
| Consult other institutiontable 15b note 1 | 108 | 32 | 13 | 6 | 1 | 2 | 162 |
| Other | 245 | 53 | 35 | 10 | 14 | 14 | 371 |
| Total | 5,814 | 1,825 | 797 | 197 | 184 | 63 | 8,880 |
Table 15b Notes
|
|||||||
Fees and costs
The annual cost to administer the Government of Canada’s access to information program increased by 7.8% to $69.8 million in the 2017 to 2018 fiscal year, with the average cost per closed request declining by 4.1% to about $714 per request.
Fees waived or refunded decreased to $48,747. This decrease reflects that on , the President of the Treasury Board issued the Interim Directive on the Administration of the Access to Information Act, directing government institutions to waive all fees apart from the initial $5 application fee.
| Description | Amount | |
|---|---|---|
| 2016 to 2017 | 2017 to 2018 | |
| Cost of operationstable 16 note 1 | $64,771,471.00 | $69,810,554.00 |
| Requests closed | 86,908 | 97,705 |
| Average cost per closed requesttable 16 note 2 | $745.29 | $714.50 |
| Pages processed | 16,047,246 | 27,536,336 |
| Average cost per processed page | $4.04 | $2.54 |
| Number of requests in which fees were collected | 82,941 | 94,775 |
| Fees collected | $442,956.00 | $476,710.00 |
| Average fees collected per request | $5.34 | $5.03 |
| Number of requests in which fees were waived or refunded | 5,597 | 7,184 |
| Fees waived or refunded | $229,955.00 | $48,747.00 |
| Average fees waived per request | $41.09 | $6.79 |
Table 16 Notes
|
||
Informal requests for government information
An informal request is a request for information made to a government institution subject to the Access to Information Act that is either not made or not processed under the Act.
Informal requests include:
- formal requests that were discontinued in favour of providing information informally, in consultation with the requester
- advising requesters when information is already publicly available online
- the re-release of information made available through previously closed formal requests, summaries of which are found online.
Informal requests do not include:
- responses to parliamentary questions or media enquiries
- requests made internally within a government institution to share information between sectors
Unlike in the case of formal requests:
- fees cannot be charged under the Act for informal requests
- there are no deadlines for responding to informal requests
- requesters have no statutory right of complaint to the Information Commissioner
In the 2017 to 2018 fiscal year, 63.1% of informal requests were closed within 30 days, compared with 61.2% in the 2016 to 2017 fiscal year.
| Closure time | |||||||
|---|---|---|---|---|---|---|---|
| 0 to 30 days | 31 to 60 days | 61 to 120 days | 121 to 180 days | 181 to 365 days | More than 365 days | Total | |
| Number of requests | 11,415 | 2,051 | 1,135 | 501 | 2,589 | 411 | 18,102 |
Access to Information Act requests since 1983
The statistics that follow reflect the best available data since 1983. The categories have been adjusted in some cases in order to compare data across the years.
| Requests under the Access to Information Act | Number of requests |
|---|---|
| Requests received | 979,531 |
| Requests closed | 946,856 |
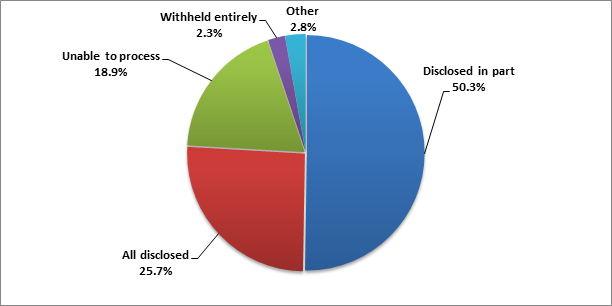
Figure 7 - Text version
This table identifies the disposition of closed requests since 1983.
| Disposition of closed requests | Requests as percentage |
|---|---|
| All disclosed | 25.7% |
| Disclosed in part | 50.3% |
| Unable to process | 18.9% |
| Withheld entirely | 2.3% |
| Other | 2.8% |
In the preceding figure:
- “Unable to process” includes the categories “no records exist,”Footnote 3 “abandoned”Footnote 4 and “requests that could not be processed.”Footnote 5
- “Withheld entirely” includes the categories “all exempted” and “all excluded.”
- “Other” includes the categories “transferred,” “neither confirmed nor denied” and “treated informally.”
| Disposition of closed requests | Requests as percentage | Number of requests |
|---|---|---|
| Disclosed in part | 50.3 | 475,838 |
| All disclosed | 25.7 | 243,025 |
| All exempted | 1.7 | 16,385 |
| All excluded | 0.6 | 5,623 |
| No records exist | 4.6 | 43,580 |
| Abandoned | 4.3 | 41,133 |
| Transferred | 1.2 | 11,253 |
| Neither confirmed nor denied | 0.1 | 1256 |
| Treated informally | 1.5 | 14,057 |
| Requests that could not be processed | 10.0 | 94,706 |
| Total | 100.0 | 946,856 |
| Closure time (including requests for which extensions were required) | Requests as percentage | Number of requests |
|---|---|---|
| 0 to 30 days | 60.2 | 570,356 |
| 31 to 60 days | 19.0 | 179,965 |
| 61 days or more | 20.8 | 196,535 |
| Total | 100.0 | 946,856 |
| Descriptions | Amount |
|---|---|
| Requests closed | 946,856 |
| Cost of operationstable 21 note 1 | $936,745,424.70 |
| Average cost per closed requesttable 21 note 2 | $989.32 |
| Fees collected | $7,790,451.02 |
| Average fees collected per closed requesttable 21 note 3 | $8.23 |
| Fees waived | $3,651,146.94 |
| Average fees waived per closed requesttable 21 note 4 | $3.86 |
Table 21 Notes
|
|
Privacy Act statistics for the 2017 to 2018 fiscal year
Requests under the Privacy Act
67,967 requests were received in the 2017 to 2018 fiscal year, a decrease of 3.6% from the 2016 to 2017 fiscal year.
Of the 89,171 requests that were either received in the 2017 to 2018 fiscal year or outstanding from the previous period, 69.1% were closed. This is a decrease from the 2016 to 2017 fiscal year: of the 86,916 requests received in the 2016 to 2017 fiscal year or outstanding from the previous period, 75.6% were closed.
10 government institutions received 93.1% of all new requests in the 2017 to 2018 fiscal year.
| Requests under the Privacy Act | Number of requests |
|---|---|
| Outstanding from 2016 to 2017 reporting periodtable 22 note 1 | 21,204 |
| Received during 2017 to 2018 reporting period | 67,967 |
| Total | 89,171 |
| Closed during 2017 to 2018 reporting period | 61,574 |
| Carried over to 2018 to 2019 reporting period | 27,597 |
Table 22 Notes
|
|
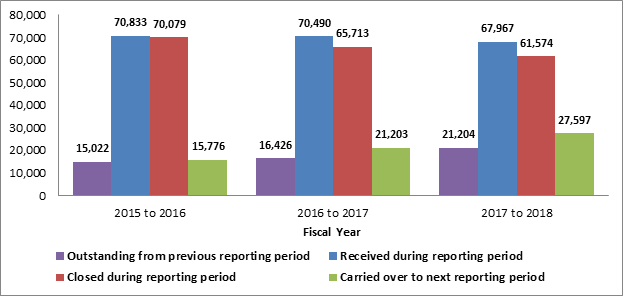
Figure 8 - Text version
This table shows the number of requests under the Privacy Act received, closed and carried forward from the 2015 to 2016 fiscal year to the 2016 to 2017 fiscal year, and from the 2016 to 2017 fiscal year to the 2017 to 2018 fiscal year.
| Requests under the Privacy Act | 2015 to 2016 | 2016 to 2017 | 2017 to 2018 |
|---|---|---|---|
| Outstanding from previous reporting period | 15,022 | 16,426 | 21,204 |
| Requests received during reporting period | 70,833 | 70,490 | 67,967 |
| Closed during reporting period | 70,079 | 65,713 | 61,574 |
| Carried over to next reporting period | 15,776 | 21,203 | 27,597 |
| Rank | Name of institution | Number of requests received | Requests received as percentage | Pages processedtable 23 note 1 |
|---|---|---|---|---|
| 1 | Canada Border Services Agency | 13,429 | 19.8 | 684,231 |
| 2 | Immigration Refugees and Citizenship Canada | 13,368 | 19.7 | 873,279 |
| 3 | Employment and Social Development Canada | 8,852 | 13.0 | 798,436 |
| 4 | National Defence | 7,393 | 10.9 | 1,323,272 |
| 5 | Correctional Service of Canada | 6,211 | 9.1 | 505,801 |
| 6 | Royal Canadian Mounted Police | 4,996 | 7.4 | 523,160 |
| 7 | Canada Revenue Agency | 3,791 | 5.6 | 920,251 |
| 8 | Immigration and Refugee Board | 3,417 | 5.0 | 192,835 |
| 9 | Veterans Affairs Canada | 946 | 1.4 | 374,467 |
| 10 | Canadian Security Intelligence Service | 844 | 1.2 | 22,672 |
| Other institutions | 4,720 | 6.9 | 2,905,470 | |
| Total | 67,967 | 100.0 | 9,123,874 | |
Table 23 Notes
|
||||
Timeliness
74.7% of requests closed in the 2017 to 2018 fiscal year were closed within established timelines (that is, closed within the statutory deadline of 30 days or within an extension period provided for in the Act). The comparable figure for the 2016 to 2017 fiscal year was 80.4%.
Of 61,574 requests closed in the 2017 to 2018 fiscal year, 39,073 requests, or 63.5%, were closed within the initial statutory deadline of 30 days.
| Status of closed requests | Requests as percentage | Number of requests | ||
|---|---|---|---|---|
| 2016 to 2017 | 2017 to 2018 | 2016 to 2017 | 2017 to 2018 | |
| Closed within statutory deadline, including extensions | 80.4 | 74.7 | 52,824 | 46,011 |
| Closed beyond statutory deadline, including extensions | 19.6 | 25.3 | 12,889 | 15,563 |
| Total | 100.0 | 100.0 | 65,713 | 61,574 |
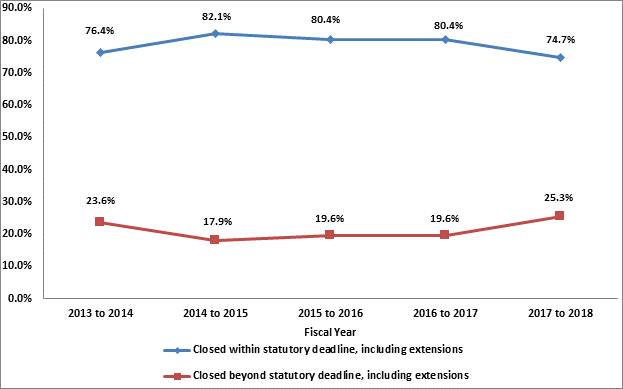
Figure 9 - Text version
This table compares the status of requests closed in the last 5 years, from 2013 to 2014 fiscal year to 2017 to 2018 fiscal year.
| Status of closed request | 2013 to 2014 | 2014 to 2015 | 2015 to 2016 | 2016 to 2017 | 2017 to 2018 |
|---|---|---|---|---|---|
| Closed within statutory deadline, including extensions | 76.4% | 82.1% | 80.4% | 80.4% | 74.7% |
| Closed beyond statutory deadline, including extensions | 23.6% | 17.9% | 19.6% | 19.6% | 25.3% |
| Disposition of requests (including requests for which extensions were required) | Closure timetable 25 note 1 | ||||||
|---|---|---|---|---|---|---|---|
| 0 to 30 days | 31 to 60 days | 61 to 120 days | 121 to 180 days | 181 to 365 days | More than 365 days | Total | |
| All disclosed | 12,626 | 3,854 | 696 | 486 | 524 | 508 | 18,694 |
| Disclosed in part | 14,759 | 5,678 | 2,028 | 1,010 | 1,469 | 2,013 | 26,957 |
| All exempted | 166 | 41 | 26 | 10 | 8 | 19 | 270 |
| All excluded | 3 | 0 | 0 | 1 | 3 | 0 | 7 |
| No records exist | 6,939 | 530 | 303 | 111 | 135 | 75 | 8,093 |
| Request abandonedtable 25 note 2 | 4,202 | 295 | 155 | 84 | 260 | 2,156 | 7,152 |
| Neither confirmed nor deniedtable 25 note 3 | 378 | 6 | 4 | 0 | 0 | 13 | 401 |
| Total | 39,073 | 10,404 | 3,212 | 1,702 | 2,399 | 4,784 | 61,574 |
| Total percentage | 63.5 | 16.9 | 5.2 | 2.8 | 3.8 | 7.8 | 100.0 |
Table 25 Notes
|
|||||||
| Closure time | Requests as percentage | Number of requests | ||
|---|---|---|---|---|
| 2016 to 2017 | 2017 to 2018 | 2016 to 2017 | 2017 to 2018 | |
| 0 to 30 days | 72.3 | 63.5 | 47,524 | 39,073 |
| 31 to 60 days | 13.7 | 16.9 | 9,006 | 10,404 |
| 61 to 120 days | 4.8 | 5.2 | 3,129 | 3,212 |
| 121 to 180 days | 3.0 | 2.8 | 1,992 | 1,702 |
| 181 to 365 days | 2.7 | 3.8 | 1,755 | 2,399 |
| More than 365 days | 3.5 | 7.8 | 2,307 | 4,784 |
| Total | 100.0 | 100.0 | 65,713 | 61,574 |
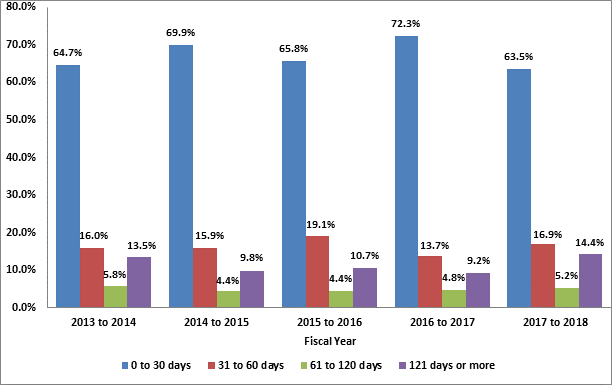
Figure 10 - Text version
This table compares the time required to close requests, listed according to time periods, for the last 5 years, from 2013 to 2014 fiscal year to 2017 to 2018 fiscal year.
| Closure time | 2013 to 2014 | 2014 to 2015 | 2015 to 2016 | 2016 to 2017 | 2017 to 2018 |
|---|---|---|---|---|---|
| 0 to 30 days | 64.7% | 69.9% | 65.8% | 72.3% | 63.5% |
| 31 to 60 days | 16.0% | 15.9% | 19.1% | 13.7% | 16.9% |
| 61 to 120 days | 5.8% | 4.4% | 4.4% | 4.8% | 5.2% |
| 121 days or more | 13.5% | 9.8% | 10.7% | 9.2% | 14.4% |
Note: Before the 2011 to 2012 reporting period, only 4 time periods for closing requests were recorded. The data for the 2011 to 2012 reporting period onwards has therefore been consolidated for time periods of more than 121 days.
| Principal reason | Total number of requests closed beyond the statutory deadline including extensions (deemed refusal) |
|---|---|
| Workload | 14,896 |
| External consultation | 69 |
| Internal consultation | 23 |
| Othertable 27 note 1 | 575 |
| Total | 15,563 |
Table 27 Notes
Note: The information in this table reflects requests that were neither closed in the initial 30 days nor closed within the timeframe covered by an extension. These requests are referred to as “deemed refusals.” |
|
| Number of days past deadline | Number of requests past deadline where no extension was taken | Number of requests past deadline where an extension was taken | Total requests closed beyond the statutory deadline including extensions | Total as percentage |
|---|---|---|---|---|
| 1 to 30 days | 3,709 | 603 | 4,312 | 27.7 |
| 31 to 60 days | 1,059 | 388 | 1,447 | 9.3 |
| 61 to 120 days | 1,395 | 515 | 1,910 | 12.3 |
| 121 to 180 days | 1,071 | 240 | 1,311 | 8.4 |
| 181 to 365 days | 1,754 | 235 | 1,989 | 12.8 |
| More than 365 days | 3,254 | 1,340 | 4,594 | 29.5 |
| Total | 12,242 | 3,321 | 15,563 | 100.0 |
Disposition
Records were disclosed either in full or in part for 74.2% of closed requests. This is a 5.8% relative increase, as compared with the previous period.
| Disposition of closed requests | Requests as percentage | Number of requests | ||
|---|---|---|---|---|
| 2016 to 2017 | 2017 to 2018 | 2016 to 2017 | 2017 to 2018 | |
| All disclosed | 25.0 | 30.4 | 16,426 | 18,694 |
| Disclosed in part | 43.4 | 43.8 | 28,524 | 26,957 |
| All exempted | 0.6 | 0.4 | 404 | 270 |
| All excluded | 0.0 | 0.0 | 6 | 7 |
| No records exist | 20.4 | 13.1 | 13,398 | 8,093 |
| Request abandoned | 10.0 | 11.6 | 6,595 | 7,152 |
| Neither confirmed nor denied | 0.5 | 0.7 | 360 | 401 |
| Total | 100.0 | 100.0 | 65,713 | 61,574 |
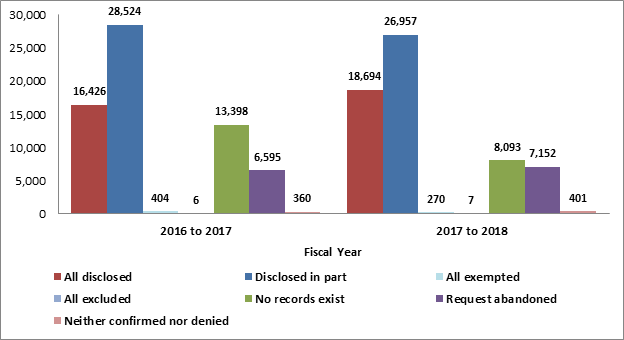
Figure 11 - Text version
This table compares the disposition of closed requests from the 2016 to 2017 fiscal year with the disposition of those for the 2017 to 2018 fiscal year.
| Disposition of closed requests | 2016 to 2017 | 2017 to 2018 |
|---|---|---|
| All disclosed | 16,426 | 18,694 |
| Disclosed in part | 28,524 | 26,957 |
| All exempted | 404 | 270 |
| All excluded | 6 | 7 |
| No records exist | 13,398 | 8,093 |
| Request abandoned | 6,595 | 7,152 |
| Neither confirmed nor denied | 360 | 401 |
Complexity
In the 2017 to 2018 fiscal year, government institutions processed about 9.1 million pages for closed requests; 64% were disclosed either in full or in part.
Government institutions undertook outside consultations in 1.5% of all closed requests.
| Disposition of requests | Number of pages processed | Number of pages disclosed | Number of requeststable 30 note 1 | |||
|---|---|---|---|---|---|---|
| 2016 to 2017 | 2017 to 2018 | 2016 to 2017 | 2017 to 2018 | 2016 to 2017 | 2017 to 2018 | |
| All disclosed | 911,322 | 895,256 | 847,850 | 831,635 | 16,426 | 18,694 |
| Disclosed in part | 7,119,892 | 8,071,604 | 5,158,833 | 4,961,915 | 28,524 | 26,957 |
| All exempted | 78,682 | 31,812 | 0 | 0 | 404 | 270 |
| All excluded | 204 | 1,004 | 0 | 0 | 6 | 7 |
| Request abandonedtable 30 note 2 | 103,823 | 124,198 | 40,736 | 47,121 | 6,595 | 7,152 |
| Total | 8,213,923 | 9,123,874 | 6,047,419 | 5,840,671 | 51,955 | 53,080 |
Table 30 Notes
Note: Institutions subject to the Privacy Act may receive and process duplicate records and, in the end, release a single copy of the duplicates to the requester. |
||||||
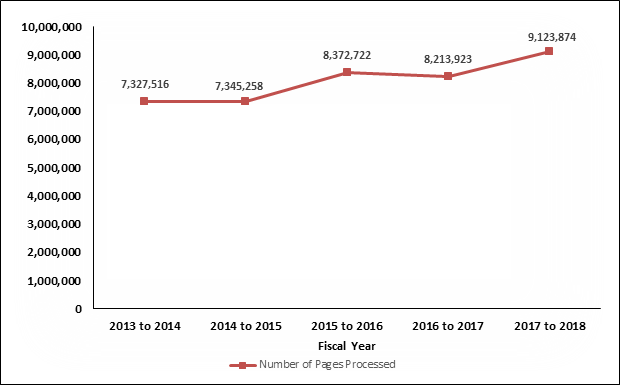
Figure 12 - Text version
This table identifies the number of pages processed over 5 years, from 2013 to 2014 fiscal year to 2017 to 2018 fiscal year.
| Disposition of closed requests | 2013 to 2014 | 2014 to 2015 | 2015 to 2016 | 2016 to 2017 | 2017 to 2018 |
|---|---|---|---|---|---|
| All disclosed | 7,327,516 | 7,345,258 | 8,372,722 | 8,213,923 | 9,123,874 |
| Disposition | Consultation required | Legal advice sought | Interwoven informationtable 31 note 1 | Othertable 31 note 2 | Total |
|---|---|---|---|---|---|
| All disclosed | 37 | 1 | 104 | 234 | 376 |
| Disclosed in part | 843 | 25 | 4,129 | 560 | 5,557 |
| All exempted | 5 | 2 | 5 | 0 | 12 |
| All excluded | 0 | 0 | 0 | 0 | 0 |
| Request abandoned | 55 | 3 | 34 | 27 | 119 |
| Neither confirmed nor denied | 8 | 1 | 2 | 1 | 12 |
| Total | 948 | 32 | 4,274 | 822 | 6,076 |
Table 31 Notes
|
|||||
Extensions
91.7% of all extensions taken for closed requests cited paragraph 15(a)(i) of the Privacy Act as a reason for the extension, relating to interference with government operations.
| Length of extensionstable 32 note 1 | 15(a)(i): Interference with operations | 15(a)(ii): Consultation | 15(b): Translation or conversion | Total | |
|---|---|---|---|---|---|
| Section 70table 32 note 2 | Othertable 32 note 3 | ||||
| 1 to 15 days | 28 | 0 | 4 | 0 | 32 |
| 16 to 30 days | 5,972 | 4 | 527 | 10 | 6,503 |
| Total | 6,000 | 4 | 531 | 10 | 6,545 |
Table 32 Notes
|
|||||
ExemptionsFootnote 6
The tables that follow indicate exemptions applied under the Privacy Act in requests closed during the reporting period.
| Provision | Number of requests |
|---|---|
| 18(2) | 283 |
| Provision | Number of requests |
|---|---|
| 19(1)(a) | 936 |
| 19(1)(b) | 71 |
| 19(1)(c) | 922 |
| 19(1)(d) | 608 |
| 19(1)(e) | 1 |
| 19(1)(f) | 2 |
| Provision | Number of requests |
|---|---|
| 20 | 3 |
| Provision | Number of requests |
|---|---|
| 21 | 5,998 |
| Provision | Number of requests |
|---|---|
| 22(1)(a)(i) | 772 |
| 22(1)(a)(ii) | 320 |
| 22(1)(a)(iii) | 22 |
| 22(1)(b) | 5,898 |
| 22(1)(c) | 703 |
| 22(2) | 2 |
| 22.1 | 18 |
| 22.2 | 1 |
| 22.3 | 7 |
| Provision | Number of requests |
|---|---|
| 23(a) | 11 |
| 23(b) | 1 |
| Provision | Number of requests |
|---|---|
| 24(a) | 3 |
| 24(b) | 166 |
| Provision | Number of requests |
|---|---|
| 25 | 70 |
| Provision | Number of requests |
|---|---|
| 26 | 23,034 |
| Provision | Number of requests |
|---|---|
| 27 | 703 |
| Provision | Number of requests |
|---|---|
| 28 | 20 |
ExclusionsFootnote 7
The tables that follow indicate exclusions applied under the Privacy Act for requests closed during the reporting period.
| Provision | Number of requests |
|---|---|
| 69(1)(a) | 4 |
| 69(1)(b) | 0 |
| Provision | Number of requests |
|---|---|
| 69.1 | 0 |
| Provision | Number of requests |
|---|---|
| 70(1) | 3 |
| 70(1)(a) | 1 |
| 70(1)(b) | 0 |
| 70(1)(c) | 1 |
| 70(1)(d) | 1 |
| 70(1)(e) | 4 |
| 70(1)(f) | 0 |
| Provision | Number of requests |
|---|---|
| 70.1 | 0 |
Consultations
The number of consultations between federal government institutions decreased by 12% from the 2016 to 2017 fiscal year to the 2017 to 2018 fiscal year.
| Consultations | Number of consultations | Number of pages to review | ||
|---|---|---|---|---|
| 2016 to 2017 | 2017 to 2018 | 2016 to 2017 | 2017 to 2018 | |
| Received during reporting period | 567 | 483 | 49,937 | 80,711 |
| Outstanding from the previous reporting period | 34 | 46 | 4,675 | 23,946 |
| Total | 601 | 529 | 54,612 | 104,657 |
| Closed during the reporting period | 555 | 485 | 29,169 | 69,422 |
| Pending at the end of the reporting period | 46 | 44 | 25,443 | 35,235 |
| Recommendation | Number of days required to close consultation requests | ||||||
|---|---|---|---|---|---|---|---|
| 1 to 30 days | 31 to 60 days | 61 to 120 days | 121 to 180 days | 181 to 365 days | More than 365 days | Total | |
| Disclose entirely | 155 | 18 | 9 | 3 | 2 | 1 | 188 |
| Disclose in part | 184 | 42 | 18 | 6 | 3 | 3 | 256 |
| Exempt entirely | 8 | 5 | 3 | 1 | 2 | 0 | 19 |
| Exclude entirely | 0 | 0 | 0 | 0 | 0 | 0 | 0 |
| Consult other institutiontable 36 note 1 | 3 | 0 | 0 | 0 | 0 | 0 | 3 |
| Other | 14 | 0 | 1 | 0 | 1 | 0 | 19 |
| Total | 367 | 65 | 31 | 10 | 8 | 4 | 485 |
Table 36 Notes
|
|||||||
Costs
The cost to administer the Government of Canada’s privacy program increased by 6.7% to $42.6 million in the 2017 to 2018 fiscal year, with the average cost per closed request decreasing by 3.9%.
| Description of costs | Amount | |
|---|---|---|
| 2016 to 2017 | 2017 to 2018 | |
| Cost of operationstable 37 note 1 | $39,904,408.00 | $42,577,934.00 |
| Requests closed | 65,713 | 61,574 |
| Average cost per closed requesttable 37 note 2 | $607.26 | $691.49 |
| Pages processed | 8,213,923 | 9,123,874 |
| Average cost per page processed | $4.86 | $4.67 |
Table 37 Notes
|
||
Disclosures under subsection 8(2) of the Privacy Act
Subsection 8(1) of the Privacy Act states that “personal information under the control of a government institution shall not, without the consent of the individual to whom it relates, be disclosed by the institution except in accordance with this section.” Subsection 8(2) of the Act, subject to other Acts of Parliament, provides for exceptions where it would be possible for government institutions to disclose personal information without consent.
| Paragraph 8(2)(e)table 38 note 1 | Paragraph 8(2)(m)table 38 note 2 | Total |
|---|---|---|
| 6,053 | 144 | 6,197 |
Table 38 Notes
|
||
Requests for correction of personal information and notations
Subsection 12(2) of the Privacy Act provides individuals with the right to request that government institutions correct personal information under their control when the individual believes that it may contain errors or omissions. Alternatively, the individual may request that government institutions attach a notation to the information to reflect any corrections that were requested but not made.
Where the information has been disclosed to other individuals or organizations, government institutions are also required to advise them of the correction or notation.
| Disposition of received requests | Amount |
|---|---|
| Requests for correction accepted | 141 |
| Notations attached | 27 |
| Total | 168 |
Privacy impact assessments
Privacy impact assessments (PIAs) provide a framework to ensure that privacy is considered throughout the design or redesign of programs or service delivery. PIAs identify the extent to which proposals comply with all appropriate statutes, assist managers and decision makers in avoiding or mitigating privacy risks, and promote informed policy, program and system design choices.
Completed PIAs must be submitted to the Treasury Board of Canada Secretariat, as well as to the Office of the Privacy Commissioner.
| Privacy impact assessments | Amount |
|---|---|
| Number of PIAs completedtable 40 note 1 | 75 |
Table 40 Notes
|
|
Personal information banks
Personal Information Banks (PIBs) are descriptions of personal information held by government institutions. The Privacy Act requires that PIBs describe all personal information about individuals that is organized and retrievable by a person’s name or by an identifying number, symbol or other particular assigned only to that person. PIBs must include personal information that has been or is being used, or is available for use, to support a program or activity.
Institution-specific PIBs describe personal information contained in the records of a specific government institution.
Standard PIBs describe personal information found in records created, collected and maintained by most government institutions to support common internal programs and activities, such as communications, travel and employment. They are created by the Treasury Board of Canada Secretariat and government institutions can register against them.
Central PIBs describe personal information about members of the general public, as well as current and former employees from all or several government institutions. They are maintained by central government departments and agencies.
| Personal information banks | Amount |
|---|---|
| Number of new institution-specific PIBs registered | 19 |
| Number of times standard PIBs were registered against by government institutionstable 41 note 1 | 123 |
| Number of central PIBs registered | 0 |
| Total number of new PIBs registered | 142 |
| Number of government institutions registering new PIBs | 27 |
Table 41 Notes
|
|
Privacy Act requests since 1983
The statistics that follow reflect the best available data since 1983. The categories have been adjusted in some cases in order to compare data across the years.
| Requests under the Privacy Act | Number of requests |
|---|---|
| Requests received | 1,644,446 |
| Requests closed | 1,616,640 |
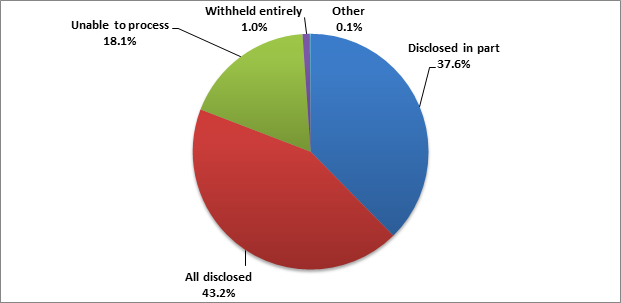
Figure 13 - Text version
This table identifies the disposition of closed requests since 1983.
| Disposition of closed requests | Requests as percentage |
|---|---|
| All disclosed | 43.7% |
| Disclosed in part | 37.4% |
| Unable to process | 17.8% |
| Withheld entirely | 1.0% |
| Other | 0.1% |
In the preceding figure:
- “Unable to process” includes the categories “no records exist,”Footnote 8 “transferred,”Footnote 9 “abandoned”Footnote 10 and “requests that could not be processed.”Footnote 11
- “Withheld entirely” includes categories “all exempted” and “all excluded.”
- “Other” consists of the category “neither confirmed nor denied.”
| Disposition of closed requests | Requests as percentage | Number of requests |
|---|---|---|
| All disclosed | 43.20 | 698,365 |
| Disclosed in part | 37.63 | 608,275 |
| All exempted | 0.95 | 15,354 |
| All excluded | 0.04 | 660 |
| No records exist | 4.16 | 67,290 |
| Abandoned | 5.64 | 91,187 |
| Neither confirmed nor denied | 0.10 | 1,656 |
| Transferred | 1.99 | 32,188 |
| Requests that could not be processed | 6.29 | 101,665 |
| Total | 100.00 | 1,616,640 |
| Closure time (including requests for which extensions were required) | Requests as percentage | Number of requests |
|---|---|---|
| 0 to 30 days | 61.0 | 987,239 |
| 31 to 60 days | 17.9 | 288,602 |
| 61 days or more | 21.1 | 340,799 |
| Total | 100.0 | 1,616,640 |
| Description of cost of operations | Amount |
|---|---|
| Requests closed | 1,616,640 |
| Cost of operationstable 45 note 1 | $586,454,250.12 |
| Average cost per closed requesttable 45 note 2 | $362.76 |
Table 45 Notes
|
|
© Her Majesty the Queen in Right of Canada, represented by the President of the Treasury Board, 2018,
ISSN: 2561-3545