
Comptroller General of Canada appearance before the Standing Senate Committee on National Finance (NFFN) (November 18, 2025)
1. Opening remarks
Notes for remarks by Annie Boudreau, Comptroller General of Canada, at the Standing Senate Committee on National Finance, on accounting principles applicable to the federal government
, Ottawa
Check against delivery
Introduction
Thank you, Mr. Chair.
It’s a pleasure to be here today.
Before I begin my speech, I would like to acknowledge that we are gathered here today on the traditional unceded territory of the Algonquin Anishinaabeg people.
I am joined by Martin Krumins, Assistant Comptroller General, Financial Management Sector and Blair Kennedy, Executive Director, Government Accounting Policy and Reporting.
My remarks will focus on my role within the Treasury Board of Canada Secretariat (TBS), particularly with regard to financial matters and my commitment to responsible and transparent management of taxpayer dollars.
My role
Mr. Chair, as Comptroller General of Canada, I am responsible for government-wide direction and leadership for financial management, which includes, among other things, procurement and real property.
My department sets the administrative framework for how organizations should manage their real property.
They are accountable for ensuring that their real property supports their operational needs and is managed effectively.
This includes determining which assets are required, how they are maintained, and when and how they are disposed of when no longer needed.
As for the procurement process, this is a shared responsibility across the government.
All departments and agencies have authorities to enter into contracts up to certain amounts.
Public Services and Procurement Canada and Shared Services Canada act as common service providers for large or complex contracts, while TBS maintains the policy under which procurement activities must be managed.
Public Accounts
Mr. Chair, as members will know, the Public Accounts of Canada is the annual report of the federal government’s financials for the past fiscal year.
Preparing the Public Accounts involves multiple players.
My office – the Office of the Comptroller General – determines how financial information is recorded and reported across government.
We also set the disclosure requirements that departments must follow to support transparency and accountability.
The Receiver General, at Public Services and Procurement Canada, compiles the financial data submitted by departments and agencies to ensure they are consistent and complete and produces the final consolidated statements.
And the Department of Finance Canada validates the fiscal information and makes sure it aligns with broader economic reporting and budget planning.
Making this information publicly available helps ensure that spending decisions are open to scrutiny so that parliamentarians can exercise their oversight role, and Canadians can see how their tax dollars are being used.
Improvements to Public Accounts
Mr. Chair, I want to assure this committee that we are always working to improve the Public Accounts – both in terms of the quality of the information they provide, and the efficiency of its production and publication.
The goal is to ensure the data is reliable, timely and useful.
And progress continues to be made.
For instance, in the current fiscal year, we have implemented new Chief Financial Officer Certifications, improved controls on the Statement of Cash Flow, enhanced the membership of several important accounting oversight committees and delivered mandatory training to the community.
These measures ensure compliance with policy related to financial reporting and that the information included in the Public Accounts of Canada is accurate and timely.
But one thing that will remain the same, Mr. Chair, is the commitment to the objectivity and integrity of financial statements.
The new Capital Budgeting Framework will enhance – not replace – existing financial reporting.
The consolidated financial statements included in the Public Accounts of Canada will not change as a result of the new Capital Budgeting Framework and will remain fully compliant with Public Sector Accounting Standards.
As always, Mr. Chair, we continue to welcome the views of parliamentarians – including this committee – to help improve the Public Accounts.
Conclusion
I would now be happy to take questions.
Thank you.
2. Accounting standards
Question 1: Why are the Public Accounts not adopting Canada’s Capital Budgeting Framework?
The Public Accounts follow Canadian Public Sector Accounting Standards, which are set by an independent board. These standards apply to all levels of government and ensure consistency and transparency in financial reporting.
Under these standards, the government must compare actual results to the original budget using the same accounting rules and categories. This allows Parliament and Canadians to see how spending matched the plan, using a consistent and reliable format.
Canada’s Capital Budgeting Framework is a planning tool that highlights long-term investments, but it does not replace the financial statements. The Public Accounts will continue to meet all accounting standards while the framework provides additional insight into economic priorities.
Question 2: What are the key distinctions between transfer payments, operating and capital?
Key distinctions between transfer payments, operating expenses, and capital expenses are governed by Public Sector Accounting Standards and Government of Canada directives. These are found in official accounting handbooks, directives and financial reporting policies.
Transfer payments are funds the government gives to individuals, organizations or other governments without expecting goods, services or repayment in return. These payments support public priorities such as health care, education and income support.
Operating expenses cover the everyday costs of running government programs, such as salaries, utilities and supplies. These costs are recorded in the year they happen and directly affect the annual deficit.
Capital expenses involve buying or building long-term assets such as buildings, vehicles or information technology (IT) systems that serve Canadians for many years. Their cost is spread out over time through amortization, which reflects how long the asset is expected to be useful.
Question 3: What is the process for developing a standard within the Public Sector Accounting Standards framework?
- Identify and research: The Public Sector Accounting Board (PSAB) identifies issues needing new or updated standards, researches them, and consults stakeholders to understand impacts and options.
- Draft and consult: PSAB publishes proposals (Statement of Principles and Exposure Draft) for public comment, refining the standard based on feedback.
- Finalize and issue: After reviewing input, PSAB approves the standard and publishes it in the Public Sector Accounting Handbook with an effective date and guidance.
Question 4: As a result of PSAB’s new Conceptual Framework and Reporting Model, what changes should Parliament expect in presentation?
The Conceptual Framework and Reporting Model will be implemented in fiscal year 2026–27.
Among the changes to expect are:
- significant structural changes to two financial statements to allow users to better understand financial results
- the requirement that liabilities will have to be separated between financial and non-financial liabilities, which may not always be straightforward
An action plan is in place to manage the changes across the government.
Question 5: What governance exists around setting or amending amortization periods (for example, componentization, residual values), and what would be the fiscal impact if average useful lives were shortened or lengthened by one year?
Useful lives are set by departments based on asset condition, usage and historical data, guided by Treasury Board policy and the Public Sector Accounting Standards.
Changes to lives, residual values or componentization are treated prospectively as changes in estimates.
A one-year change in the average useful life of a significant asset class can result in a material change in amortization; the methods applied and any significant changes are disclosed in the notes to the consolidated financial statements.
Question 6: For large infrastructure transfers to provinces and municipalities, when are funds expensed?
Expensed immediately:
- when all eligibility criteria are met upfront (province qualifies, and agreement is signed)
- example: a lump-sum grant for a highway project where eligibility is confirmed at signing
Expensed recognized over time:
- when the agreement requires ongoing eligibility or performance obligations before releasing funds (milestones, progress reports)
- expense is recorded as each condition is met, not all at once
- example: multi-year infrastructure program where payments depend on annual progress
Under the Capital Budgeting Framework, these transfer payments will be considered as capital.
3. Public Accounts
Question 1: Why were the Public Accounts 2025 not tabled until ?
Under the Financial Administration Act (section 64(1)), the President of the Treasury Board must table the Public Accounts by , or, if the House of Commons is not sitting during that period, within the first 15 days once the House reconvenes.
The Public Accounts were tabled well in advance of this legislated tabling deadline.
For the 27th year in a row, the Government of Canada received a clean audit opinion on its consolidated financial statements. This demonstrates the high quality of Canada’s financial reporting.
The government continues to seek opportunities to enhance the usefulness, quality and presentation of the Public Accounts in future years.
Question 2: Has the Office of the Comptroller General been consulted on the new Capital Budgeting Framework?
The Office of the Comptroller General (OCG) was consulted on the Capital Budgeting Framework and confirmed that there is no impact on Public Accounts.
The consolidated financial statements are prepared in accordance with the stated accounting policies of the Government of Canada, which conform with Canadian Public Sector Accounting Standards.
In accordance with the Public Sector Accounting Standards, the budget information should be presented in the consolidated financial statements using the categories outlined in the Consolidated Statement of Operations and Accumulated Operating Deficit to be able to compare the budget to the actual results.
Question 3: What do the government’s net debt, accumulated deficit and budgetary balance represent?
Budgetary balance is the annual accrual surplus or deficit.
Accumulated deficit (negative net worth) is the cumulative result of past balances.
Net debt (liabilities minus financial assets) reflects the future revenue needed to pay today’s net obligations.
Question 4: What is the latest update on the Public Service Pension Fund non-permitted surplus?
Following the President of Treasury Board announcement on , that the Public Service Pension Fund was in a non-permitted surplus position, three separate transfers were made to move funds from the Public Service Pension Fund to the Consolidated Revenue Fund.
These transactions took place on , , and .
The government transferred this non-permitted surplus to the Consolidated Revenue Fund, where it will be held while next steps are considered.
At this point, the government has yet to announce its further intentions with respect to the treatment of these funds.
These transactions were reported in the , consolidated financial statements.
Question 5: What is the role of the Comptroller General in the Public Accounts process?
Provides government-wide financial management leadership:
- The Comptroller General sets accounting standards and policies for federal departments and agencies, ensuring compliance with Public Sector Accounting Standards and consistency across government financial reporting.
Oversees the preparation of the Public Accounts:
- The Office of the Comptroller General leads the preparation of the Public Accounts of Canada in collaboration with the Receiver General and the Department of Finance Canada, ensuring the accuracy and integrity of consolidated financial statements.
Ensures accountability and transparency in financial reporting:
- By guiding internal controls and financial management systems, the Comptroller General helps maintain reliable reporting for Parliament and supports the annual audit by the Auditor General.
4. Professional and special services
Question 1: What are professional and special services?
Response
“Professional and special services” is a broad category of the Public Accounts that includes a wide range of services such as engineering and architectural services, legal services, and health and welfare services, among others.
Contracted services have always been an important part of how the government delivers programs and services to Canadians. For example, professional services might be needed to acquire special expertise, to meet unexpected fluctuations in workload, or complement the work of the professional public service.
Additional context for Public Accounts 2025
Professional and special services represented less than 5% of the total government expenditures in 2025.
Examples of services acquired in 2024–25 are:
- services acquired through the Canadian Surface Combatant Definition Contract, which represent costs for ship design, design licence fees and acquiring necessary materials
- cost of health services for the beneficiaries of the Interim Federal Health Program as well as administrative fees paid to a third-party claims administrator
- remediation activities for the Faro Mine in Yukon and for the Giant Mine in the Northwest Territories
- construction services for the Centre Block rehabilitation project, Les Terrasses de la Chaudière Building Envelope Replacement Project, and construction management services for various projects in Western region
Question 2: What amounts are reported in the professional and special services expenditures as presented in Volume III?
Response
Amounts reported include both internal and external expenditures by category of services, allocated by department and agency under each ministry.
External expenditures result from transactions between the government and outside parties.
Internal expenditures result from transactions involving organizations that are part of the Government of Canada as a reporting entity.
Additional context for Public Accounts 2025
The details for these expenses can be found in all three volumes of the Public Accounts of Canada.
For Public Accounts 2025, there were total reported expenditures of $23.1 billion spent for each main category of services, allocated by department and agency under each ministry.
This includes adjustments of $3.5 billion for internal expenses and other adjustments.
This leaves a net total expense on professional and special services of $19.6 billion in accordance with the accounting policies of the Government of Canada and Canadian Public Sector Accounting Standards (Volume I: Section 2, Note 6h).
Question 3: Why did the professional and special services expenditures increase compared to previous year?
Response
In fiscal year 2024–25, Professional and Special Services expenditures have increased by $2.4 billion when compared to fiscal 2023–24.
The increase in professional services expenditures compared to last year is largely attributable to increases in engineering and architectural services for National Defence, Fisheries and Oceans Canada, the Canadian Space Agency, health and welfare services, and other services for specialized training services. Combined together, these three categories represent an increase of $2.4 billion.
Additional context
Since , the government has taken a number of concrete actions to strengthen procurement oversight and reduce departments’ use of management and IT consultants, including:
- updated the manager’s guide and introduced new mandatory procedures for procuring professional services
- published the Directive on Digital Talent to support the development of a robust internal digital workforce, establishing reasonable thresholds for departments to ascertain whether qualified talent is available before contracting out
- completed a horizontal audit to evaluate governance, decision-making and contracting controls and took concrete actions to enhance mechanisms to identify procurement-related risks and non-compliance through a new Risk and Compliance Process
- Developed a Risk and Compliance Process to assess controls and risk in procurement and other key administrative areas, which was launched in
Question 4: Why did management consulting decrease compared to previous year?
Response
In fiscal year 2024–25, management consulting decreased by $388 million when compared to fiscal 2023–24.
This decrease is partly due to a review to ensure the accuracy of financial coding.
This led to the discovery that certain system integrator contracts better reflected informatic services as opposed to management consulting. This classification was corrected in 2024–25.
Specifically, in 2024–25, $184 million in informatic services would have been coded to management consulting if the same classification was kept.
These contracts were initiated in 2021–22. As a result, management consulting was overstated and informatic services understated since that date.
Combined together, management consulting and informatics services have decreased by $354 million, or 10%, compared to 2023–24.
5. Comprehensive Expenditure Review
Question 1: What was the process for identifying savings through the Comprehensive Expenditure Review?
Response
The base for this review was organizations’ voted operating and transfer payment budgets as reported in the 2025–26 Main Estimates.
- Treasury Board central votes and statutory authorities, including public debt charges, were excluded.
Savings targets were set at 7.5% of organizations’ share of their review base in 2026–27, 10% in 2027–28 and 15% in 2028–29.
- Given their sensitive mandates, a 2% target was assigned to National Defence, the Canada Border Services Agency and the Royal Canadian Mounted Police.
Most appropriated organizations were included in the review, except parliamentary and judiciary organizations and fully cost-recovered organizations.
Fully cost-recovered organizations include:
- Canada Post
- Canada Energy Regulator
- Canadian Nuclear Safety Commission
- Northern Pipeline Agency
- Windsor-Detroit Bridge Authority
Organizations submitted their saving proposals at the end of August.
These were then carefully reviewed by the Cabinet Committee on Government Transformation / Government Efficiency (GTGE), which submitted its recommendations to the Minister of Finance and Prime Minister for final decisions.
The savings were announced in the 2025 Budget that was tabled on .
Question 2: What was announced in the 2025 Budget regarding the Comprehensive Expenditure Review?
The 2025 Budget reports overall savings of $9 billion in 2026–27, $10 billion in 2027–28 and $13 billion in 2028–29.
Combined with other savings and revenues, Budget 2025 estimates this will total $60 billion over five years, starting in 2025–26.
| 2026–27 | 2027–28 | 2028–29 | 2029–30 | Ongoing | |
|---|---|---|---|---|---|
| Modernizing Government Operations | 5,530 | 6,179 | 6,950 | 6,554 | 5,441 |
| Streamlining Program Delivery | 161 | 345 | 488 | 530 | 531 |
| Recalibrating Government Programs | 2,863 | 3,856 | 5,404 | 5,358 | 5,391 |
| Total | 8,553 | 10,381 | 12,842 | 12,442 | 11,363 |
| New revenues / lower expenses enabled by efficiencies (Canada Revenue Agency) | 655 | 887 | 1,171 | 1,107 | 1,107 |
| Grand total | 9,208 | 11,268 | 14,012 | 13,550 | 12,471 |
The budget also reports that savings identified through Comprehensive Expenditure Review will contribute to returning the size of the public service to a more sustainable level, with an estimated reduction of 16,000 full-time equivalents (FTEs), or roughly 4.5% of the workforce as of .
By 2028–29, the reductions from the Comprehensive Expenditure Review will represent 4.9% of projected direct program expenses. These reductions are consistent with exercises taken in previous years to ensure that the federal government’s finances are sustainable.
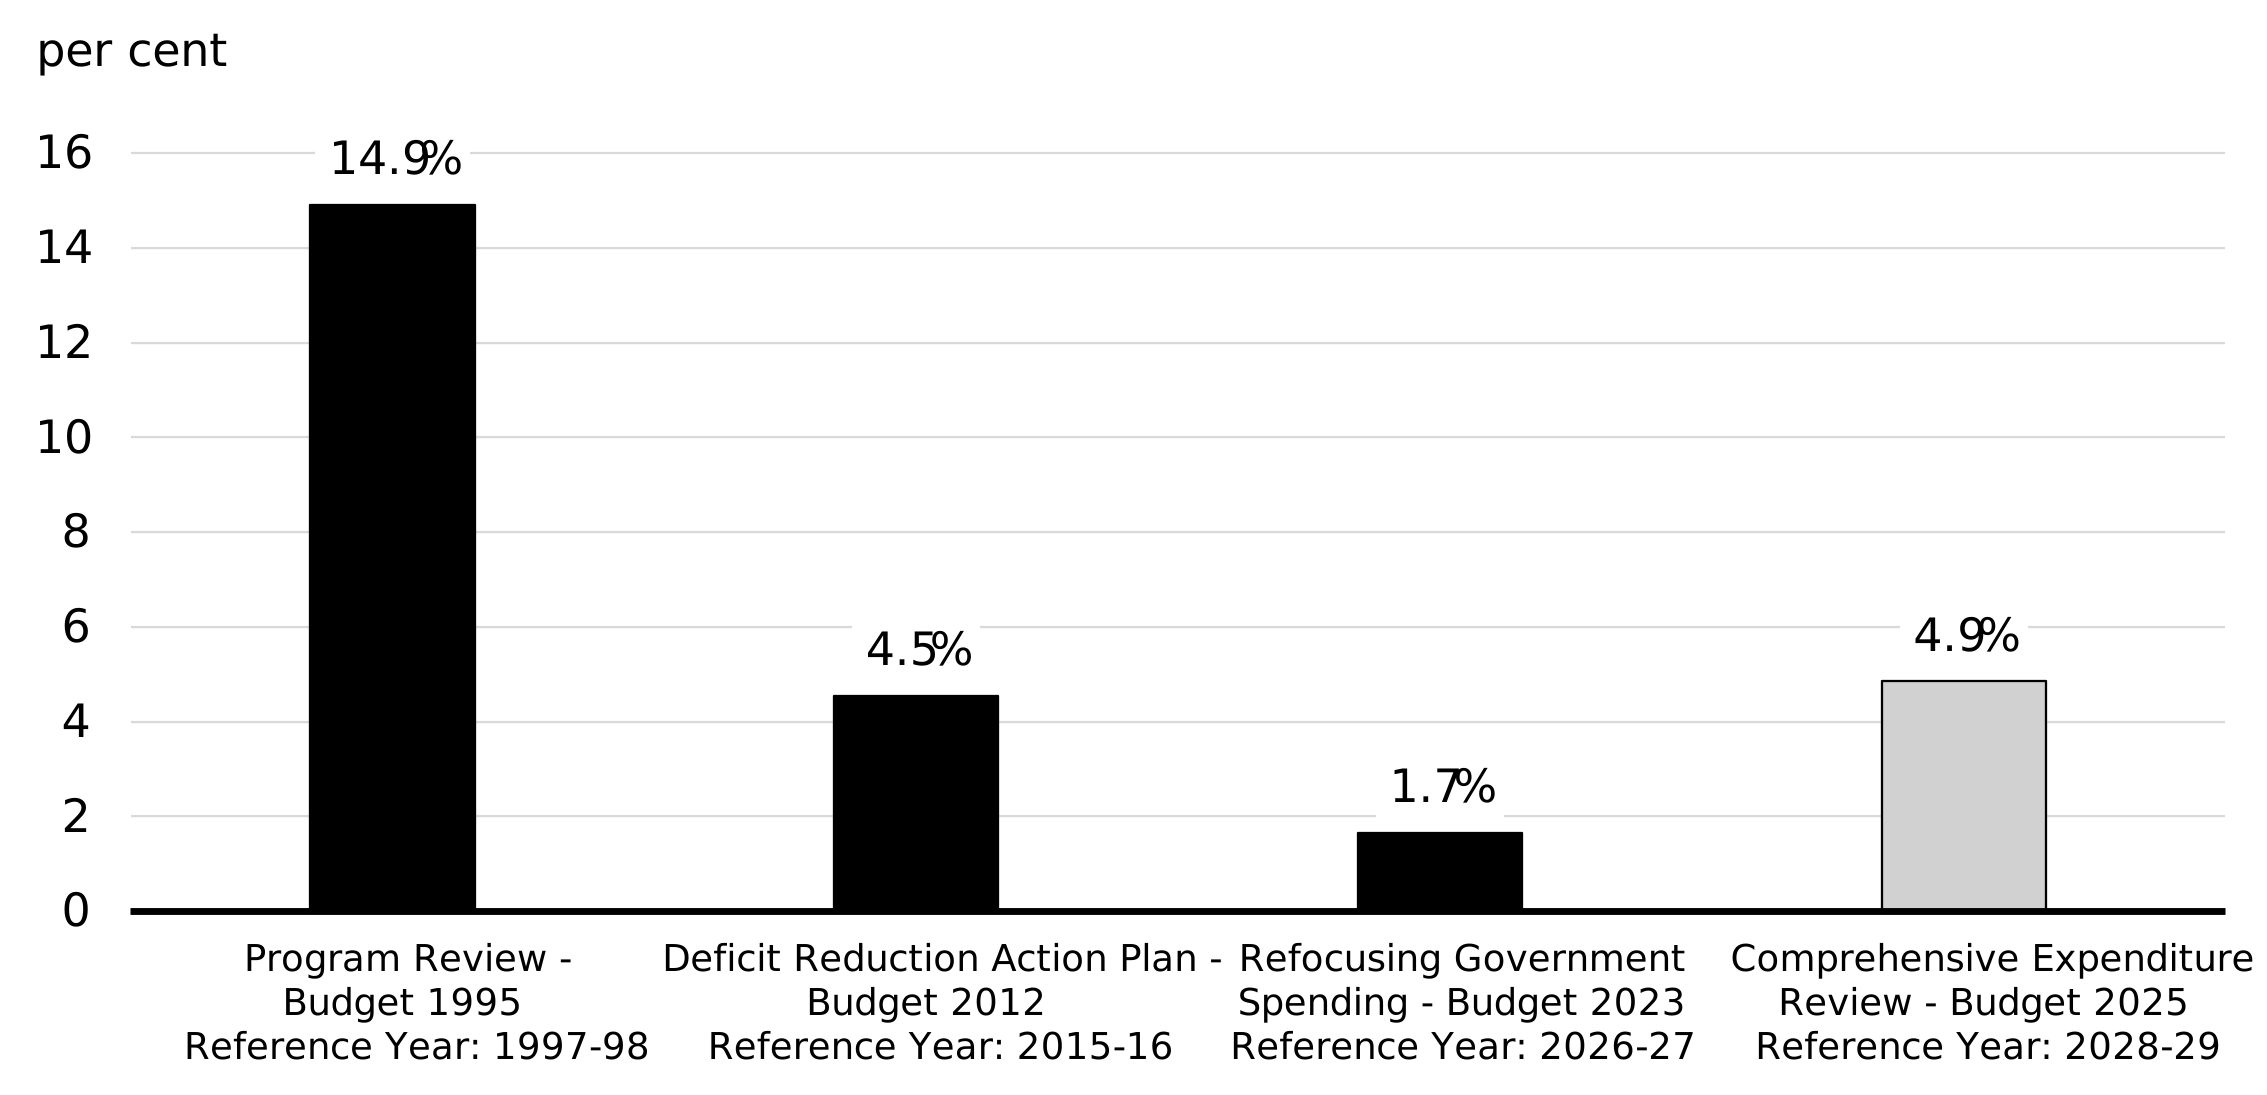
Figure 1 - Text version
| Program Review: Budget 1995 Reference Year – 1997–98 |
Deficit Reduction Action Plan: Budget 2012 Reference Year – 2015–16 |
Refocusing Government Spending: Budget 2023 Reference Year – 2026-27 |
Comprehensive Expenditure Review: Budget 2025 Reference Year – 2028–29 |
|
|---|---|---|---|---|
| Reductions from review as a share of projected direct program expenses in final year | 14.9% | 4.5% | 1.7% | 4.9% |
Question 3: The Interim Parliamentary Budget Officer has issued five requests for information related to the planned savings in the Comprehensive Expenditure Review in Budget 2025. None of them were addressed to TBS, but you nevertheless intervened on behalf of the organizations concerned to request that the deadline be extended until after the vote on the budget motion. Why?
As I indicated in my letter to the Parliamentary Budget Officer, I intervened given my involvement in the conduct of the Comprehensive Expenditure Review and TBS’s federal public service workforce management mandate.
Given the real consequences of downsizing, it seemed disrespectful and ill advised to share information with a third party before sharing it with the individuals concerned. It could also have damaged employees’ trust in the government and damaged the relationship between management and the unions.
Once departments have had the opportunity to review decisions, update their plans as required, and the budget has received parliamentary support, implementation of proposed actions, including workforce changes, will begin in a transparent and respectful manner. This will allow my colleagues to provide accurate and reliable information.
Question 4: What is the share of the total savings from the review for these five organizations covered by the Parliamentary Budget Officer’s requests for information?
The sum of their projected savings over the next five years amounts to about $2 billion, or just over 3% (3.3%) of the total savings of $60 billion over five years, reported in the budget.
The five targeted organizations are:
- Atlantic Canada Opportunities Agency
- Canada Economic Development for Quebec Regions
- Canadian Food Inspection Agency
- Correctional Service Canada
- Fisheries and Oceans Canada
6. Results
Question 1: What were the dates for tabling Main Estimates, the Departmental Plans, the Public Accounts and Departmental Results Reports for the last few years?
Departmental Plans are tabled in Parliament concurrently with or shortly after Main Estimates.
| Fiscal year | Main Estimates | Departmental Plans | Business days between tabling |
|---|---|---|---|
| 2025–26table 2 note * | 15 | ||
| 2024–25 | 0 | ||
| 2023–24table 2 note † | 16 | ||
| 2022–23 | 1 | ||
| 2021–22 | 0 | ||
| 2020–21table 2 note ‡ | 9 | ||
| 2019–20 | 0 | ||
| 2018–19 | 0 | ||
| 2017–18 | 10 | ||
| 2016–17 | 9 | ||
| 2015–16 | 25 | ||
| 2014–15 | 5 | ||
| 2013–14 | 23 | ||
Table 2 Notes
|
|||
| Fiscal year | Public Accounts | Departmental Results Reports | Business days between tabling |
|---|---|---|---|
| 2024–25 | 0 | ||
| 2023–24 | 0 | ||
| 2022–23 | 12 | ||
| 2021–22 | 25 | ||
| 2020–21 | 33 | ||
| 2019–20 | 5 | ||
| 2018–19 | 51 | ||
| 2017–18 | 21 | ||
| 2016–17 | 24 |
Departmental Results Reports are tabled in Parliament following the Public Accounts for the fiscal year ended.
While Public Accounts are ordinarily tabled in October, they have been delayed to December in years where there has been a fall election, for example.
While there is no legislative requirement to publish the Departmental Plans and Departmental Results Reports by a specific date, timelines are deliberately set by TBS staff to allow for the earliest feasible tabling following the tabling of the Main Estimates.
Question 2: How does the new timing for the budget affect the Estimates?
Although the financial cycle has changed slightly following the , announcement by the Minister of Finance, the purpose of the Estimates remains the same.
The earlier release of the budget will allow for more initiatives to be captured in Main Estimates before tabling in the spring.
Departments will still be expected to align their Departmental Plans with the Main Estimates.
Targets, results and indicators
Question 3: Why did departments not have actual results available to report for almost 8% of performance indicators in 2024–25?
Encouragingly, results not available have been on a downward trend in the last few years. Departments may not be able to report actual results for a range of reasons, such as:
- some indicators are new and expected data was not yet available at the time of reporting
- some programs may have suspended data collection
- some indicators may be unavailable if they are collected on a biennial basis or are census dependent
In cases where performance data becomes available after tabling of Departmental Results Reports, a correction can be made in GC InfoBase to reflect changes in achievement of results.
Ultimately, departments and agencies are required to ensure that their indicators are supported by reliable data and reported through Departmental Results Reports and GC Infobase.
Question 4: How many departments met their targets?
Overall, based on 2024–25 information, we continue to see an upward trend in targets met since 2018–19 as departments across government met 53.4% of the targets they set out to achieve.
The breakdown of the remaining results for 2024–25 is as follows:
- missed targets increased slightly from 24.9% to 26.8% in 2024–25 compared to the previous fiscal year
- results that were unavailable dropped from 9.6% in 2023–24 to 7.9% in 2024–25
- the percentage of targets that are to be achieved in the future lowered from 13.6% in 2023–24 to 11.9% in 2024–25
Details on targets
| Fiscal year | Targets met (%) | Missed targets (%) | Not available (%) | Result to be achieved in the future (%) | Total (%) |
|---|---|---|---|---|---|
| 2024–25 | 53.4 | 26.8 | 7.9 | 11.9 | 100 |
| 2023–24 | 51.9 | 24.9 | 9.6 | 13.6 | 100 |
| 2022–23table 4 note * | 50.5 | 27.2 | 9.4 | 13.0 | 100 |
| 2021–22 | 48.3 | 25.2 | 11.9 | 14.6 | 100 |
| 2020–21 | 44.8 | 26.5 | 13.4 | 15.3 | 100 |
| 2019–20 | 48.9 | 19.1 | 16.5 | 15.4 | 100 |
| 2018–19 | 45.4 | 16.8 | 9.2 | 28.5 | 100 |
Table 4 Notes
|
|||||
Question 5: Why do some departments miss their stated targets?
Departments may have missed their stated target for several reasons, including ambitious objectives that require additional time and effort, as well as impacts from external events.
Some examples include:
- unforeseen circumstances such as:
- some ultimate outcome indicators may be affected by a recession that limits foreign direct investment
- more specifically, in the case of an economic downturn, if a department’s indicator depends to a great extent on, for example, labour market participation, and the target population cannot find employment in the labour market, an associated target would likely be missed
- staff shortages affecting the economy as a whole – for example, program partners’ inability to hire, retain and attract staff to implement programming based on established timelines
- reliance on other levels of government or non-governmental organization partners for implementation information
- methodological issues, such as lack of data or an interruption of datasets
- technological changes such as upgrading legacy IT systems
TBS works with departments to help them articulate what results they are trying to achieve and how to measure progress. This includes guidance on how to set targets.
Question 6: Do departments and agencies lower performance targets in order to claim that more targets are being met?
The rationale for departments and agencies to adjust their targets varies. Some key reasons for changes include:
- if a change in program funding or program scope occurs, a new target would normally need to be established
- the methodology of an indicator has changed, for example, due to program changes, data limitations, and, therefore, the previous target is no longer valid and needs to be reset
- a department has reassessed its ability to meet a certain target and has decided to adjust it to make it more ambitious or reassessed it because it was determined that the previous target was unrealistic
| Fiscal year | Number of numeric targets for departmental result indicators | Number of numeric departmental targets that increased from the prior fiscal year | Percentage of numeric departmental targets that increased from the prior fiscal year | Number of numeric departmental targets that decreased from the prior fiscal year | Percentage of numeric departmental targets that decreased from the prior fiscal year |
|---|---|---|---|---|---|
| 2019–20 | 989 | 102 | 10.3% | 55 | 5.6% |
| 2020–21 | 1,054 | 111 | 10.5% | 55 | 5.2% |
| 2021–22 | 1,084 | 106 | 9.8% | 86 | 7.9% |
| 2022–23 | 1,110 | 116 | 10.5% | 43 | 3.9% |
| 2023–24 | 1,110 | 110 | 9.9% | 79 | 7.1% |
| 2024–25 | 1,115 | 136 | 12.2% | 63 | 5.7% |
Table 5 Notes
|
|||||
7. Supplementary Estimates (B)
Overview of the 2025–26 Supplementary Estimates (B)
Supplementary Estimates present information on additional spending requirements which were either not sufficiently developed in time for inclusion in the Main Estimates or have subsequently been refined to account for d evelopments in particular programs and services.
The Supplementary Estimates (B), 2025–26, present a total of $10.7 billion in incremental budgetary spending for 76 organizations, which reflects $10.8 billion to be voted and a $112.9-million decrease in forecast statutory expenditures.
Major items include:
- benefits under the Canadian Dental Care Plan (Health Canada: $1.6 billion)
- settlements addressing past grievances and historic harms committed against Indigenous Peoples, notably $673.1 million for agricultural benefits claims and $270.6 million for the Federal Indian Day Schools settlement
- military procurement projects (total of $1.1 billion), which include $476.0 million for the Future Fighter Capability Program, $294.5 million for previously approved defence investments funded through the Capital Investment Fund, and $215.1 million for the River-class destroyer
- Indigenous services, notably $705.9 million for emergency management in First Nation communities and $154.6 million for elementary and secondary education
- compensation and benefits, including $595.9 million for public service insurance plans and programs and $315.0 million to compensate departments and agencies for salary adjustments
Question 1: What is the proposed spending for 2025–26 so far?
With the Main Estimates, Supplementary Estimates (A) and Supplementary Estimates (B), the Estimates to date for 2025–26 amount to $506.7 billion, including $242.3 billion in planned voted expenditures and $264.3 million in forecast statutory expenditures.
The Main Estimates, 2025–26, presented $486.9 billion in planned budgetary spending to deliver programs and services to Canadians. This consisted of $222.9 billion in voted expenditures and $264.0 billion in statutory spending already authorized through other legislation.
The Supplementary Estimates (A), 2025–26, presented $8.6 billion in voted budgetary spending and $467.0 million in forecast budgetary statutory expenditures across two federal organizations (Communications Security Establishment Canada and National Defence).
Question 2: How does this compare to last year?
Supplementary Estimates (B), 2025–26, shows an increase of approximately $20 billion or 4.1% over the previous year’s estimates to date at the same point. The increase is largely due to:
- accelerated defence spending
- the expansion of eligibility under the Canadian Dental Care Plan
- the new Canada Disability Benefit
- increases in elderly benefits
- the Canada Health Transfer
- fiscal equalization
- interest on unmatured debt
Question 3: Is funding in these Estimates related to initiatives announced in Budget 2025?
New spending announced in Budget 2025 will appear in future Estimates. This includes reductions identified for the Comprehensive Expenditure Review announced in the budget.
Question 4: How does the new timing for the budget affect the Estimates?
Prepared by the Department of Finance Canada, the budget serves as the annual blueprint for the government’s economic agenda. Starting with Budget 2025, the federal budget will now be delivered in the fall, followed by an economic and fiscal update in the spring as the new fiscal year begins.
Having a budget in the fall – well ahead of the start of the new fiscal year – will mean:
- greater predictability and better planning for organizations, businesses, provincial and territorial budget planners, and Canadians
- better alignment between the budget and the main estimates as more budget measures can be included in time for the Main Estimates and the Departmental Plans, enabling parliamentarians to better oversee public expenditures
Question 5: What are the major items for defence spending in these Estimates?
The Government of Canada has committed to achieve the North Atlantic Treaty Organization’s (NATO’s) 2% target this year and further accelerate investments in years to follow. To that end, Supplementary Estimates (A), 2025–26, presented $9.0 billion in incremental spending for National Defence and Communications Security Establishment Canada.
Supplementary Estimates (B), 2025–26, presents an additional $1.1 billion in planned spending for National Defence, bringing the department’s total Estimates for 2025–26 to $46.7 billion – an increase of roughly 35% from 2024–25.
Proposed spending in Supplementary Estimates (B) includes:
- 476.0 million for the Future Fighter Capability Program to purchase advanced fighter aircraft, associated equipment, weapons, infrastructure, IT, and sustainment, including training and software support
- $294.5 million for previously approved defence investments funded through the Capital Investment Fund; this funding will be used for numerous capital projects to procure or improve equipment, systems and facilities, including air defence and anti-drone capabilities, housing for reserve units, and automated data capture technologies for materiel management
- $215.1 million for the River-class destroyer, which will replace both the retired Iroquois-class destroyers and the Halifax-class patrol frigates with a single class of ship capable of meeting multiple threats on both the open ocean and coastal environments
- $59.4 million for domestic production of ammunition
Question 6: Why is there additional funding for the Canadian Dental Care Plan in these Estimates?
The Canadian Dental Care is making oral health care more affordable for uninsured Canadians with an adjusted family net income below $90,000. The program expanded in May to include all remaining eligible Canadians aged 18 to 64. This funding will allow to maintain access to dental services for millions of Canadians.
Question 7: What are the compensation adjustments for TBS ($315 million to TBS)
This funding is to compensate departments, agencies and appropriation-dependent Crown corporations for the impact of collective bargaining agreements and other related adjustments to terms and conditions of service or employment. The costs arise from agreements concluded and terms and conditions updated from to , as well as one-time lump-sum payments issued between and .
Question 8: What is the professional and special services allocation in the 2025–26 Supplementary Estimates (B)?
Professional and special services is a broad category of spending that encompasses many services, for example:
- accountants, lawyers, engineers, scientists and translators
- doctors, nurses and other medical personnel
- management and other research consultants
- outside technical, professional and other expert assistance, for example, engineering and architectural work
- payments for hospital treatments
- other operational and maintenance services performed under contract, such as cleaning of buildings, storage and warehousing
$1,058,059,517 is allocated to professional and special services in the 2025–26 Supplementary Estimates (B), in which two organizations have the bulk of planned professional services spending:
Immigration, Refugees and Citizenship Canada ($601.5 million):
- The increase in professional and special services in the Supplementary Estimates (B) relates primarily to funding the for the Interim Federal Health Program (IFHP) ($598.0 million – object code 0451).
- The IFHP provides health care benefits to asylum claimants, resettled refugees and certain other groups, such as victims of human trafficking and persons detained under the Immigration and Refugee Protection Act, until they become eligible for provincial or territorial health insurance or, in the case of unsuccessful asylum claimants, leave Canada. Coverage under the IFHP includes basic benefits similar to provincial or territorial health insurance (such as doctor visits, hospital care and laboratory services), as well as supplemental benefits (such as urgent dental and vision care, assistive devices and mental health counselling) and prescription drug benefits, similar to what provinces and territories provide to social assistance recipients.
Employment and Social Development Canada ($126.6 million):
- The increase in professional and special services in the Supplementary Estimates (B) relates primarily to the Benefits Delivery Modernization ($125.5 million – object code 0473 – Information technology and telecommunications consultants):
- Due to the expertise and skill set requirements, professional services are required to support stabilization activities of the platform and readiness of the network, following the migration of the Old Age Security program to the new Common Benefit Delivery Platform and to further support the proof of concept phase and start the build and implement phase to onboard the Employment Insurance program to the Common Benefit Delivery Platform.
Question 9: What is the impact of inflation on government departments and programs?
Major statutory transfers to persons are indexed to inflation, meaning that they automatically increase with inflation. This includes, for example, Old Age Security benefits and the Canada child benefit.
In terms of voted programs, departments are compensated for negotiated salary increases through Treasury Board Vote 15 for the current year and through their own votes in future Main Estimates.
| 2011–12 | 2012–13 | 2013–14 | 2014–15 | 2015–16 | 2016–17 | 2017–18 | 2018–19 | 2019–20 | 2020–21 | 2021–22 | 2022–23 | 2023–24 | 2024–25 | 2025–26table 6 note * | |
|---|---|---|---|---|---|---|---|---|---|---|---|---|---|---|---|
| Organizations | 134 | 136 | 135 | 133 | 131 | 131 | 121 | 123 | 124 | 122 | 123 | 126 | 129 | 129 | 130 |
| Budgetary: voted | 91.8 | 91.9 | 87.1 | 86.3 | 88.2 | 89.8 | 102.1 | 112.9 | 125.6 | 125.1 | 141.9 | 190.31 | 198.15 | 191.6 | 222.9 |
| Budgetary: statutory | 159.0 | 160.0 | 165.5 | 149.1 | 153.4 | 160.3 | 155.8 | 163.1 | 174.0 | 179.5 | 200.3 | 207.26 | 234.79 | 257.6 | 263.99 |
| Total budgetary | 250.8 | 251.9 | 252.6 | 235.3 | 241.6 | 250.1 | 257.9 | 276.0 | 299.6 | 304.6 | 342.2 | 397.58 | 432.94 | 449.18 | 486.89 |
| Total budgetary: % growth | Not applicable | 0.4% | 0.3% | -6.8% | 2.7% | 3.5% | 3.1% | 7.0% | 8.6% | 1.7% | 12.3% | 16.2% | 8.9% | 3.8% | 8.4% |
Table 6 Notes
|
|||||||||||||||
| 2011–12 | 2012–13 | 2013–14 | 2014–15 | 2015–16 | 2016–17 | 2017–18 | 2018–19table 7 note * | 2019–20table 7 note * | 2020–21 | 2021–22 | 2022–23 | 2023–24 | 2024–25table 7 note † | 2025–26 | |
|---|---|---|---|---|---|---|---|---|---|---|---|---|---|---|---|
| Organizations | 18 | 44 | 16 | 16 | 43 | 45 | 33 | Not applicable | Not applicable | 42 | 45 | 26 | 26 | 23 | 2 |
| Items | 27 | 102 | 21 | 30 | 87 | 85 | 60 | Not applicable | Not applicable | 77 | 170 | 55 | 109 | 76 | 6 |
| Budgetary: voted | 2.0 | 2.1 | 1.1 | 2.4 | 3.1 | 7.0 | 3.7 | Not applicable | Not applicable | 6.0 | 24.0 | 8.5 | 22.3 | 11.2 | 8.6 |
| Budgetary: statutory | 0.0 | 0.2 | 0.0 | 0.0 | 0.0 | -5.7 | 0.1 | Not applicable | Not applicable | 80.9 | 17.2 | 0.9 | 1.4 | 1.5 | 0.5 |
| Total budgetary | 2.0 | 2.3 | 1.1 | 2.4 | 3.2 | 1.3 | 3.8 | Not applicable | Not applicable | 87.0 | 41.2 | 9.3 | 23.6 | 12.7 | 9.0 |
| Total budgetary: % growth | Not applicable | Not applicable | Not applicable | Not applicable | 30% | -60% | 199% | Not applicable | Not applicable | 2,198% | -53% | -77% | 153% | -46% | -29% |
Table 7 Notes
|
|||||||||||||||
| 2011–12 | 2012–13 | 2013–14 | 2014–15 | 2015–16 | 2016–17 | 2017–18 | 2018–19table 8 note * | 2019–20table 8 note * | 2020–21 | 2021–22 | 2022–23 | 2023–24 | 2024–25 | 2025–26 | |
|---|---|---|---|---|---|---|---|---|---|---|---|---|---|---|---|
| Organizations | 72 | 61 | 62 | 63 | 4 | 68 | 71 | 76 | 39 | 83 | 60 | 89 | 85 | 79 | 76 |
| Items | 357 | 260 | 229 | 281 | 7 | 247 | 286 | 246 | 161 | 330 | 166 | 838 | 826 | 477 | 374 |
| Budgetary: voted | 4.3 | 2.5 | 5.4 | 2.9 | 0.8 | 3.9 | 4.5 | 7.5 | 4.9 | 20.9 | 8.7 | 20.8 | 20.7 | 21.6 | 10.8 |
| Budgetary: statutory | 2.3 | 0.3 | 0.0 | 0.3 | 0.0 | 0.4 | 0.4 | 0.6 | 0.1 | 58.3 | 4.7 | 5.0 | 3.9 | 3.2 | -0.1 |
| Total budgetary | 6.6 | 2.8 | 5.4 | 3.2 | 0.8 | 4.3 | 4.9 | 8.1 | 4.9 | 79.2 | 13.4 | 25.8 | 24.6 | 24.8 | 10.7 |
| Total budgetary: % growth | Not applicable | Not applicable | Not applicable | Not applicable | -75% | 424% | 15% | 66% | -39% | 1,502% | -83% | 93% | -5% | 1% | -57% |
Table 8 Notes
|
|||||||||||||||
| 2011–12 | 2012–13 | 2013–14 | 2014–15 | 2015–16 | 2016–17 | 2017–18 | 2018–19table 9 note * | 2019–20table 9 note * | 2020–21 | 2021–22 | 2022–23 | 2023–24 | 2024–25table 9 note † | 2025–26 | |
|---|---|---|---|---|---|---|---|---|---|---|---|---|---|---|---|
| Organizations | 51 | 49 | 35 | 41 | 58 | 47 | 48 | 48 | 61 | 58 | 75 | 62 | 58 | Not applicable | Not applicable |
| Items | 181 | 182 | 107 | 94 | 234 | 154 | 163 | 171 | 265 | 230 | 515 | 451 | 399 | Not applicable | Not applicable |
| Budgetary: voted | 1.2 | 1.5 | 0.4 | 1.8 | 2.8 | 2.5 | 4.0 | 2.5 | 3.8 | 13.4 | 13.2 | 5.3 | 8.9 | 0.0 | 0.0 |
| Budgetary: statutory | -1.6 | -0.1 | -0.4 | -1.3 | 2.3 | -1.0 | -0.3 | 3.7 | 1.8 | -5.4 | 39 | 5.6 | 4.3 | 0.0 | 0.0 |
| Total budgetary | -0.4 | 1.4 | 0.0 | 0.5 | 5.1 | 1.5 | 3.7 | 6.2 | 5.6 | 8.0 | 17.1 | 10.9 | 13.2 | 0.0 | 0.0 |
| Total budgetary: % growth | Not applicable | Not applicable | Not applicable | Not applicable | 940% | -71% | 144% | 68% | -10% | 43% | 115% | -36% | -23% | -100% | -100% |
Table 9 Notes
|
|||||||||||||||
| 2011–12 | 2012–13 | 2013–14 | 2014–15 | 2015–16 | 2016–17 | 2017–18 | 2018–19table 10 note * | 2019–20table 10 note * | 2020–21 | 2021–22 | 2022–23 | 2023–24 | 2024–25 | 2025–26table 10 note † | |
|---|---|---|---|---|---|---|---|---|---|---|---|---|---|---|---|
| Budgetary: voted | 99.3 | 98.0 | 94.0 | 93.4 | 95.0 | 103.1 | 114.3 | 122.9 | 134.2 | 165.4 | 187.8 | 224.9 | 250.1 | 224.4 | 242.3 |
| Budgetary: % voted | 38.3% | 37.9% | 36.3% | 38.7% | 37.9% | 40.1% | 42.3% | 42.4% | 43.3% | 34.5% | 45.4% | 50.7% | 50.6% | 46.1% | 47.8% |
| Budgetary: statutory | 159.7 | 160.4 | 165.1 | 148.1 | 155.7 | 154.0 | 155.9 | 167.3 | 175.9 | 313.3 | 226.1 | 218.7 | 244.4 | 262.3 | 264.4 |
| Budgetary: % statutory | 61.7% | 62.1% | 63.7% | 61.4% | 62.1% | 59.9% | 57.7% | 57.6% | 56.7% | 65.5% | 54.6% | 49.3% | 49.4% | 53.9% | 52.2% |
| Total budgetary | 259.0 | 258.4 | 259.1 | 241.4 | 250.7 | 257.1 | 270.2 | 290.3 | 310.1 | 478.7 | 413.9 | 443.6 | 494.3 | 486.7 | 506.6 |
| Total budgetary: % growth | Not applicable | Not applicable | Not applicable | Not applicable | 4% | 3% | 5% | 7% | 7% | 54% | -14% | 7% | 11% | -2% | 4% |
Table 10 Notes
|
|||||||||||||||