
Non-advertised appointments by employment equity group
Background
The PSC’s New Direction in Staffing (NDS) came into effect April 1st 2016. It was intended to simplify and streamline staffing across the public service, and provide a greater ability for organizations to customize staffing based on their organizational needs.
As part of the NDS, the Appointment Delegation and Accountability Instrument – which sets out the terms and conditions for delegation of hiring authorities – requires deputy heads to “establish direction, through policy, planning or other means, on the use of advertised and non-advertised appointment processes”.
A common direction across organizations for the use of non-advertised processes is to support Employment Equity objectives.
Analysis
Appointment type |
2013-2014 |
2014-2015 |
2015-2016 |
2016-2017 |
2017-2018 |
2018-2019 |
|---|---|---|---|---|---|---|
Advertised Appointments |
10,671 |
16,542 |
18,264 |
21,419 |
24 179 |
27,099 |
Non-advertised Appointments |
4,680 |
7,660 |
7,993 |
9,048 |
17,996 |
22,986 |
Total |
15,351 |
24,202 |
26,257 |
30,467 |
42,175 |
50,085 |

Text version
Measure |
2013-2014 |
2014-2015 |
2015-2016 |
2016-2017 |
2017-2018 |
2018-2019 |
|---|---|---|---|---|---|---|
Proportion of non-advertised appointments |
30.50% |
31.70% |
30.40% |
29.70% |
42.70% |
45.90% |
Since the implementation of the NDS, there was an increase in the proportion of non-advertised appointments from approximately 30% to 46%.
To determine whether this increase in non-advertised appointments impacted employment equity (EE) group members, we analysed the representation of each EE group in non-advertised appointments.
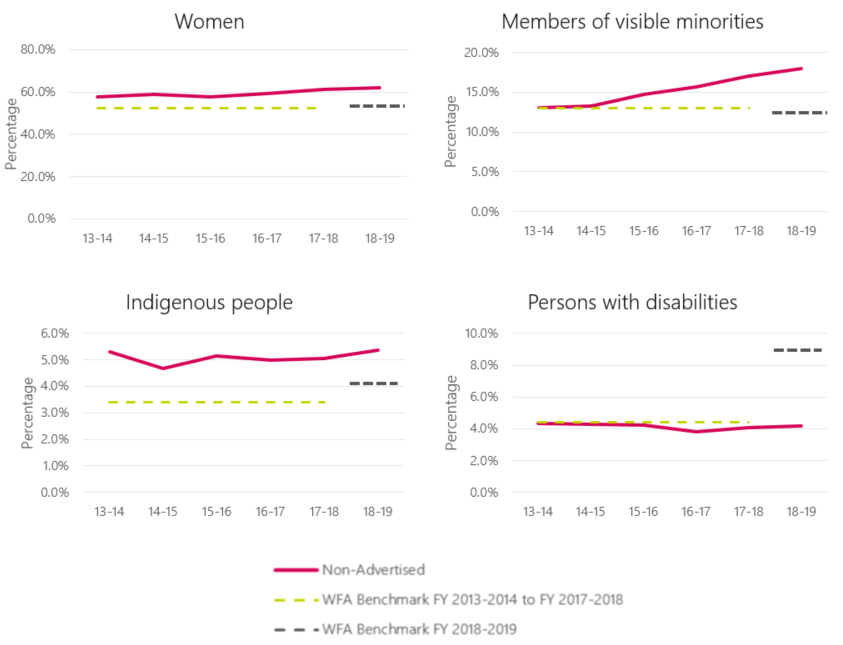
- As demonstrated in the graphs below, there is no adverse effect of non-advertised appointments on EE representation.
- The representation of members of visible minorities in non-advertised appointments increased since the implementation of the NDS, while the representation of all other EE groups remained stable.
- It is important to note that this analysis focusses on visible minorities as a whole. A disaggregated analysis by sub-group may reveal differences in non-advertised appointments between sub-groups.
- This increase in representation for members of visible minorities in non-advertised appointments is partially closing an existing gap with their representation in advertised appointments.
- In 2013-2014, the representation of members of visible minorities was 16.1% in advertised appointments and 13.1% in non-advertised appointments.
- In 2018-2019, the representation of members of visible minorities was 20.1% in advertised appointments and 18.0% for non-advertised appointments.
Text version
Measure |
2013-2014 |
2014-2015 |
2015-2016 |
2016-2017 |
2017-2018 |
2018-2019 |
|---|---|---|---|---|---|---|
Representation in non-Advertised appointments |
57.50% |
59.00% |
57.80% |
59.10% |
61.40% |
61.90% |
WFA benchmark FY 2013-2014 to FY 2017-2018 |
52.50% |
52.50% |
52.50% |
52.50% |
52.50% |
|
WFA benchmark FY 2018-2019 |
|
|
|
|
|
52.70% |
Measure |
2013-2014 |
2014-2015 |
2015-2016 |
2016-2017 |
2017-2018 |
2018-2019 |
|---|---|---|---|---|---|---|
Representation in non-Advertised appointments |
13.10% |
13.30% |
14.80% |
15.70% |
17.00% |
18.00% |
WFA benchmark FY 2013-2014 to FY 2017-2018 |
13.00% |
13.00% |
13.00% |
13.00% |
13.00% |
|
WFA benchmark FY 2018-2019 |
15.30% |
Measure |
2013-2014 |
2014-2015 |
2015-2016 |
2016-2017 |
2017-2018 |
2018-2019 |
|---|---|---|---|---|---|---|
Representation in non-Advertised appointments |
5.30% |
4.70% |
5.10% |
5.00% |
5.00% |
5.40% |
WFA benchmark FY 2013-2014 to FY 2017-2018 |
3.40% |
3.40% |
3.40% |
3.40% |
3.40% |
|
WFA benchmark FY 2018-2019 |
4.00% |
Measure |
2013-2014 |
2014-2015 |
2015-2016 |
2016-2017 |
2017-2018 |
2018-2019 |
|---|---|---|---|---|---|---|
Representation in non-Advertised appointments |
4.40% |
4.30% |
4.20% |
3.80% |
4.10% |
4.20% |
WFA benchmark FY 2013-2014 to FY 2017-2018 |
4.40% |
4.40% |
4.40% |
4.40% |
4.40% |
|
WFA benchmark FY 2018-2019 |
9.00% |
Representation compared to the workforce availability (WFA):
- From 2013-14 to 2017-18, the representation of persons with disabilities in non-advertised appointments was equal to or slightly lower than their WFA. In 2018-19, there was a methodological change in calculating their WFA. As a result, they show a much lower representation in comparison to their WFA in this period.
- All other EE groups have a higher representation in non-advertised appointments than their WFA.
Methodology
Results are based on the fiscal year in which the staffing activity took place. As such, the results are not comparable to the PSC’s Annual Report. The Annual Report uses the fiscal year in which the staffing activity was reflected in the pay system.
The number of appointments to advertised positions includes:
- Advertisements open to the public
- Advertisements open only to current public servants.
The number of appointments to non-advertised positions includes:
- Promotions
- Acting appointments greater than 4 months
- New public servant hires to indeterminate positions
- New public servant hires term positions greater than 3 months
Appointment data comes from the Hiring and Staffing Activities Database. Only departments and agencies subject to the Public Service Employment Act (PSEA) mandate are included. Self-identification data comes from the Employment Equity Data Bank.