
CIPARS 2019: Integrated Findings
On this page
- CIPARS activities
- 2019 key findings
- Integrated antimicrobial use
- Integrated antimicrobial use and resistance - Farm data
- Integrated antimicrobial resistance
- Glossary
Additional information
cipars-picra@phac-aspc.gc.ca
CIPARS 2019: Executive Summary
CIPARS 2019: Figures and Tables
CIPARS 2019: Design and Methods
CIPARS activities
The Canadian Integrated Program for Antimicrobial Resistance Surveillance (CIPARS) brings together diverse sources of data in a robust and sound manner.
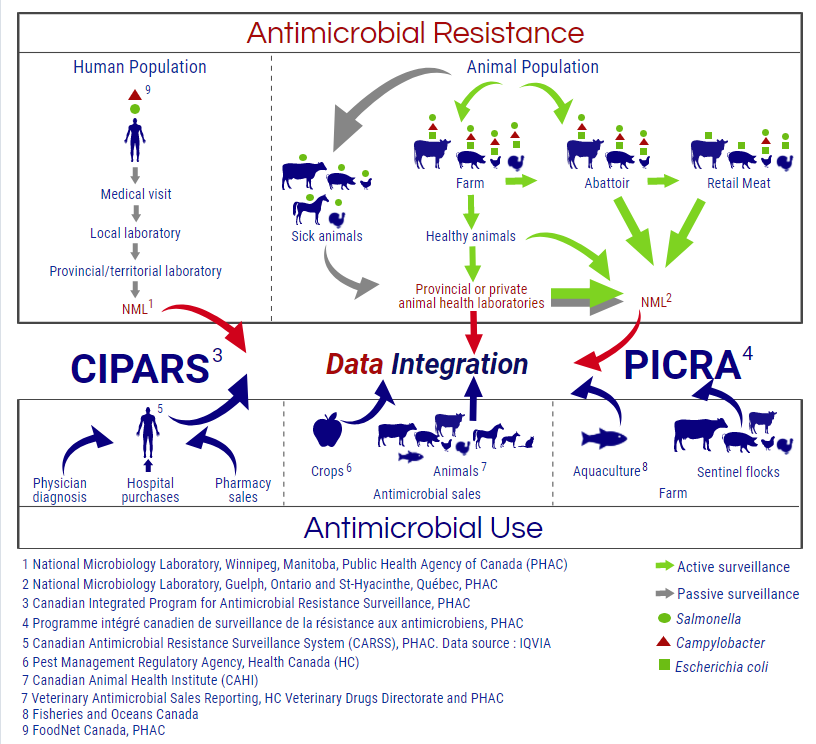
Diagram 1 - Text description
CIPARS brings together antimicrobial resistance and antimicrobial use data from various activities in humans, animals and crops. CIPARS has passive and active surveillance activities in humans and animals (including cattle, pigs, chickens, turkeys, and horses). Human antimicrobial resistance surveillance data is derived from human cases of Salmonella and Campylobacter infection. Animal antimicrobial resistance surveillance data includes data from healthy farm animals sampled on-farm, at abattoirs, and retail meats. CIPARS also has surveillance activities for on-farm antimicrobial use on sentinel farms, and reports antimicrobial sales and distribution data from multiple data sources. CIPARS analysts and epidemiologists analyze and report antimicrobial resistance and antimicrobial use findings for each surveillance year including integration of findings from the various surveillance activities and data sources.
Data sources include:
- The National Microbiology Laboratories (NML), Public Health Agency of Canada (PHAC) in Winnipeg, Manitoba (1), Guelph, Ontario (2) and Saint-Hyacinthe, Québec (2)
- Canadian Integrated Program for Antimicrobial Resistance Surveillance, PHAC (3), Programme intégré canadien de surveillance de la résistance aux antimicrobiens, PHAC (4)
- The Canadian Antimicrobial Resistance Surveillance System (CARSS), PHAC. Data source: IQVIA (5)
- Health Canada’s (HC) Pest Management Regulatory Agency (6)
- Canadian Animal Health Institute (CAHI) (7)
- Veterinary Antimicrobial Sales Reporting, HC Veterinary Drugs Directorate and PHAC (7)
- Fisheries and Oceans Canada (8)
- FoodNet Canada, PHAC (9)
2019 Key findings
Integrated antimicrobial use
- Antimicrobial sales (kg) decreased by 10% between 2018 and 2019.
- Sales for production animals (livestock, aquaculture, horses) decreased by 11% (kg) and decreased by 12% (after adjusting for the biomass in mg/PCU).
- In comparison to 2018, sales for use in pigs, poultry, and aquaculture decreased; sales for use in cattle, horses, cats and dogs, and small ruminants increased in 2019.
Integrated antimicrobial use and resistance
- Integrated farm surveillance data is reported for broiler chickens, grower-finisher pigs, and turkeys.
- Farm surveillance found that AMU either remained stable or decreased across these animal species.
- For grower-finisher pigs, data indicated continued use of medically-important antimicrobials for growth promotion was reported (on one sentinel farm in 2019).
- For turkeys, the number of Campylobacter isolates resistant to ≥ 1 antimicrobial classes decreased.
- The number of Salmonella isolates resistant to ≥ 1 antimicrobial classes from broiler chickens increased.
- The percentage of isolates resistant to ≥ 3 antimicrobial classes remained relatively unchanged for these animal species; with the exception of a decrease in Salmonella resistant to ≥ 3 antimicrobial classes in turkeys.
- Flock or herd mortality remained unchanged.
Integrated antimicrobial resistance
New: Salmonella Enteritidis and quinolone resistance in humans
Salmonella Enteritidis, the most common serovar from sick people, has been decreasing.
However, nalidixic acid resistance in S. Enteritidis isolates has been increasing.
Nalidixic acid resistance in S. Enteritidis is more common in cases with a history of travel outside of Canada.
Detection of quinolone-resistant Salmonella Enteritidis from chicken(s)
Prior to 2018, quinolone (nalidixic acid) resistance was observed once in S. Enteritidis agri-food isolates.
Though numbers are still small, in 2018 and 2019, nalidixic acid resistance in S. Enteritidis isolates from chickens and chicken meat was detected in multiple provinces and multiple surveillance components.
Salmonella resistant to 6 or 7 antimicrobial classes
Though the numbers are still small, we continue to see an increase in Salmonella isolates resistant to 6 or 7 of the 7 antimicrobials classes tested from humans, animals, and food in 2019.
Salmonella Heidelberg from cattle
In 2019, this included drug-resistant Salmonella Heidelberg from healthy cattle; observed for the first time.
Integrated antimicrobial use
Antimicrobial categorization
Antimicrobials are grouped into categories based on their importance to human medicine and the potential consequences of resistance to these drugs:
- Category I: Very high importance
Examples: 3rd generation cephalosporins, fluoroquinolones - Category II: High importance
Examples: macrolides - Category III: Medium importance
Examples: tetracyclines, sulfonamides - Category IV: Low importance
Examples: ionophores, flavophospholipids
Medically important antimicrobials include Category I to III. Antimicrobials of low importance (Category IV, with the exception of flavophospholipids) were removed from the integrated AMU reporting. Data will be available in other CIPARS products.
Categorization system developed by Health Canada’s Veterinary Drugs Directorate. Chemical coccidiostats are considered uncategorized antimicrobials.
Antimicrobial use: Comparison of humans, animals, and crops
New: The Veterinary Antimicrobial Sales Reporting (VASR) system
- New Health Canada regulations required manufacturers, importers, and compounders to report annual sales of medically important antimicrobials intended for use in animals.
- To meet this requirement, the Public Health Agency of Canada and Health Canada designed and developed the online reporting tool VASR.
- The VASR system collects data on the quantity of antimicrobials sold or compounded by animal species and by province/territory.
- The majority of data for sales in this report includes information from manufacturers and importers and does not include compounder data.
Overall sales in 2019
- 12% decrease (since 2018)
- Antimicrobials sold (kg adjusted by biomass) in production animals (decreased sales of tetracyclines, sulfonamides, penicillins, and macrolides).
- Approximately 1.4 times
- More antimicrobials were sold for use in production animals than humans after adjusting for underlying biomass.
- Approximately 23 times
- More animals than people in Canada.

Diagram 2 - Text description
| Population | Proportion (%) |
|---|---|
| Animals | 96% |
| Humans | 4% |
The animal population is an underestimation, as fish are not included.
- Of the antimicrobials sold in 2019:
- 78% were intended for production animals
- 22% were intended for humans
- <1% were intended for cats and dogs
- <1% were intended for crops
- 1% of antimicrobials sold in animals were in Category I.
- Tetracyclines approximately 51% of the overall sales.
Antimicrobial sales (2019) by species*
(Comparisons are between 2018 and 2019)
- Poultry
- Top classes sold: NIR**, penicillins, and tetracyclines
- 9% decrease in kg sold
- Small quantities (<1 kg) of fluoroquinolones and 3rd generation cephalosporins were manufactured or compounded for use in poultry between 2018 and 2019
- Beef cattle
- Top classes sold: tetracyclines, macrolides, and amphenicols
- 13% increase in kg sold
- Increase in sales of Category I antimicrobials by 6% (74 kg)
- Pigs
- Top classes sold: tetracyclines, macrolides, and penicillins
- 21% decrease in kg sold
- Decrease in sales of Category I antimicrobials by 24% (123 kg)
- Dairy cattle
- Top classes sold: tetracyclines, diaminopyrimidine-sulfonamide combinations, and penicillins
- 15% increase in kg sold
- Decrease in sales of Category I antimicrobials by 25% (112 kg)
- Aquaculture
- Only tetracyclines and amphenicols were sold in 2019
- 29% decrease in kg sold
- Cats and dogs
- Top classes sold: penicillins, 1st or 2nd generation cephalosporins and β-lactamase inhibitors
- 17% increase in kg sold
- Increase in sales of Category I antimicrobials by 24% (711 kg)
*For additional information on veal calves, horses, small ruminants, and other animals, please refer to the CIPARS 2019 Figures and Tables.
**NIR = not independently reported.
Species comparisons
The majority (kg) of the antimicrobials sold were intended for use in pigs, cattle, and poultry.
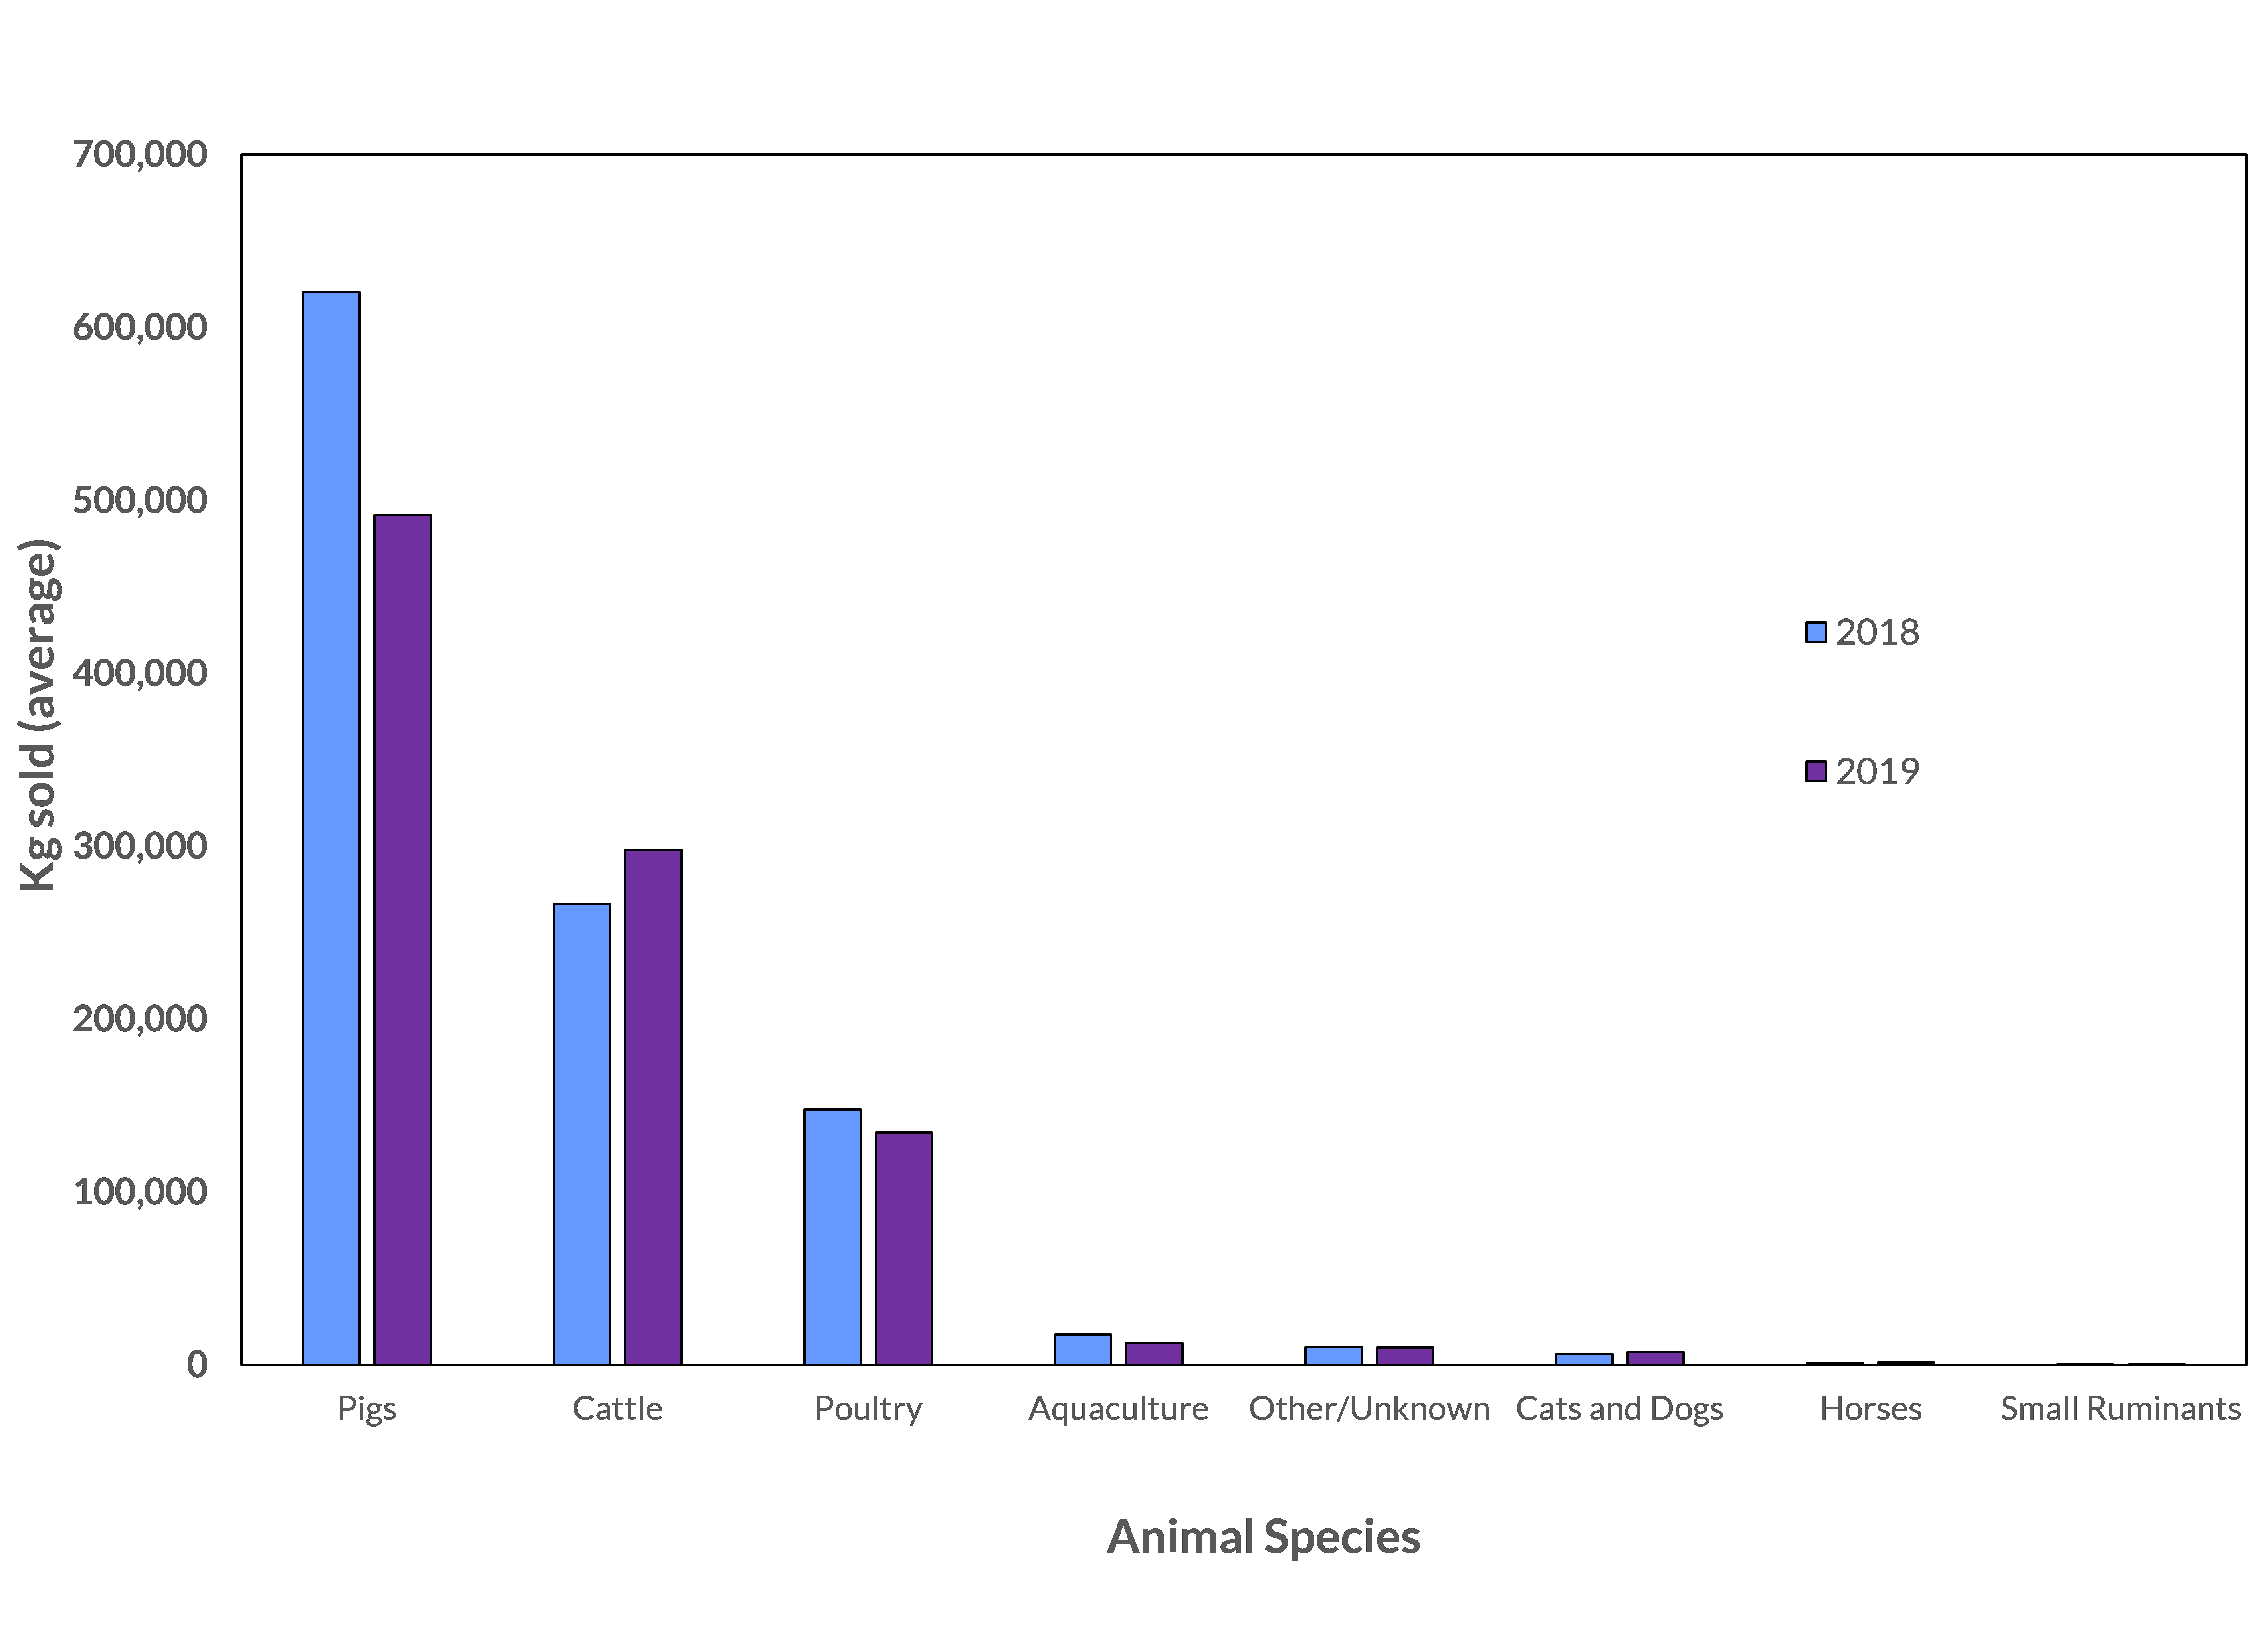
Figure 1 - Text description
| Animal species | 2018 Average kg | 2019 Average kg |
|---|---|---|
| Aquaculture | 17,596 | 12,507 |
| Beef Cattle | 233,488 | 264,673 |
| Cats and Dogs | 6,373 | 7,526 |
| Dairy Cattle | 16,511 | 18,964 |
| Horses | 1,236 | 1,504 |
| Other Animals/Unknown | 10,274 | 10,093 |
| Pigs | 620,355 | 491,640 |
| Poultry | 147,853 | 134,351 |
| Small Ruminants | 43 | 68 |
| Veal Calves | 16,344 | 14,173 |
Adjusting for the number of animals and their weights (i.e., mg/PCU where 1 PCU = 1kg animal), the majority of sales in 2019 were intended for use in pigs, poultry, cattle, and aquaculture.
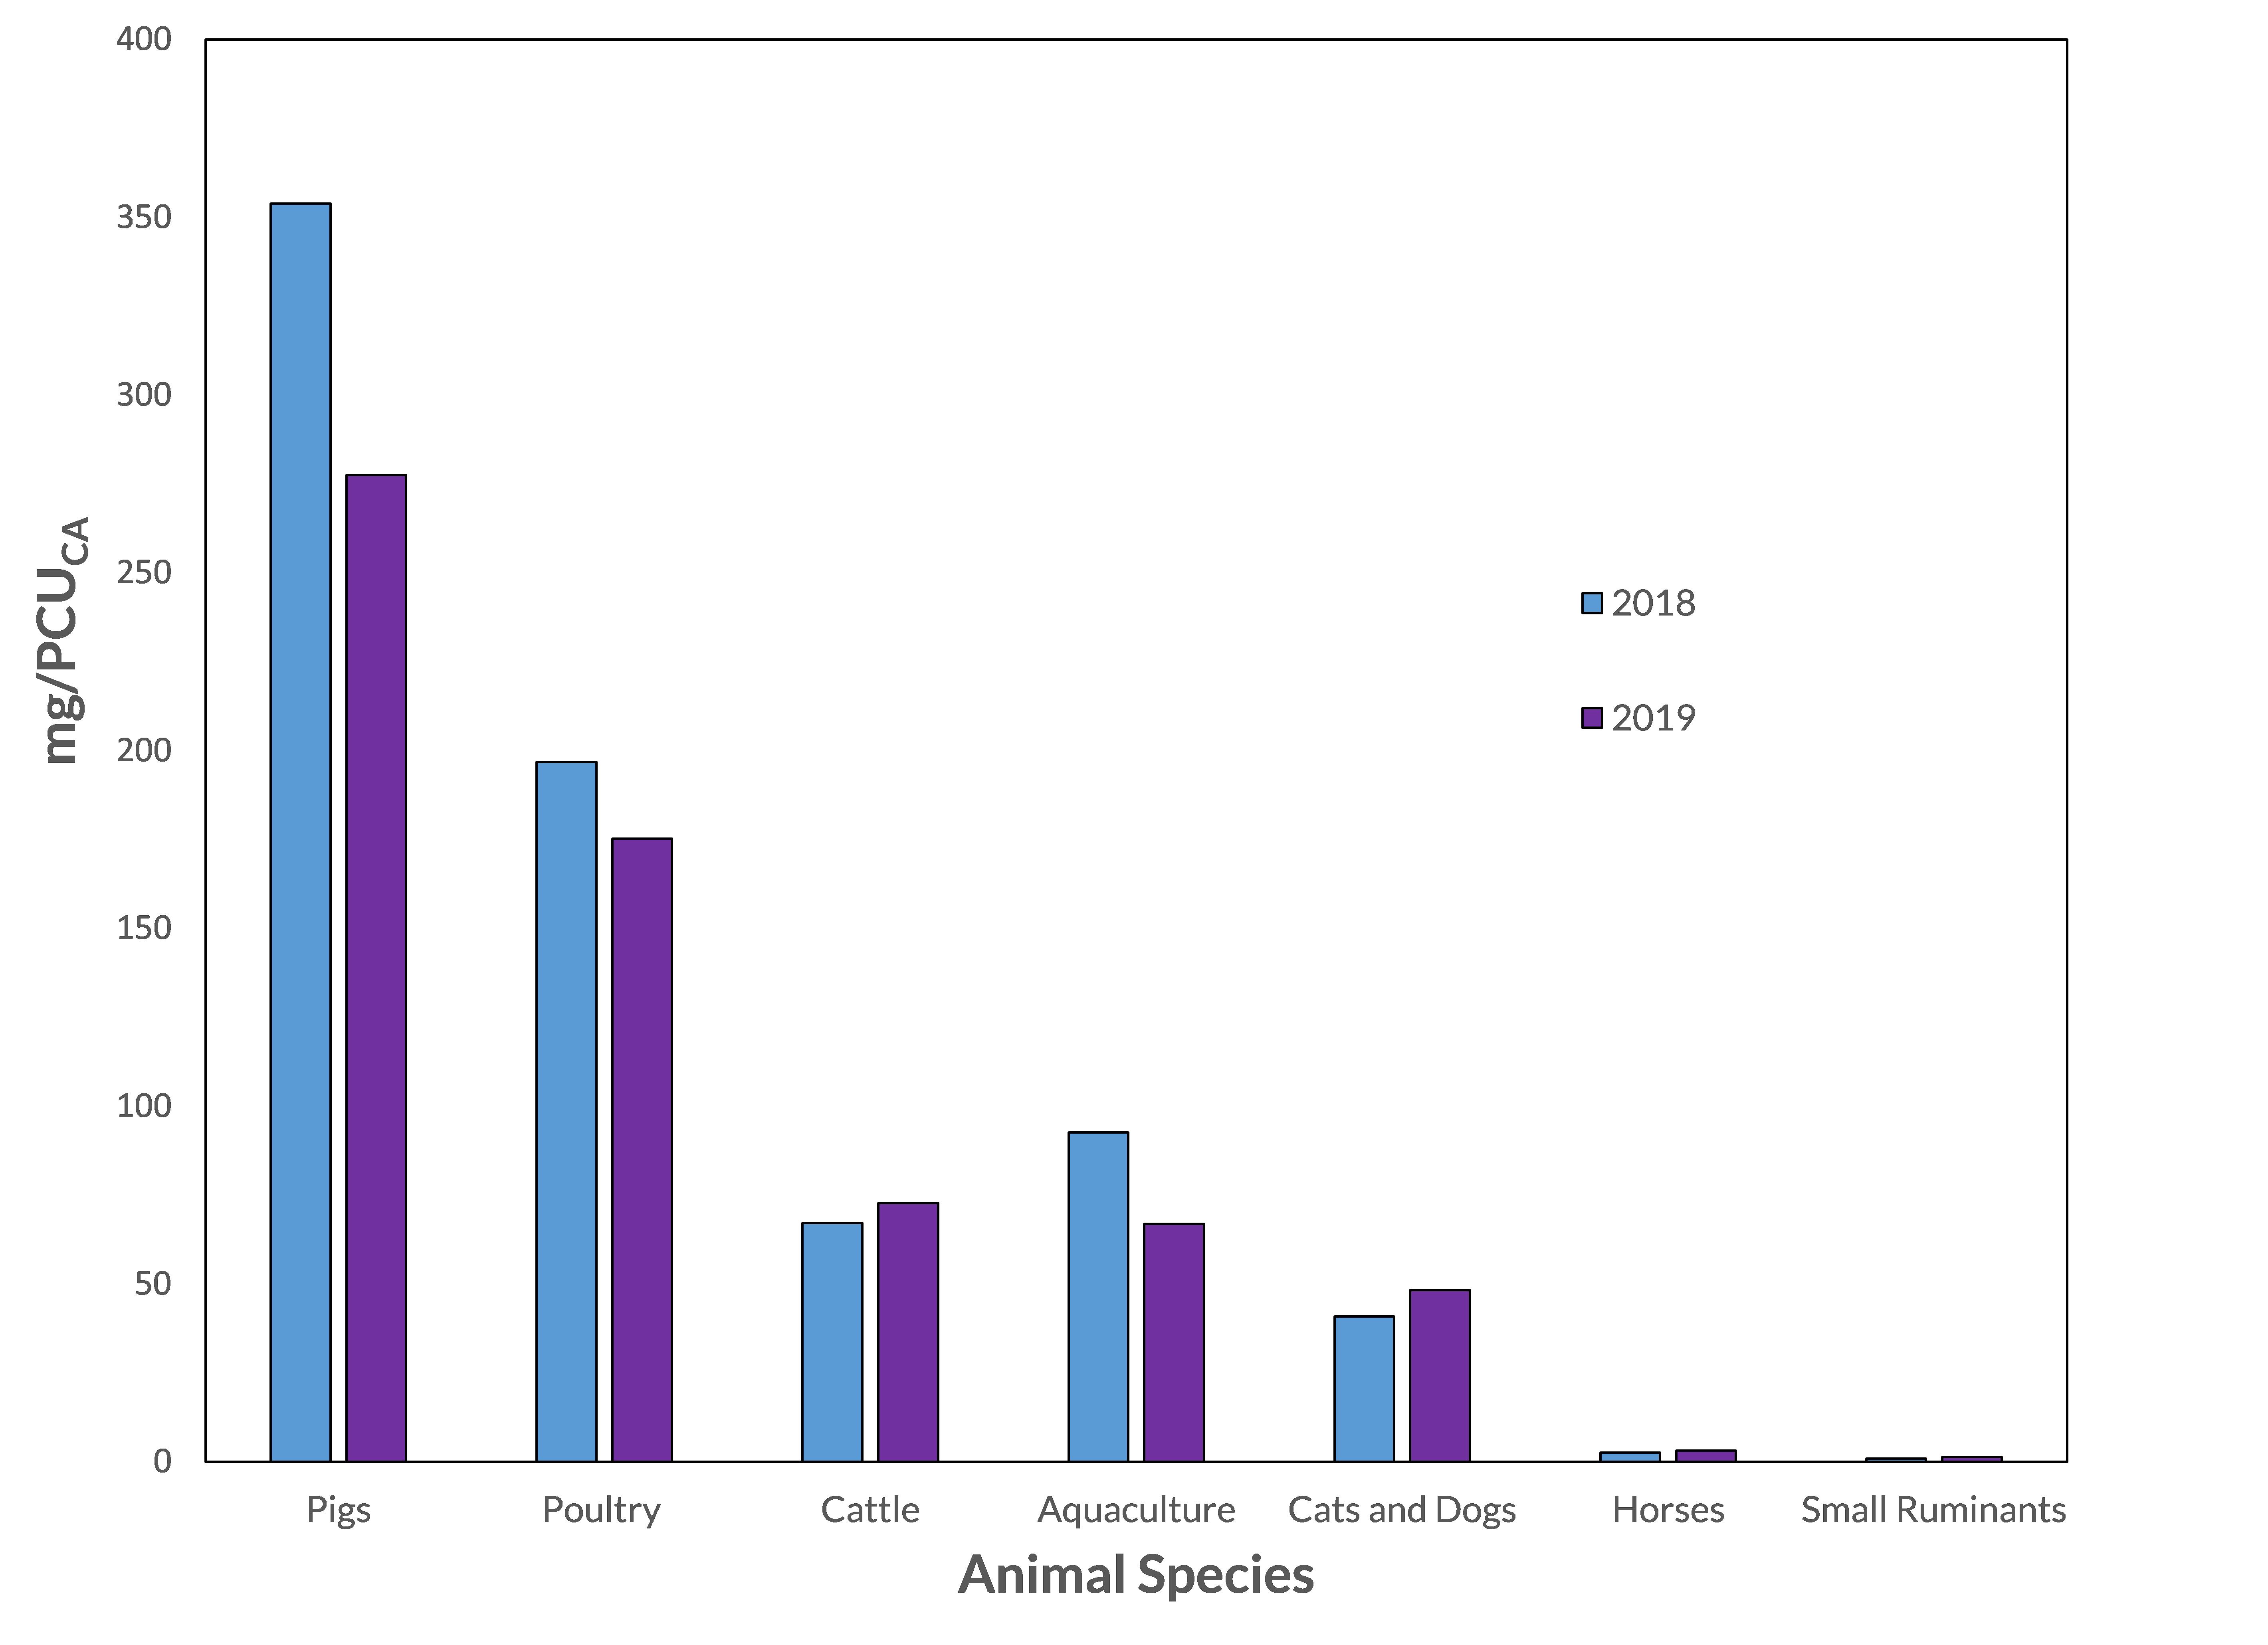
Figure 2 - Text description
| Animal species | 2018 mg/PCUCA | 2019 mg/PCUCA |
|---|---|---|
| Aquaculture | 93 | 67 |
| Cattle | 67 | 73 |
| Cats and Dogs | 41 | 48 |
| Horses | 2.57 | 3 |
| Pigs | 354 | 278 |
| Poultry | 197 | 175 |
| Small Ruminants | 0.79 | 1 |
The total quantities of antimicrobials sold by manufacturers and importers for use in production animals decreased by 11% between 2018 and 2019. When the total quantities were adjusted for biomass (mg/PCU), the decrease was 12% compared to 2018.
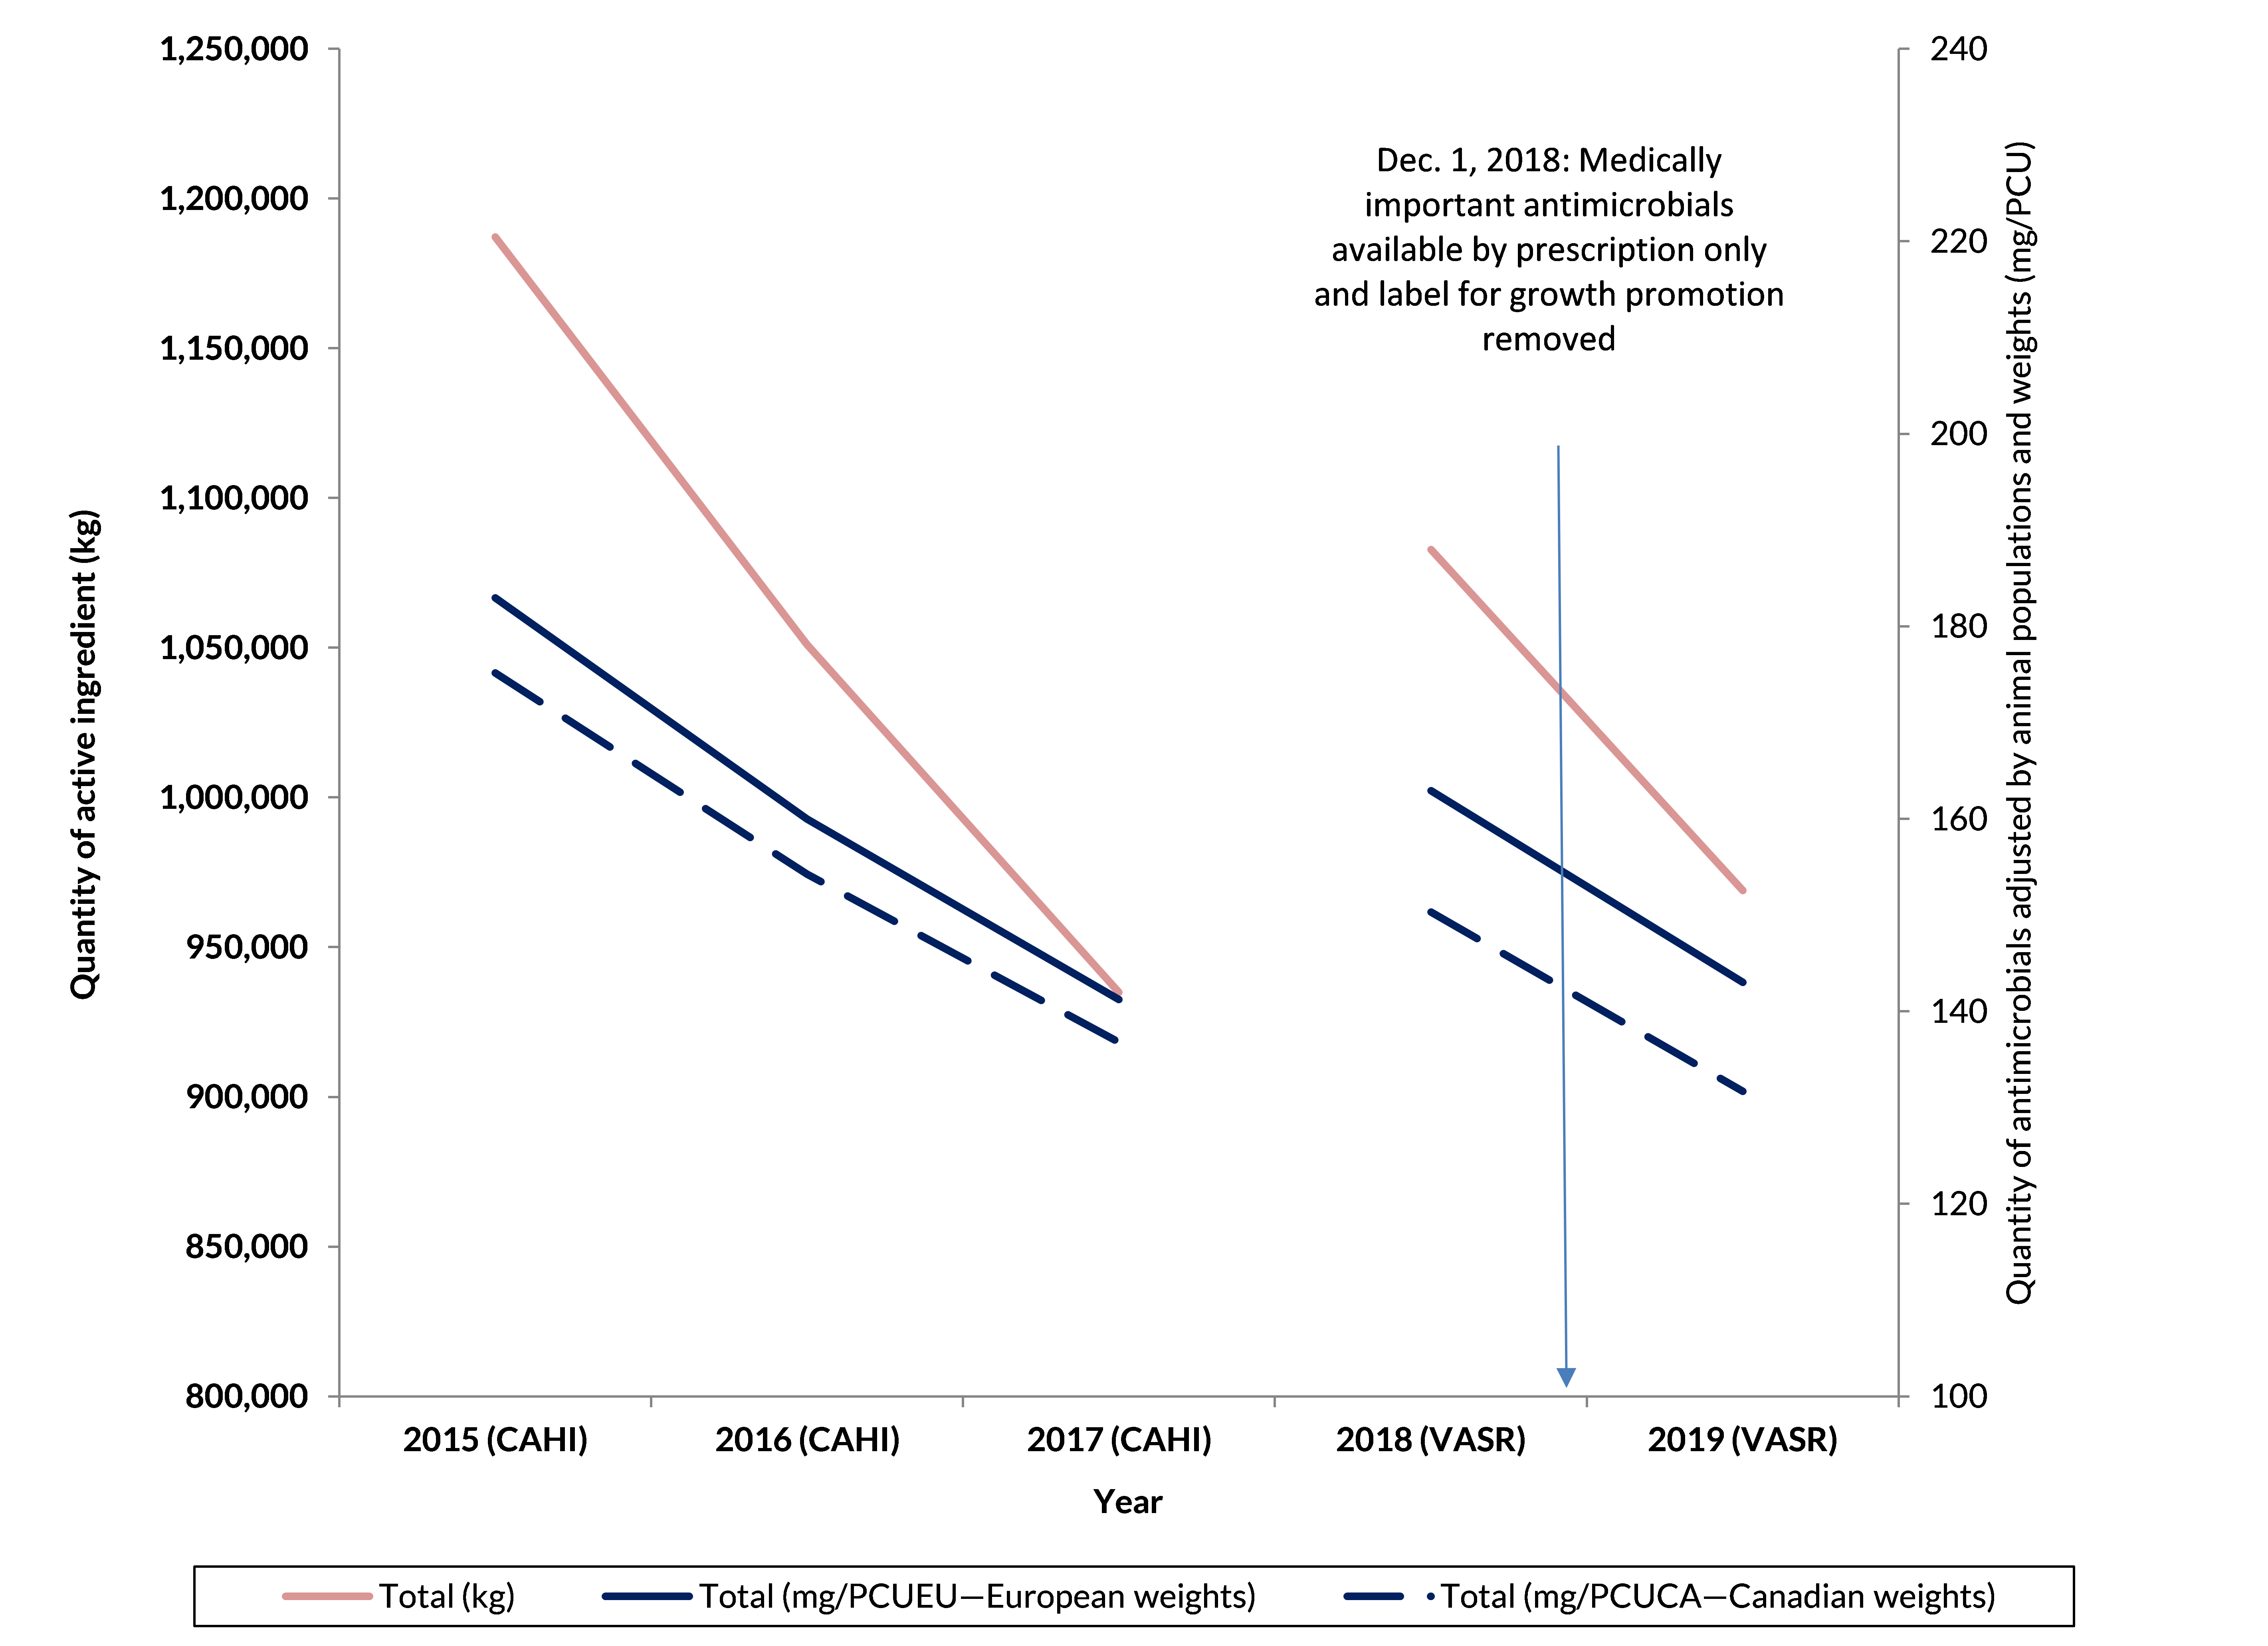
Figure 3 - Text description
| Year | Total (kg) | Total (mg/PCU European weights) | Total (mg/PCU Canadian weights) |
|---|---|---|---|
| 2015 (CAHI) | 1,187,136 | 183 | 175 |
| 2016 (CAHI) | 1,051,010 | 160 | 154 |
| 2017 (CAHI) | 934,873 | 141 | 137 |
| 2018 (VASR) | 1,082,768 | 163 | 150 |
| 2019 (VASR) | 968,985 | 143 | 132 |
The data for 2015 to 2017 were provided voluntarily by the Canadian Animal Health Institute (CAHI) and represented information from their members. The data for 2018 and 2019 were from VASR and incorporated importers and more manufacturers than CAHI. Caution should be taken when comparing information between these two datasets.
Canada is the 8th highest country (in comparison to Europe) for quantities of antimicrobials sold (mg/PCU).

Figure 4 - Text description
| European Countries (2018) | mg/PCU | Canada (2019) European weights | Median (of EU countries) | Canada (2019) Canadian weights |
|---|---|---|---|---|
| Austria | 50 | 143 | 57 | 132 |
| Belgium | 113 | 143 | 57 | 132 |
| Bulgaria | 120 | 143 | 57 | 132 |
| Croatia | 67 | 143 | 57 | 132 |
| Cyprus | 466 | 143 | 57 | 132 |
| Czechia | 57 | 143 | 57 | 132 |
| Denmark | 38 | 143 | 57 | 132 |
| Estonia | 53 | 143 | 57 | 132 |
| Finland | 19 | 143 | 57 | 132 |
| France | 64 | 143 | 57 | 132 |
| Germany | 88 | 143 | 57 | 132 |
| Greece | 91 | 143 | 57 | 132 |
| Hungary | 181 | 143 | 57 | 132 |
| Iceland | 5 | 143 | 57 | 132 |
| Ireland | 46 | 143 | 57 | 132 |
| Italy | 244 | 143 | 57 | 132 |
| Latvia | 36 | 143 | 57 | 132 |
| Lithuania | 33 | 143 | 57 | 132 |
| Luxembourg | 34 | 143 | 57 | 132 |
| Malta | 151 | 143 | 57 | 132 |
| Netherlands | 58 | 143 | 57 | 132 |
| Norway | 3 | 143 | 57 | 132 |
| Poland | 167 | 143 | 57 | 132 |
| Portugal | 187 | 143 | 57 | 132 |
| Romania | 83 | 143 | 57 | 132 |
| Slovakia | 49 | 143 | 57 | 132 |
| Slovenia | 43 | 143 | 57 | 132 |
| Spain | 219 | 143 | 57 | 132 |
| Sweden | 13 | 143 | 57 | 132 |
| Switzerland | 40 | 143 | 57 | 132 |
| United Kingdom | 30 | 143 | 57 | 132 |
This figure assumes that the data are comparable between countries.
ESVAC denominator does not include beef cows, whereas in Canada beef cows are a significant population and are included.
PCU=population correction unit.
Data Sources: Agriculture and Agri-Food Canada, Canadian Animal Health Institute (CAHI), Canadian Hatching Egg Producers, Canfax, Chicken Farmers of Canada, Egg Farmers of Canada, ESVAC, Equestrian Canada, Fisheries and Oceans Canada, Health Canada's Pest Management Regulatory Agency, human pharmacy and hospital data from IQVIA via the Canadian Antimicrobial Resistance Surveillance System, Statistics Canada, and VASR.
Similar antimicrobials were licensed for use in humans and animals; however, some antimicrobial classes were sold more for use in humans than animals and vice-versa.

Figure 5 - Text description
| Antimicrobial Class | Human data (Kg active ingredient) | Animal Sales Data (Kg active ingredient) |
|---|---|---|
| Carbapenems | 1,096 | 0 |
| Fluoroquinolones | 16,577 | 937 |
| Cephalosporins (3rd generation and higher) | 5,864 | 1,676 |
| Cephalosporins (1st and 2nd generation) | 44,894 | 3,234 |
| Aminoglycosides | 168 | 6,487 |
| Lincosamides | 6,514 | 46,390 |
| Sulfonamides (including trimethoprim) | 19,827 | 78,962 |
| Macrolides | 14,074 | 115,822 |
| Penicillins | 138,391 | 93,843 |
| Others | 14,108 | 134,044 |
| Tetracyclines | 8,328 | 495,116 |
Notes:
- Cephalosporins are β-lactam antimicrobials, but we are displaying them separately for visualization purposes.
- Others for humans includes: bacitracin, ceftobiprole medocaril, ceftolozane-tazobactam, chloramphenicol, colistin, daptomycin, fidaxomicin, fosfomycin, fusidic acid, linezolid, metronidazole, nitrofurantoin, and vancomycin.
- Others for animals includes: aminocoumarins, aminocyclitols, amphenicols, cyclic polypeptides, fusidic acid, glycopeptides, nitrofurantoins, nitroimidazoles, orthosomycins, phosphonic acid derivatives, pleuromutilins, polymyxins, pseudomonic acids, streptogramins, and therapeutic agents for tuberculosis.
Antimicrobial use: Comparison of farm data
Comparison of antimicrobial classes*
There are important differences in the types and relative quantities of antimicrobials reported for use between food animal species, which is why we need ongoing surveillance across the food animal species.
*The percentages are based on total kilograms of active ingredients intended for use in that host species.
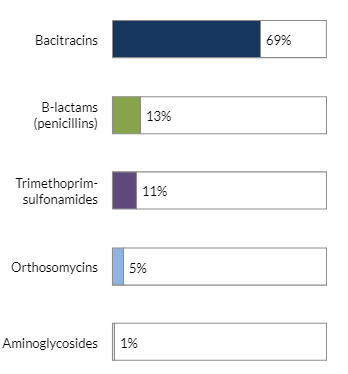
Figure 6 - Text description
| Broiler chickens | |
|---|---|
| Antimicrobial Class | % |
| Bacitracins | 69% |
| B-lactams (penicillins) | 13% |
| Trimethoprim-sulfonamides | 11% |
| Orthosomycins | 5% |
| Aminoglycosides | 1% |
Not shown: flavophospholipids (<1%), lincosamides-aminocyclitols (<1%), streptogramins (1%).
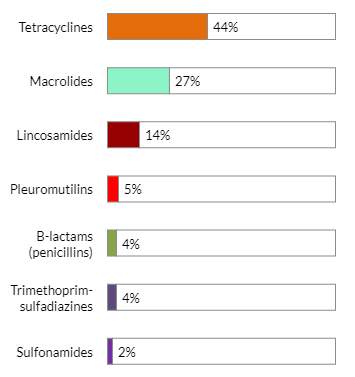
Figure 7 - Text description
| Grower-finisher pigs | |
|---|---|
| Antimicrobial Class | % |
| Tetracyclines | 44% |
| Macrolides | 27% |
| Lincosamides | 14% |
| Pleuromutilins | 5% |
| B-lactams (penicillins) | 4% |
| Trimethoprim-sulfadiazines | 4% |
| Sulfonamides | 2% |
Not shown: 3rd generation cephalosporins (<1%), streptogramins (1%), flavophospholipids (<1%).
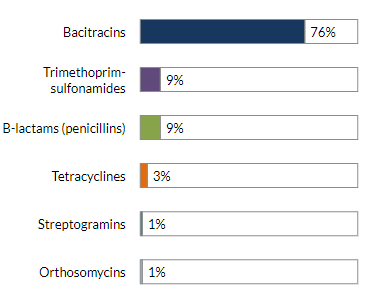
Figure 8 - Text description
| Turkeys | |
|---|---|
| Antimicrobial Class | % |
| Bacitracins | 76% |
| Trimethoprim-sulfonamides | 9% |
| B-lactams (penicillins) | 9% |
| Tetracyclines | 3% |
| Streptogramins | 1% |
| Orthosomycins | 1% |
Not shown: fluoroquinolones (<1%), aminoglycosides (<1%), flavophospholipids (<1%).
Integrated antimicrobial use and resistance - Farm data
In this section, we highlight farm integrated antimicrobial use and resistance stories for 2019:
- Reasons for antimicrobial use
- Broiler chickens
- Grower-finisher pigs
- Turkeys
Reasons for antimicrobial use
- Most antimicrobial drug use was for disease prevention when adjusting for either dose, or number and weight of animals (≥ 74%).
- Across all 3 species, AMU was primarily for prevention of enteric diseases.
- Antimicrobials were predominantly administered in feed (≥ 90%).
- The proportion of antimicrobials used for disease treatment increased across all 3 species.
- Poultry: this use was primarily for diseases in young chicks/poults and for respiratory diseases (feed and water).
- Grower-finisher pigs: this use was primarily for treating respiratory diseases (water).
- In 2019, bambermycins were used for the prevention of necrotic enteritis in 4% to 5% of sentinel poultry flocks. The reported inclusion rate in feed was stable and similar to label claims for growth promotion.
- Grower-finisher pigs: continued reported use of medically-important antimicrobials for growth promotion; however, the quantity of use markedly decreased compared to 2018 (1 farm).
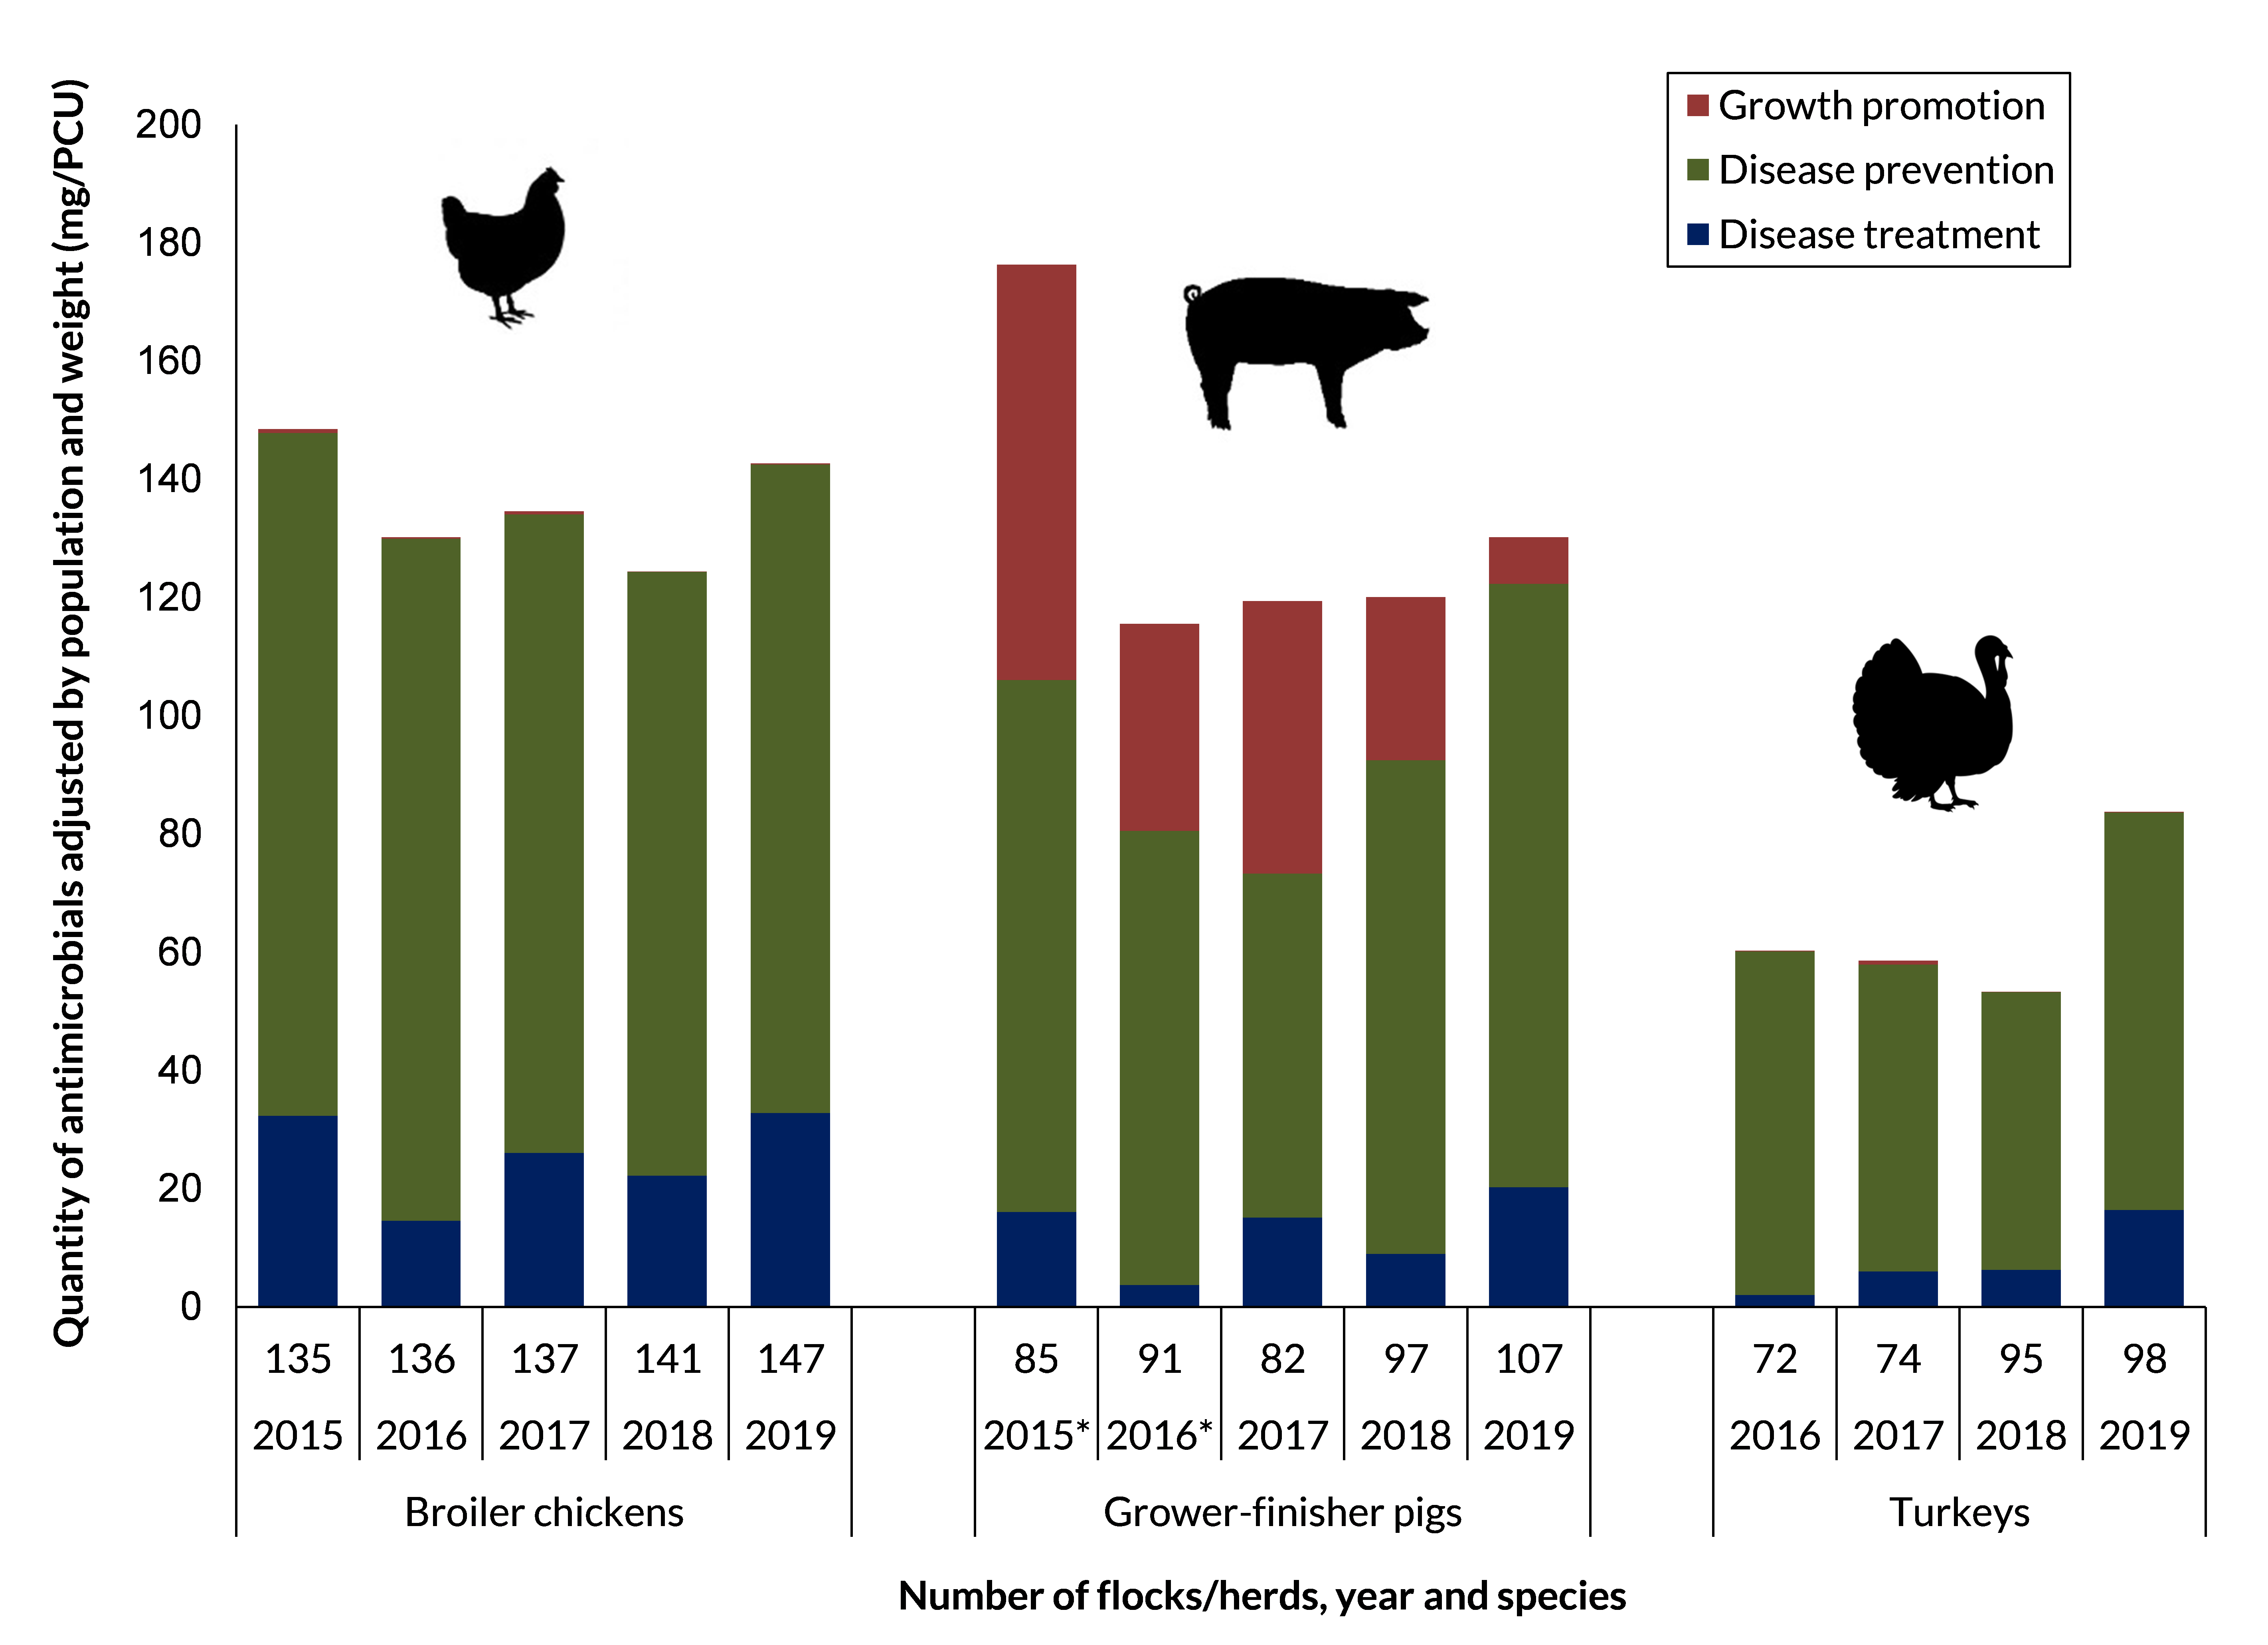
Figure 9 - Text description
| Species | Broiler chickens | Grower-finisher pigs | Turkeys | |||||||||||
|---|---|---|---|---|---|---|---|---|---|---|---|---|---|---|
| Year | 2015 | 2016 | 2017 | 2018 | 2019 | 2015* | 2016* | 2017 | 2018 | 2019 | 2016 | 2017 | 2018 | 2019 |
| Number of farms | 135 | 136 | 137 | 141 | 147 | 85 | 91 | 82 | 97 | 107 | 72 | 74 | 95 | 98 |
| Disease treatment | 32 | 15 | 26 | 22 | 33 | 16 | 4 | 15 | 9 | 20 | 2 | 6 | 6 | 16 |
| Disease prevention | 115 | 115 | 108 | 102 | 110 | 90 | 77 | 58 | 84 | 102 | 58 | 52 | 47 | 67 |
| Growth promotion | 1 | 0 | 0 | 0 | 0 | 70 | 35 | 46 | 28 | 8 | 0 | 1 | 0 | 0 |
*Grower-finisher pigs: 2015 and 2016 data were for antimicrobial use in feed only.
Broiler chickens
- Nationally, antimicrobial use (AMU)* decreased in 2019** compared with 2018.
- Notable increase in Salmonella isolates resistant to ≥ 1 antimicrobial classes tested.
- No remarkable changes in antimicrobial resistance (AMR) to ceftriaxone, nalidixic acid, though an increase in ciprofloxacin resistance.
- Resistance to ≥3 antimicrobial classes varied.
- AMU decreased and AMR varied; however, flock mortality was unchanged.
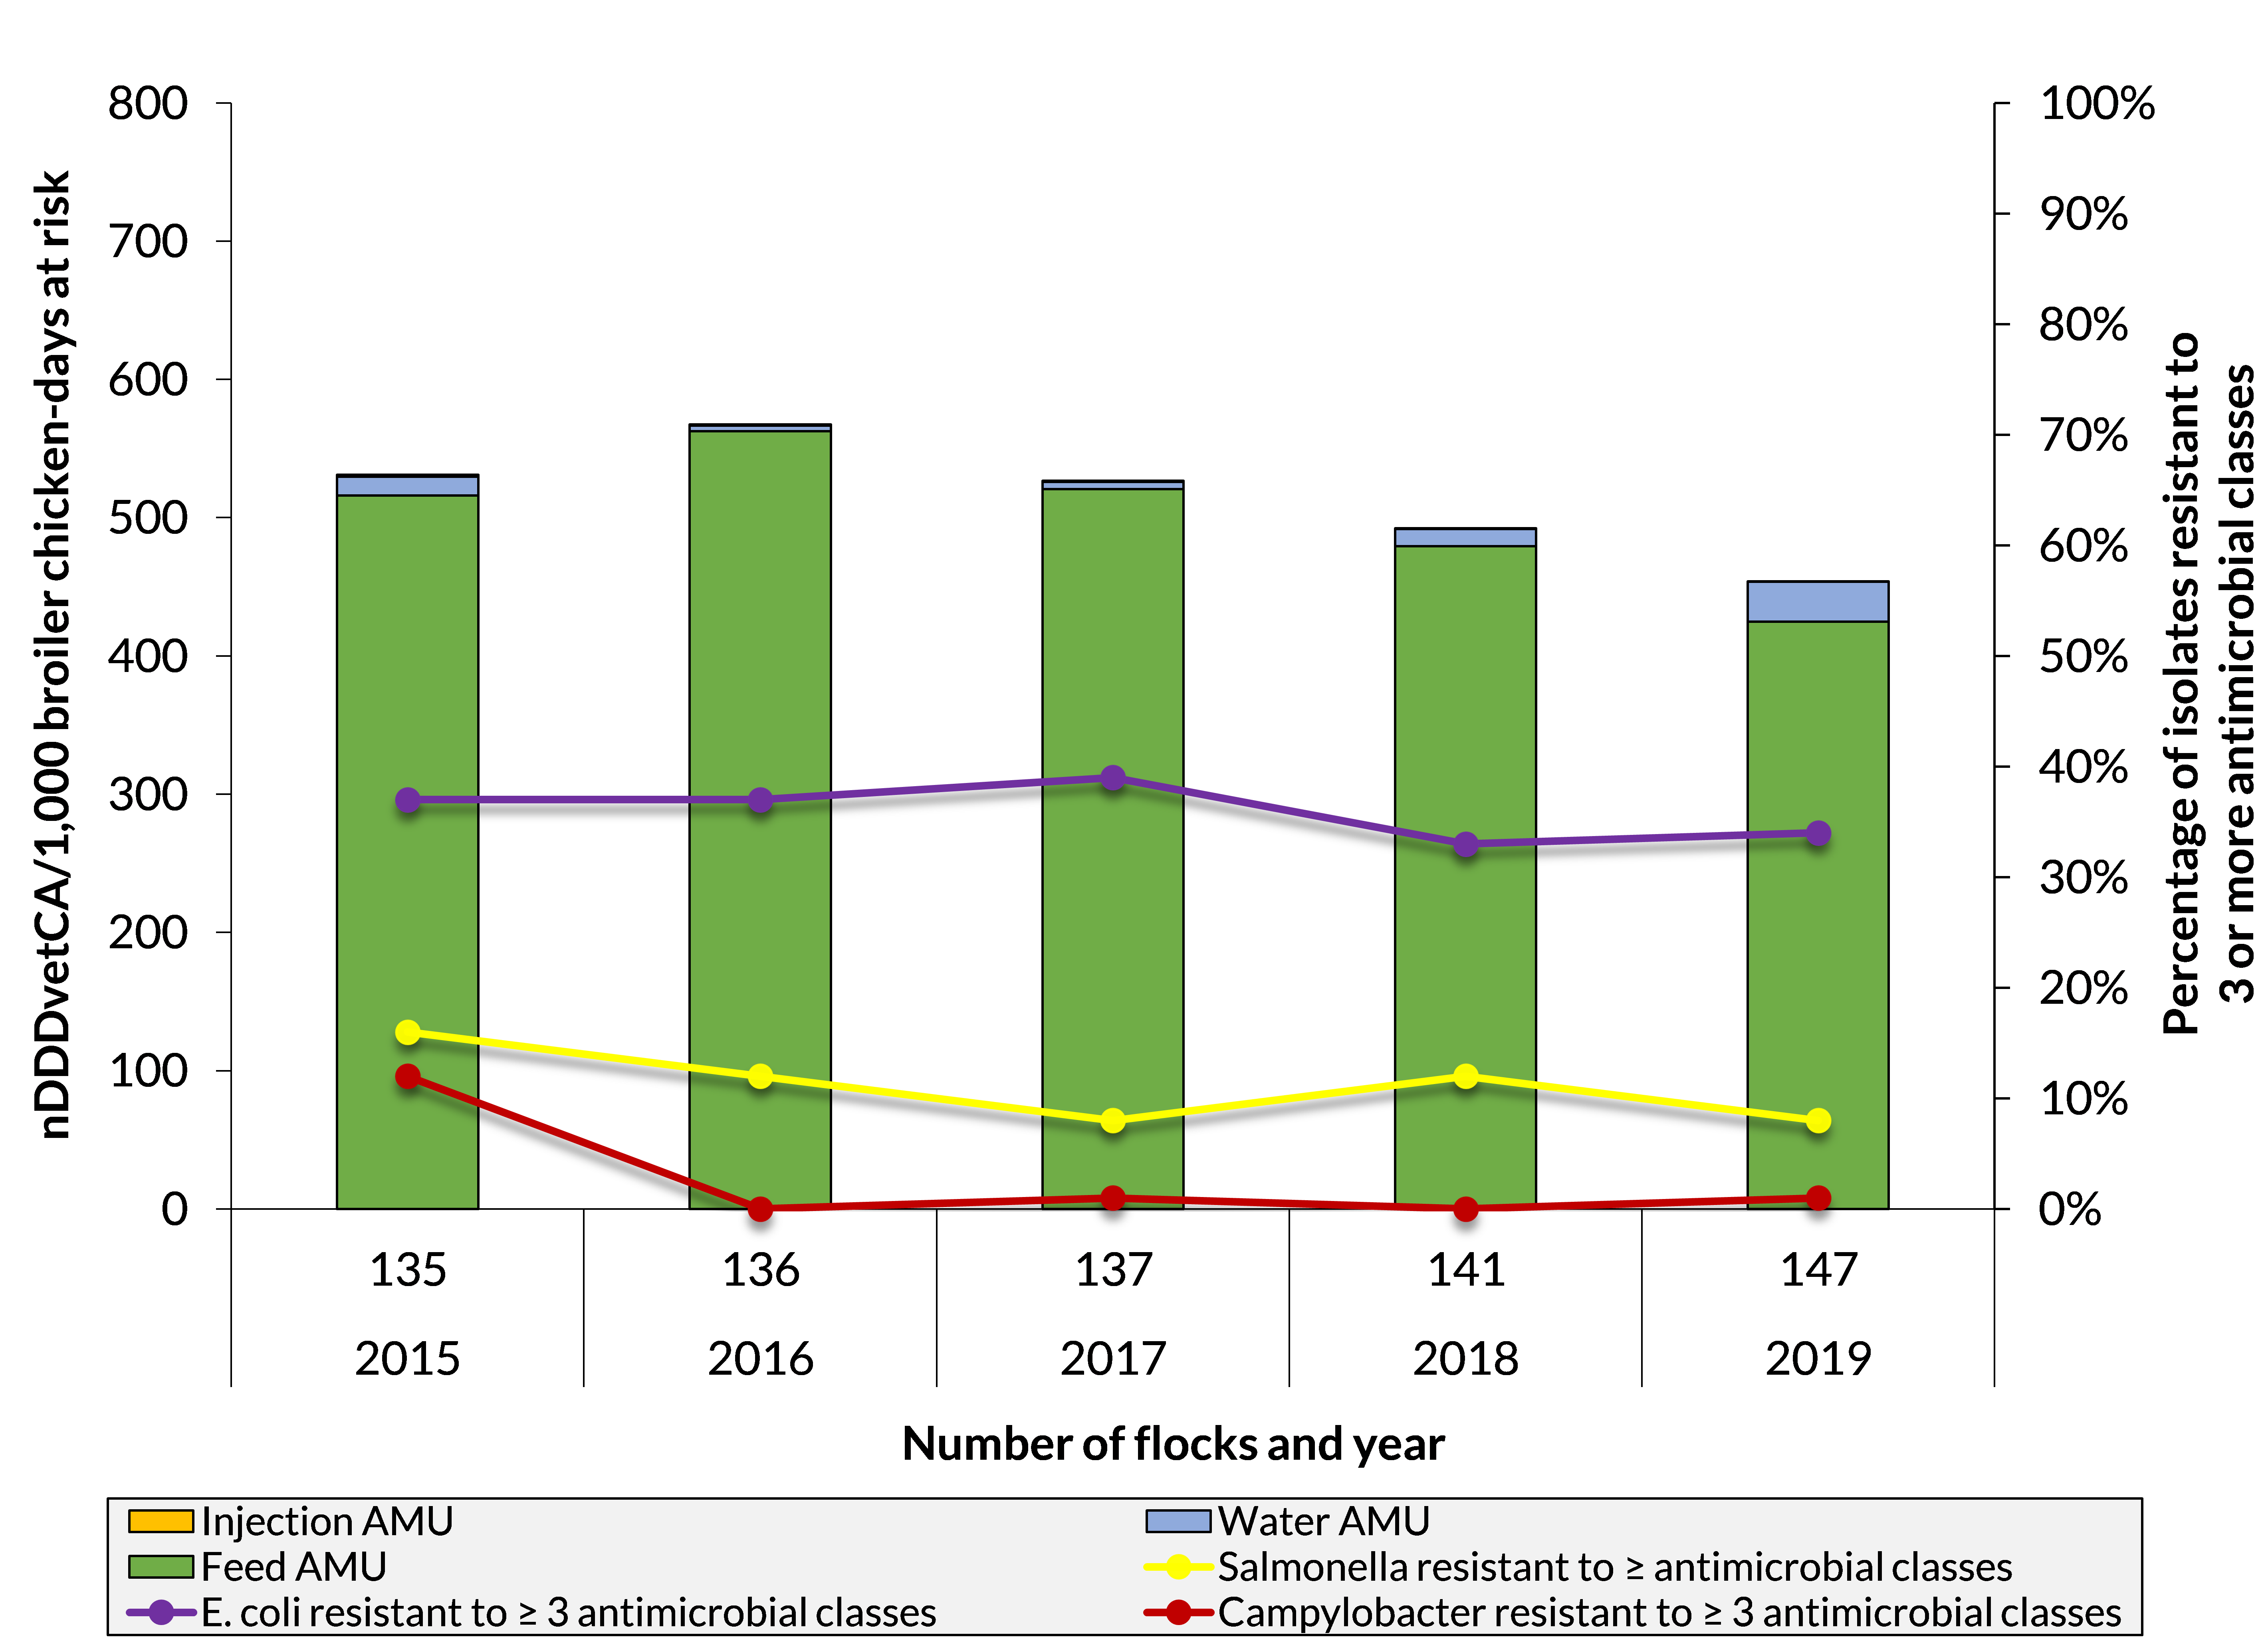
Figure 10 - Text description
| Year | 2015 | 2016 | 2017 | 2018 | 2019 |
|---|---|---|---|---|---|
| Number of flocks | 135 | 136 | 137 | 141 | 147 |
| Feed AMU | 516 | 563 | 521 | 479 | 425 |
| Water AMU | 14 | 4 | 5 | 13 | 29 |
| Injection AMU | 1 | 1 | 1 | 1 | 0 |
| Salmonella resistant to ≥ 3 antimicrobial classes | 16% | 12% | 8% | 12% | 8% |
| E. coli resistant to ≥ 3 antimicrobial classes | 37% | 37% | 39% | 33% | 34% |
| Campylobacter resistant to ≥ 3 antimicrobial classes | 12% | 0% | 1% | 0% | 1% |

Table 1 - Text description
| Bacteria or health indicator | Resistance information | 2017 | 2018 | 2019 | Comparing 2018 to 2019 |
|---|---|---|---|---|---|
| Salmonella | Number of isolates | 263 | 282 | 314 | no data |
| Ceftriaxone | 4% | 13% | 8% | -5% | |
| Nalidixic acid/ciprofloxacin | 0%/0% | 3%/0% | 1%/0% | -3%/0% | |
| Resistant to ≥ 1 classes | 43% | 49% | 63% | +14% | |
| E. coli | Number of isolates | 539 | 547 | 547 | no data |
| Ceftriaxone | 10% | 7% | 7% | 0% | |
| Nalidixic acid/ciprofloxacin | 5%/1% | 10%/<1% | 8%/<1% | -2%/-<1% | |
| Resistant to ≥ 1 classes | 72% | 68% | 69% | +1% | |
| Campylobacter | Number of isolates | 122 | 122 | 142 | no data |
| Ciprofloxacin | 18% | 12% | 24% | +12% | |
| Resistant to ≥ 1 classes | 48% | 30% | 36% | +6% | |
| Flock health | Mortality | 3.5% | 4.1% | 4.2% | <1% |
Bold numbers are statistically significant.
*Adjusted for daily doses.
**First year of the implementation of the broiler chicken sector’s antimicrobial use reduction strategy (step 2).
Grower-finisher pigs
- Nationally, antimicrobial use (AMU)* remained stable in 2019** compared with 2018.
- Proportion of isolates resistant to ≥1 antimicrobials classes is stable or increased slightly.
- Nalidixic acid/ciprofloxacin-resistance is stable or increased slightly.
- Resistance to ≥3 antimicrobial classes increased in Salmonella but decreased in E. coli and Campylobacter.
- AMU remained unchanged, AMR generally decreased and herd mortality was unchanged.
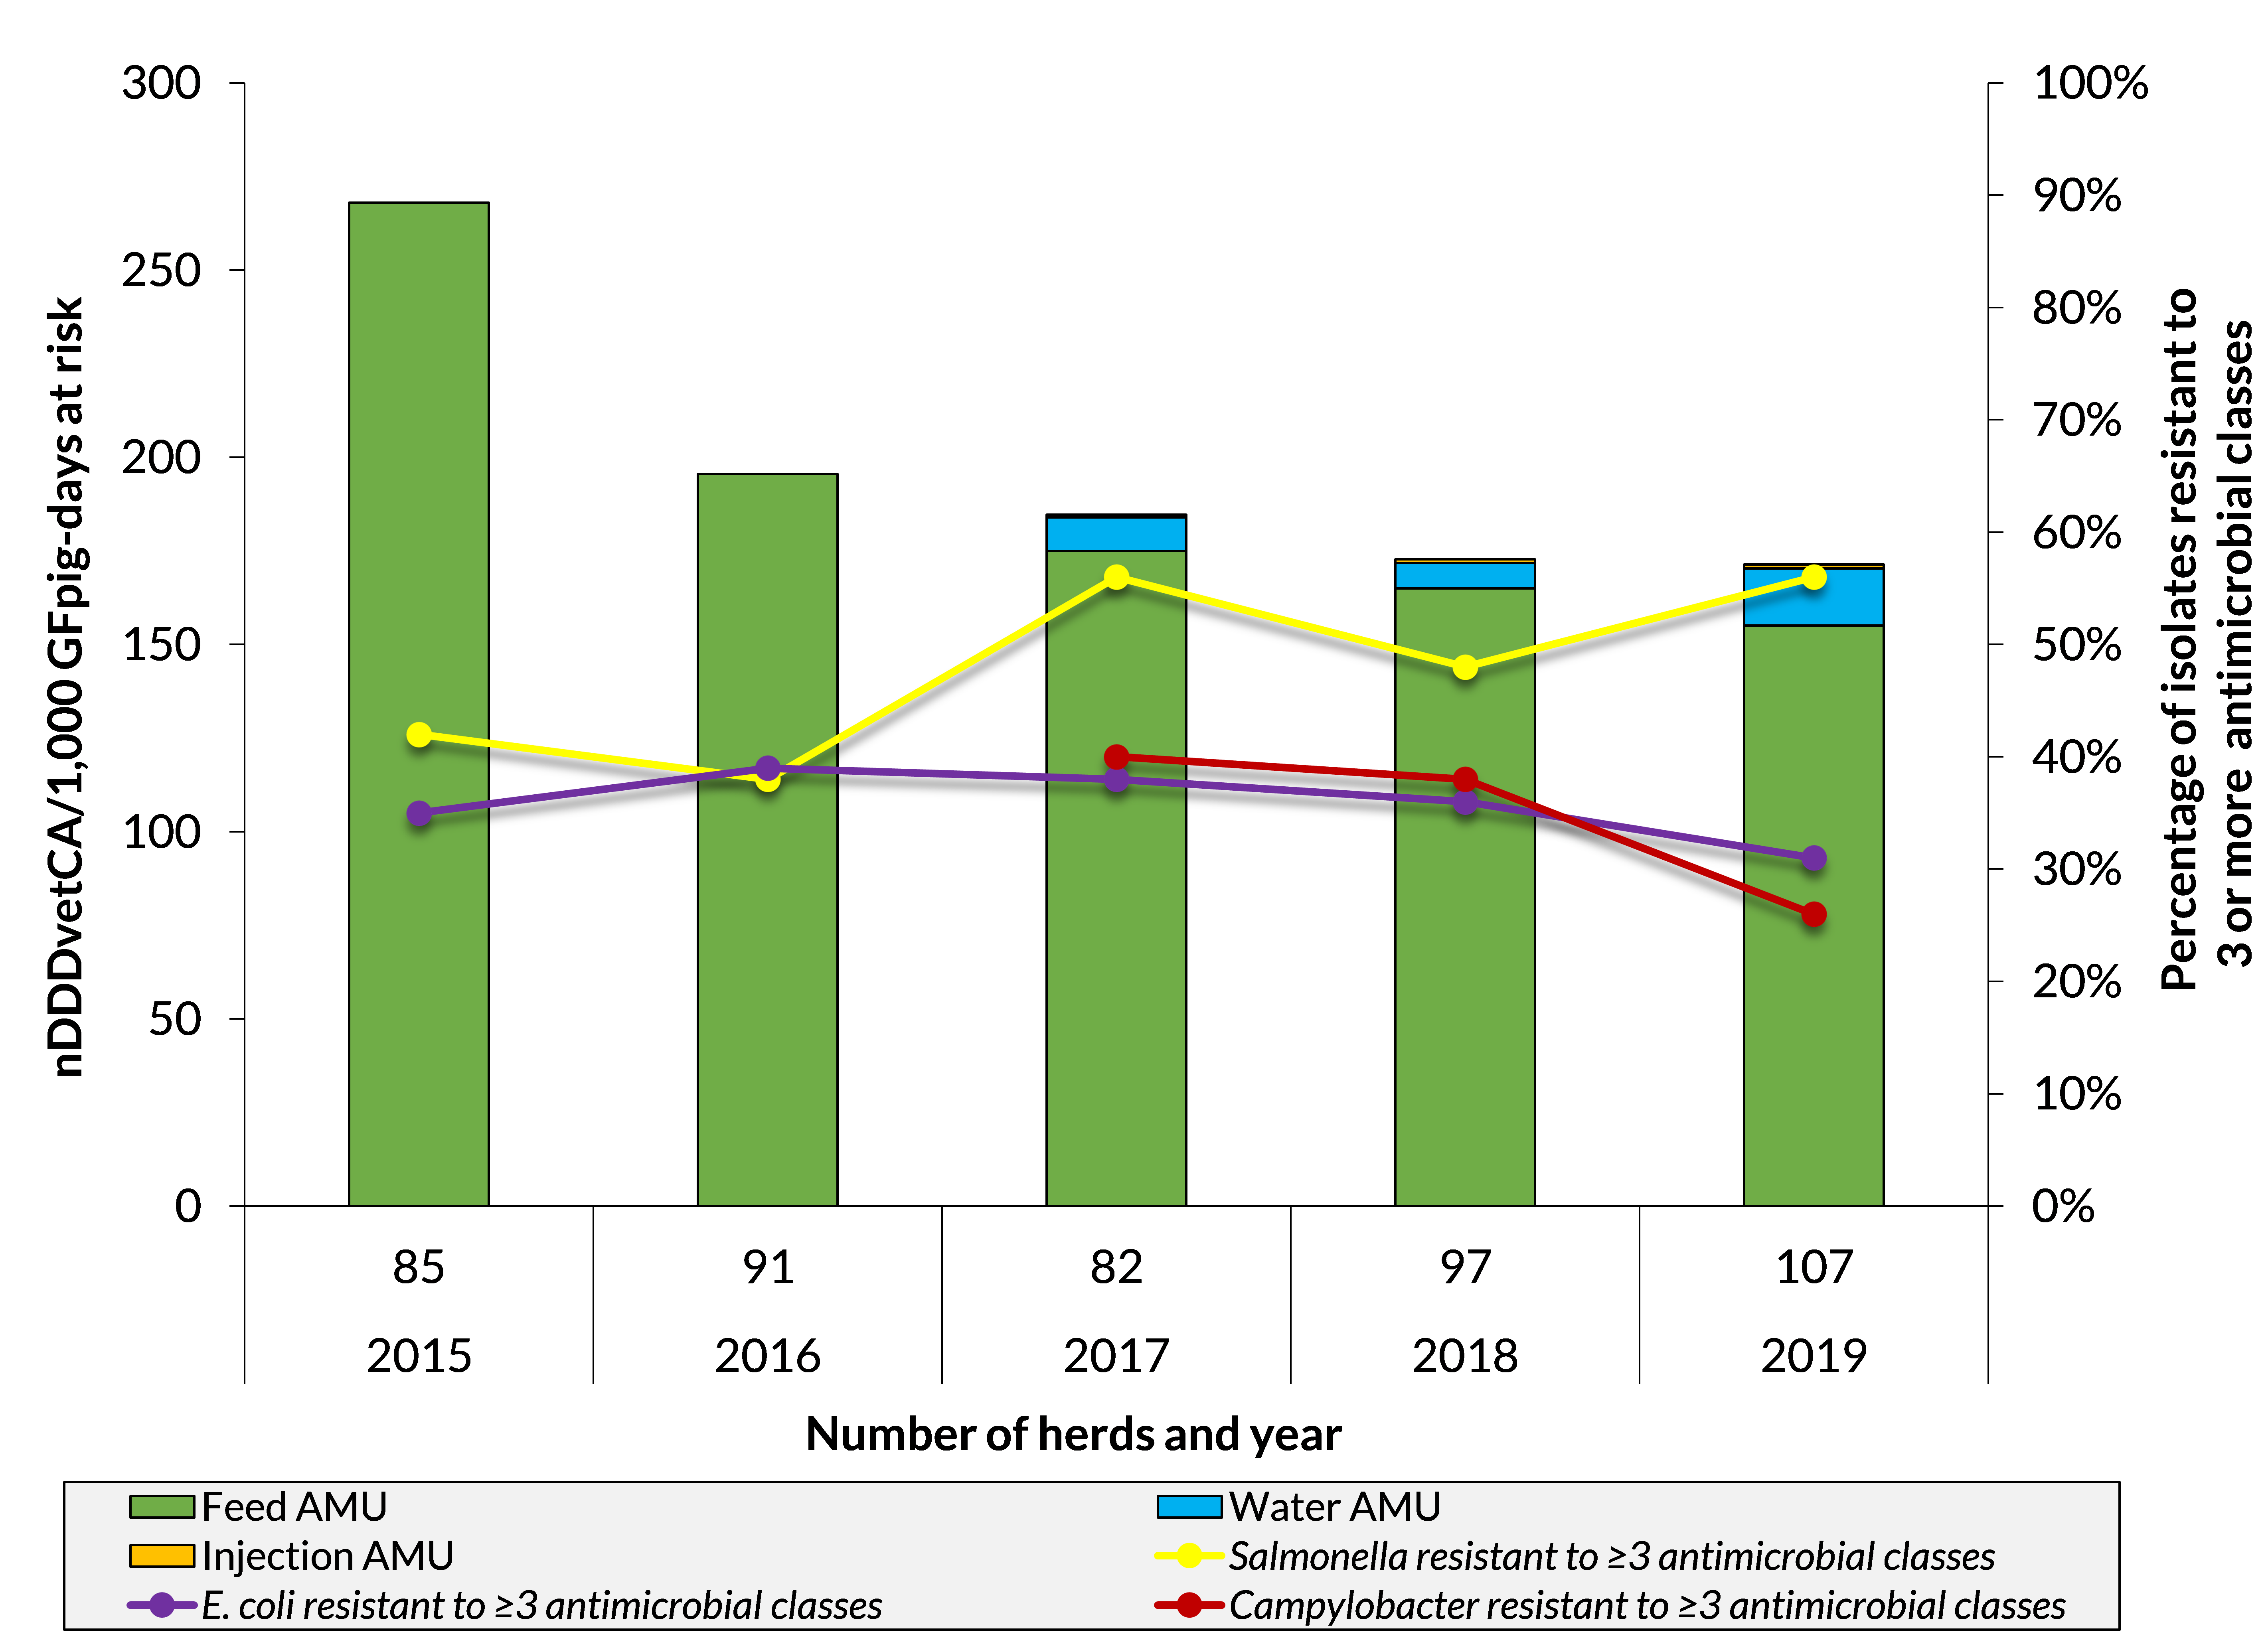
Figure 11 - Text description
| Year | 2015 | 2016 | 2017 | 2018 | 2019 |
|---|---|---|---|---|---|
| Number of herds | 85 | 91 | 82 | 97 | 107 |
| Feed AMU | 268 | 196 | 175 | 165 | 155 |
| Water AMU | no data | no data | 9 | 7 | 15 |
| Injection AMU | no data | no data | 1 | 1 | 1 |
| Salmonella resistant to ≥ 3 antimicrobial classes | 42% | 38% | 56% | 48% | 56% |
| E. coli resistant to ≥ 3 antimicrobial classes | 35% | 39% | 38% | 36% | 31% |
| Campylobacter resistant to ≥ 3 antimicrobial classes | no data | no data | 40% | 38% | 26% |
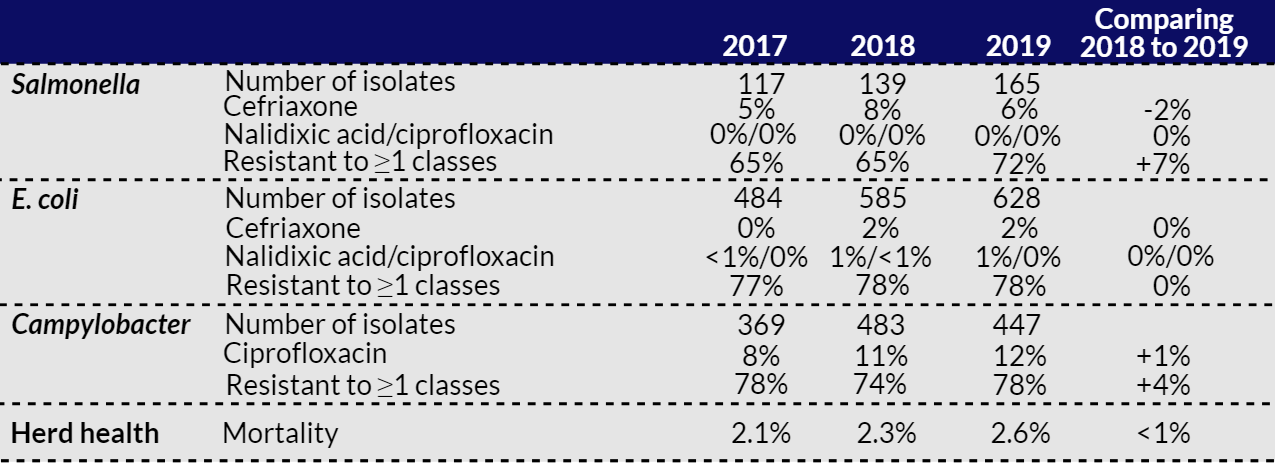
Table 2 - Text description
| Bacteria or health indicator | Resistance information | 2017 | 2018 | 2019 | Comparing 2018 to 2019 |
|---|---|---|---|---|---|
| Salmonella | Number of isolates | 117 | 139 | 165 | no data |
| Ceftriaxone | 5% | 8% | 6% | -2% | |
| Nalidixic acid/ciprofloxacin | 0%/0% | 0%/0% | 0%/0% | 0% | |
| Resistant to ≥ 1 classes | 65% | 65% | 72% | +7% | |
| E. coli | Number of isolates | 484 | 585 | 628 | no data |
| Ceftriaxone | 0% | 2% | 2% | 0% | |
| Nalidixic acid/ciprofloxacin | <1%/0% | 1%/<1% | 1%/0% | 0%/0% | |
| Resistant to ≥ 1 classes | 77% | 78% | 78% | 0% | |
| Campylobacter | Number of isolates | 369 | 483 | 447 | no data |
| Ciprofloxacin | 8% | 11% | 12% | +1% | |
| Resistant to ≥ 1 classes | 78% | 74% | 78% | +4% | |
| Herd health | Mortality | 2.1% | 2.3% | 2.6% | <1% |
*Adjusted for daily doses.
**First year of implementation of the regulatory changes in veterinary antimicrobial use in Canada.
Turkeys
- Nationally, antimicrobial use* decreased in 2019** compared with 2018.
- Notable decrease in Campylobacter isolates resistant to ≥1 antimicrobial classes tested andSalmonella resistant to ≥3 antimicrobial classes tested.
- No remarkable changes in AMR to ceftriaxone, nalidixic acid, or ciprofloxacin.
- Resistance to ≥3 classes of antimicrobials was stable or slightly increased in E. coli and Campylobacter.
- AMU decreased and AMR varied; however, flock mortality was unchanged.
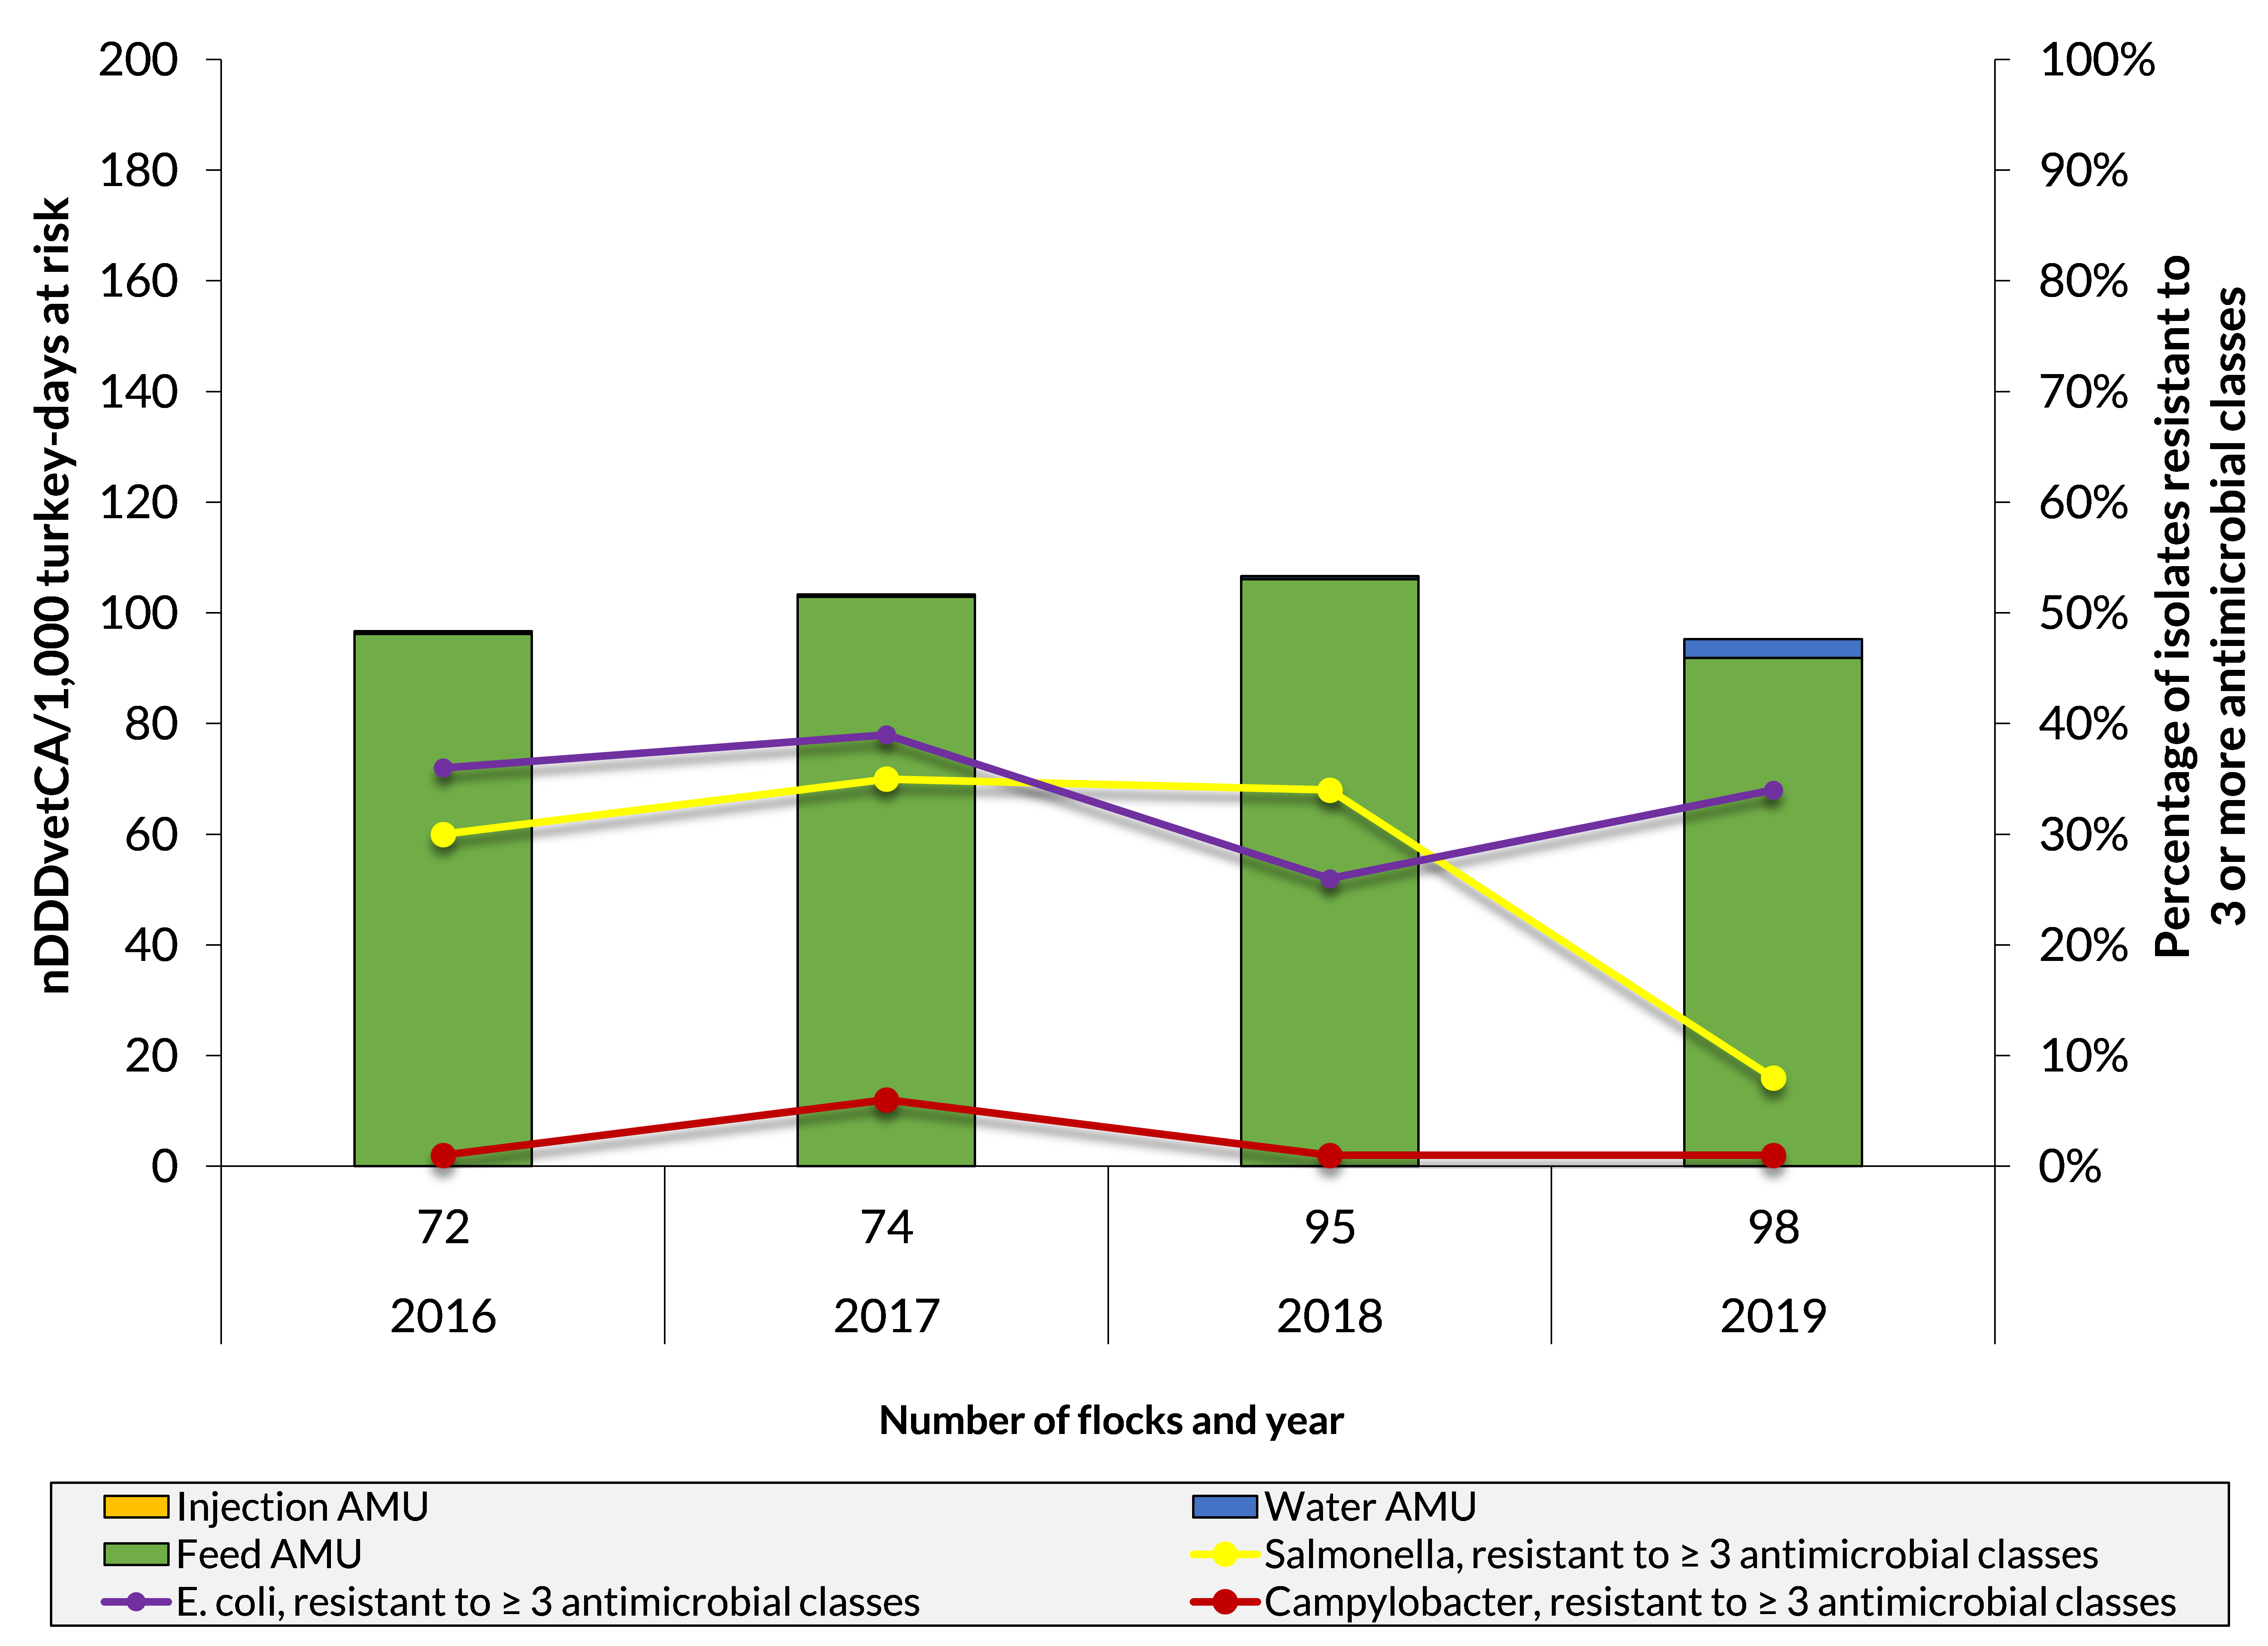
Figure 12 - Text description
| Year | 2016 | 2017 | 2018 | 2019 |
|---|---|---|---|---|
| Number of flocks | 72 | 74 | 95 | 98 |
| Feed AMU | 96 | 103 | 106 | 92 |
| Water AMU | 0 | 0 | 1 | 3 |
| Injection AMU | 0.1 | 0.1 | 0.0 | 0.0 |
| Salmonella resistant to ≥ 3 antimicrobial classes | 30% | 35% | 34% | 8% |
| E. coli resistant to ≥ 3 antimicrobial classes | 36% | 39% | 26% | 34% |
| Campylobacter resistant to ≥ 3 antimicrobial classes | 1% | 6% | 1% | 1% |
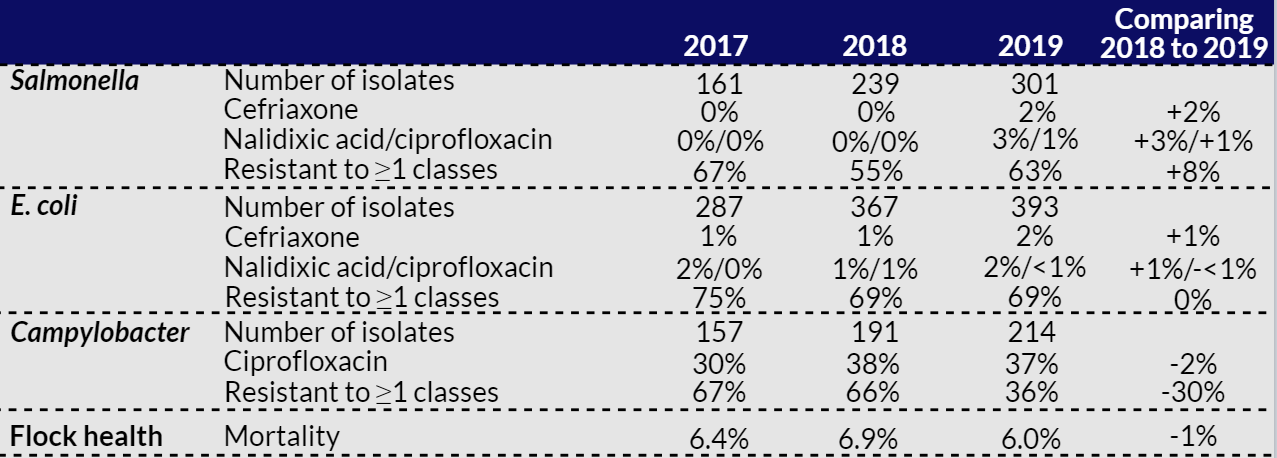
Table 3 - Text description
| Bacteria or health indicator | Resistance information | 2017 | 2018 | 2019 | Comparing 2018 to 2019 |
|---|---|---|---|---|---|
| Salmonella | Number of isolates | 161 | 239 | 301 | no data |
| Ceftriaxone | 0% | 0% | 2% | +2% | |
| Nalidixic acid/ciprofloxacin | 0%/0% | 0%/0% | 3%/1% | +3%/+1% | |
| Resistant to ≥ 1 classes | 67% | 55% | 63% | +8% | |
| E. coli | Number of isolates | 287 | 367 | 393 | no data |
| Ceftriaxone | 1% | 1% | 2% | +1% | |
| Nalidixic acid/ciprofloxacin | 2%/0% | 1%/1% | 2%/<1% | +1%/-<1% | |
| Resistant to ≥ 1 classes | 75% | 69% | 69% | 0% | |
| Campylobacter | Number of isolates | 157 | 191 | 214 | no data |
| Ciprofloxacin | 30% | 38% | 37% | -2% | |
| Resistant to ≥ 1 classes | 67% | 66% | 36% | -30% | |
| Flock health | Mortality | 6.4% | 6.9% | 6.0% | -1% |
*Adjusted for daily doses.
**First year of the implementation of the turkey sector’s antimicrobial use reduction strategy (step 2).
Integrated antimicrobial resistance
In this section, we highlight 4 resistance stories for 2019:
- Nalidixic acid-resistant Salmonella Enteritidis in humans and associated travel.
- The detection of quinolone-resistant Salmonella Enteritidis from chicken(s).
- Salmonella resistant to 6 or 7 antimicrobial classes with an increase in Salmonella from human and agri-food sources.
- The detection of Salmonella Heidelberg from healthy cattle.
Salmonella Enteritidis and quinolone resistance in humans
- Salmonellosis is a nationally notifiable disease in all provinces and territories.
- S. Enteritis is the most common serovar identified in people with salmonellosis.
- Most S. Enteritidis infections are located in the intestines, but can cause serious disease if it moves to the blood stream, other organs or joints.
In 2018 and 2019, S. Enteritidis detection decreased resulting in an overall reduction in cases of salmonellosis.
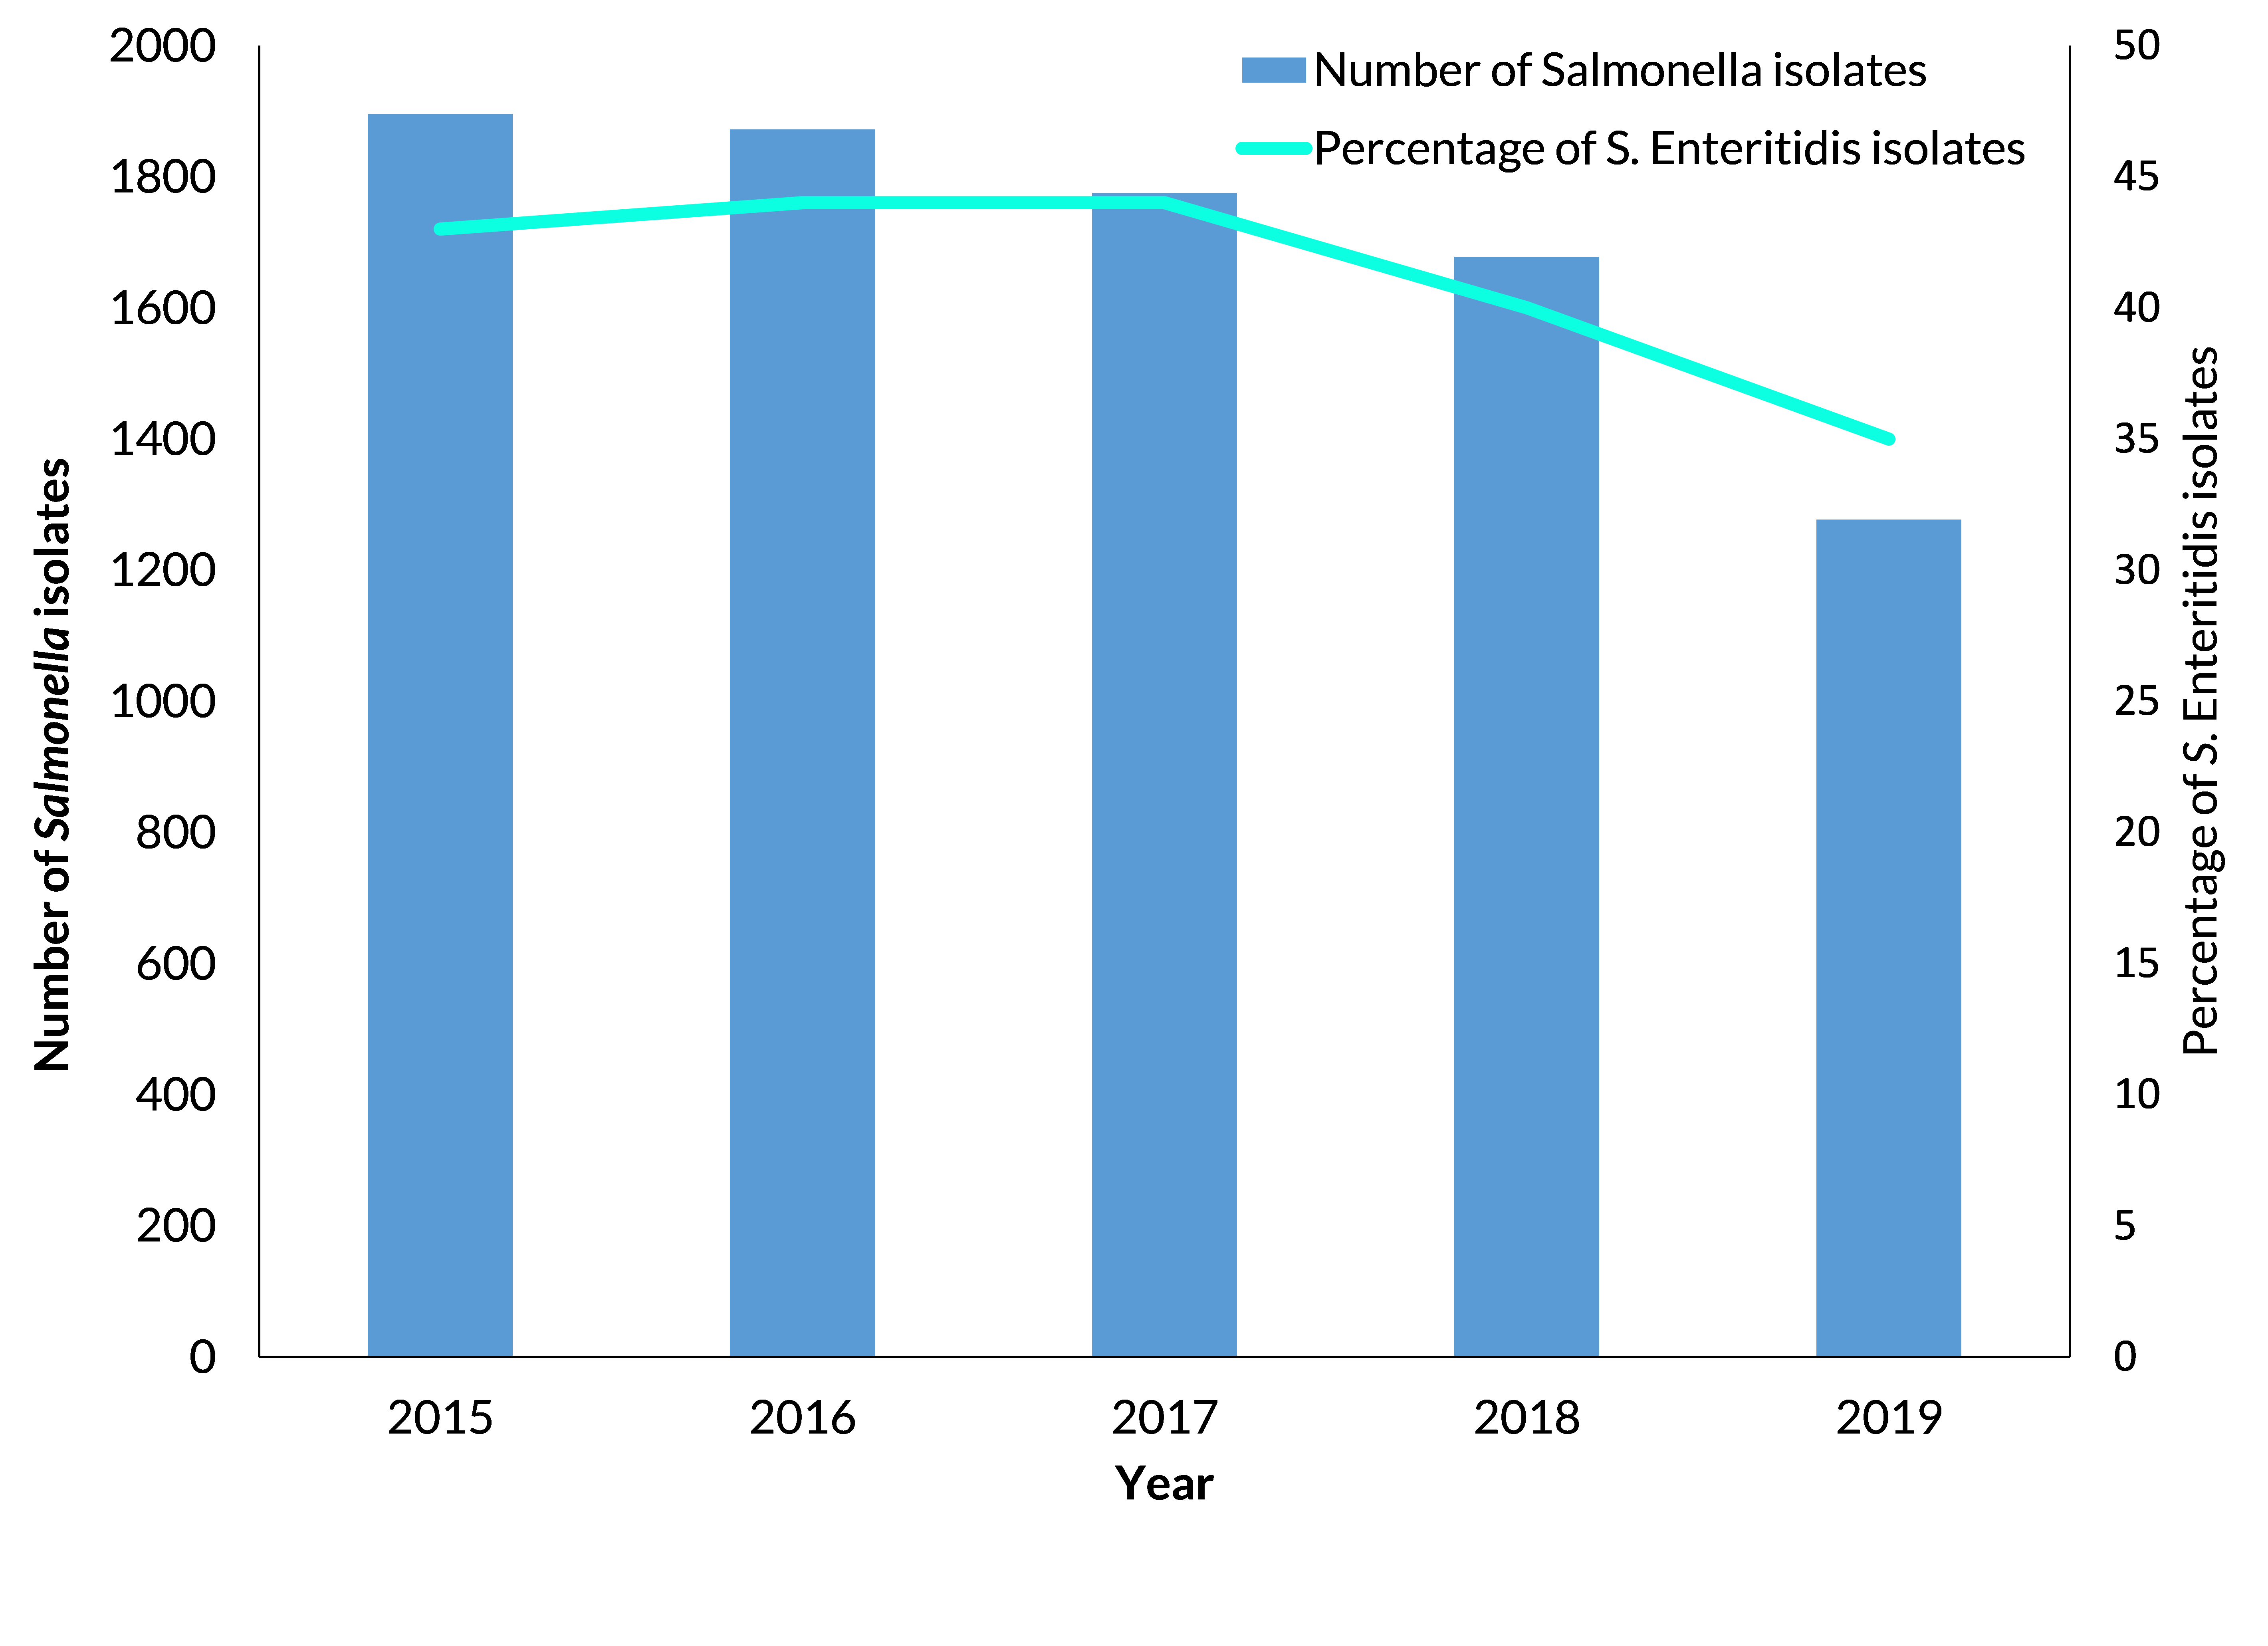
Figure 13 - Text description
| Year | Number of Salmonella isolates | Percentage of S. Enteritidis isolates |
|---|---|---|
| 2015 | 1896 | 43 |
| 2016 | 1872 | 44 |
| 2017 | 1775 | 44 |
| 2018 | 1678 | 40 |
| 2019 | 1277 | 35 |
- Resistance is uncommon in S. Enteritidis.
- For antimicrobials other than nalidixic acid, generally <5% of isolates are resistant to specific individual antimicrobials.
- Except for resistance to nalidixic acid; a quinolone and Category II antimicrobial.
Salmonella Enteritidis and quinolone resistance in humans
Resistance to nalidixic acid in human S. Enteritidis isolates has been increasing since 2010.
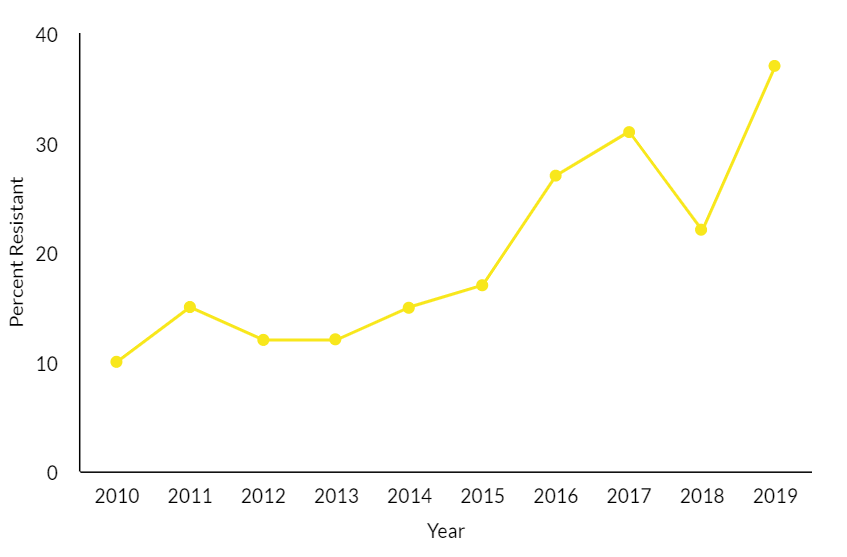
Figure 14 - Text description
| Year | Percentage (%) of resistance – Nalidixic acid |
|---|---|
| 2010 | 10% |
| 2011 | 15% |
| 2012 | 12% |
| 2013 | 12% |
| 2014 | 15% |
| 2015 | 17% |
| 2016 | 27% |
| 2017 | 31% |
| 2018 | 22% |
| 2019 | 37% |
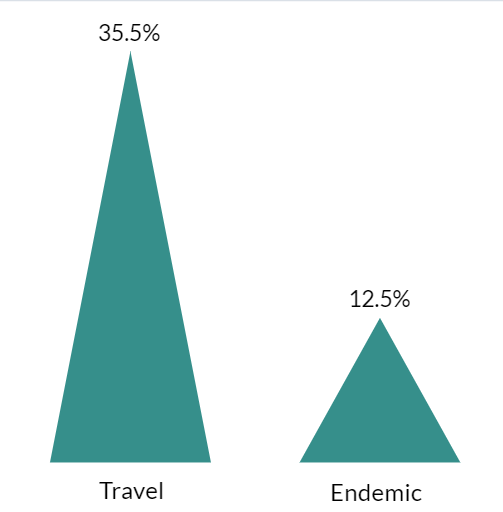
Figure 15 - Text description
| Percentage (%) of resistance to nalidixic acid | |
|---|---|
| Travel | 35.5% |
| Endemic | 12.5% |
Data* indicate that nalidixic acid resistance in S. Enteritidis is more common in cases with a history of travel outside of Canada compared to cases without a history of travel outside of Canada (endemic cases).
*FoodNet Canada data
Ongoing genetic analyses will help to further explain the potential relationship of travel outside Canada and nalidixic acid-resistant S. Enteritidis infections.
Detection of quinolone resistance in Salmonella Enteritidis from chicken(s)
In 2018, a clear increase (although small in numbers) in the detection of nalidixic acid-resistant S. Enteritidis across several surveillance components from multiple provinces was noted. In 2019, this pattern of detection continued.
Retail
- 1 isolate from Alberta (FoodNet Canada)
Retail
- 1 isolate from Québec
Abattoir
- 2 isolates from Nova Scotia and Prince Edward Island
The majority of S. Enteritidis from animal and food sources were susceptible to all antimicrobials tested.
In 2019, in addition to meat and abattoir isolates, nalidixic acid-resistance was detected in 8 clinical isolates from broiler chickens (sick chicken do not enter the food chain).
Reasons for the detection of novel resistance may differ between isolates found along the agri-food chain and clinical isolates.
Noting the number of detected isolates are small, CIPARS will continue to monitor whether domestic chicken could be a new possible source of human exposure to nalidixic-resistant S. Enteritidis.
Salmonella resistant to 6 or 7 antimicrobial classes
- The number of Salmonella isolates resistant to 6 or 7 of the 7 antimicrobial classes tested continued to increase (from both human and animal sources).
- There was also new detection of Salmonella Heidelberg on cattle farms resistant to 6 or 7 antimicrobial classes.
In 2019, 159 Salmonella isolates were identified as highly drug-resistant from the following sources:
Human
- Only clinical isolates tested.
- Most isolates were S. Newport, Infantis, and Typhimurium.
Cattle
- First detection of highly drug-resistant Salmonella from cattle farms (n = 2).
- All these isolates from healthy cattle were Salmonella Heidelberg.
- However, most isolates were from sick cattle with resistance to 6 or 7 antimicrobial classes were S. Dublin.
Chicken
- There was continued detection of highly drug resistant S. Infantis.
- It was detected in a retail sample from Ontario.
Swine
- Resistance to 6 or 7 antimicrobial classes was detected in 8 serovars.
- Most were from sick pigs (clinical samples) (n = 18).
- 4, [5], 12:i:- was the predominant serovar (n = 8).
- One 4, [5], 12:i:- isolate was resistant to all 7 classes (clinical sample).
Turkey
- All isolates were S. Infantis.
- Most isolates (n = 3) were from Ontario farms.
Note: sick animals do not enter the food chain
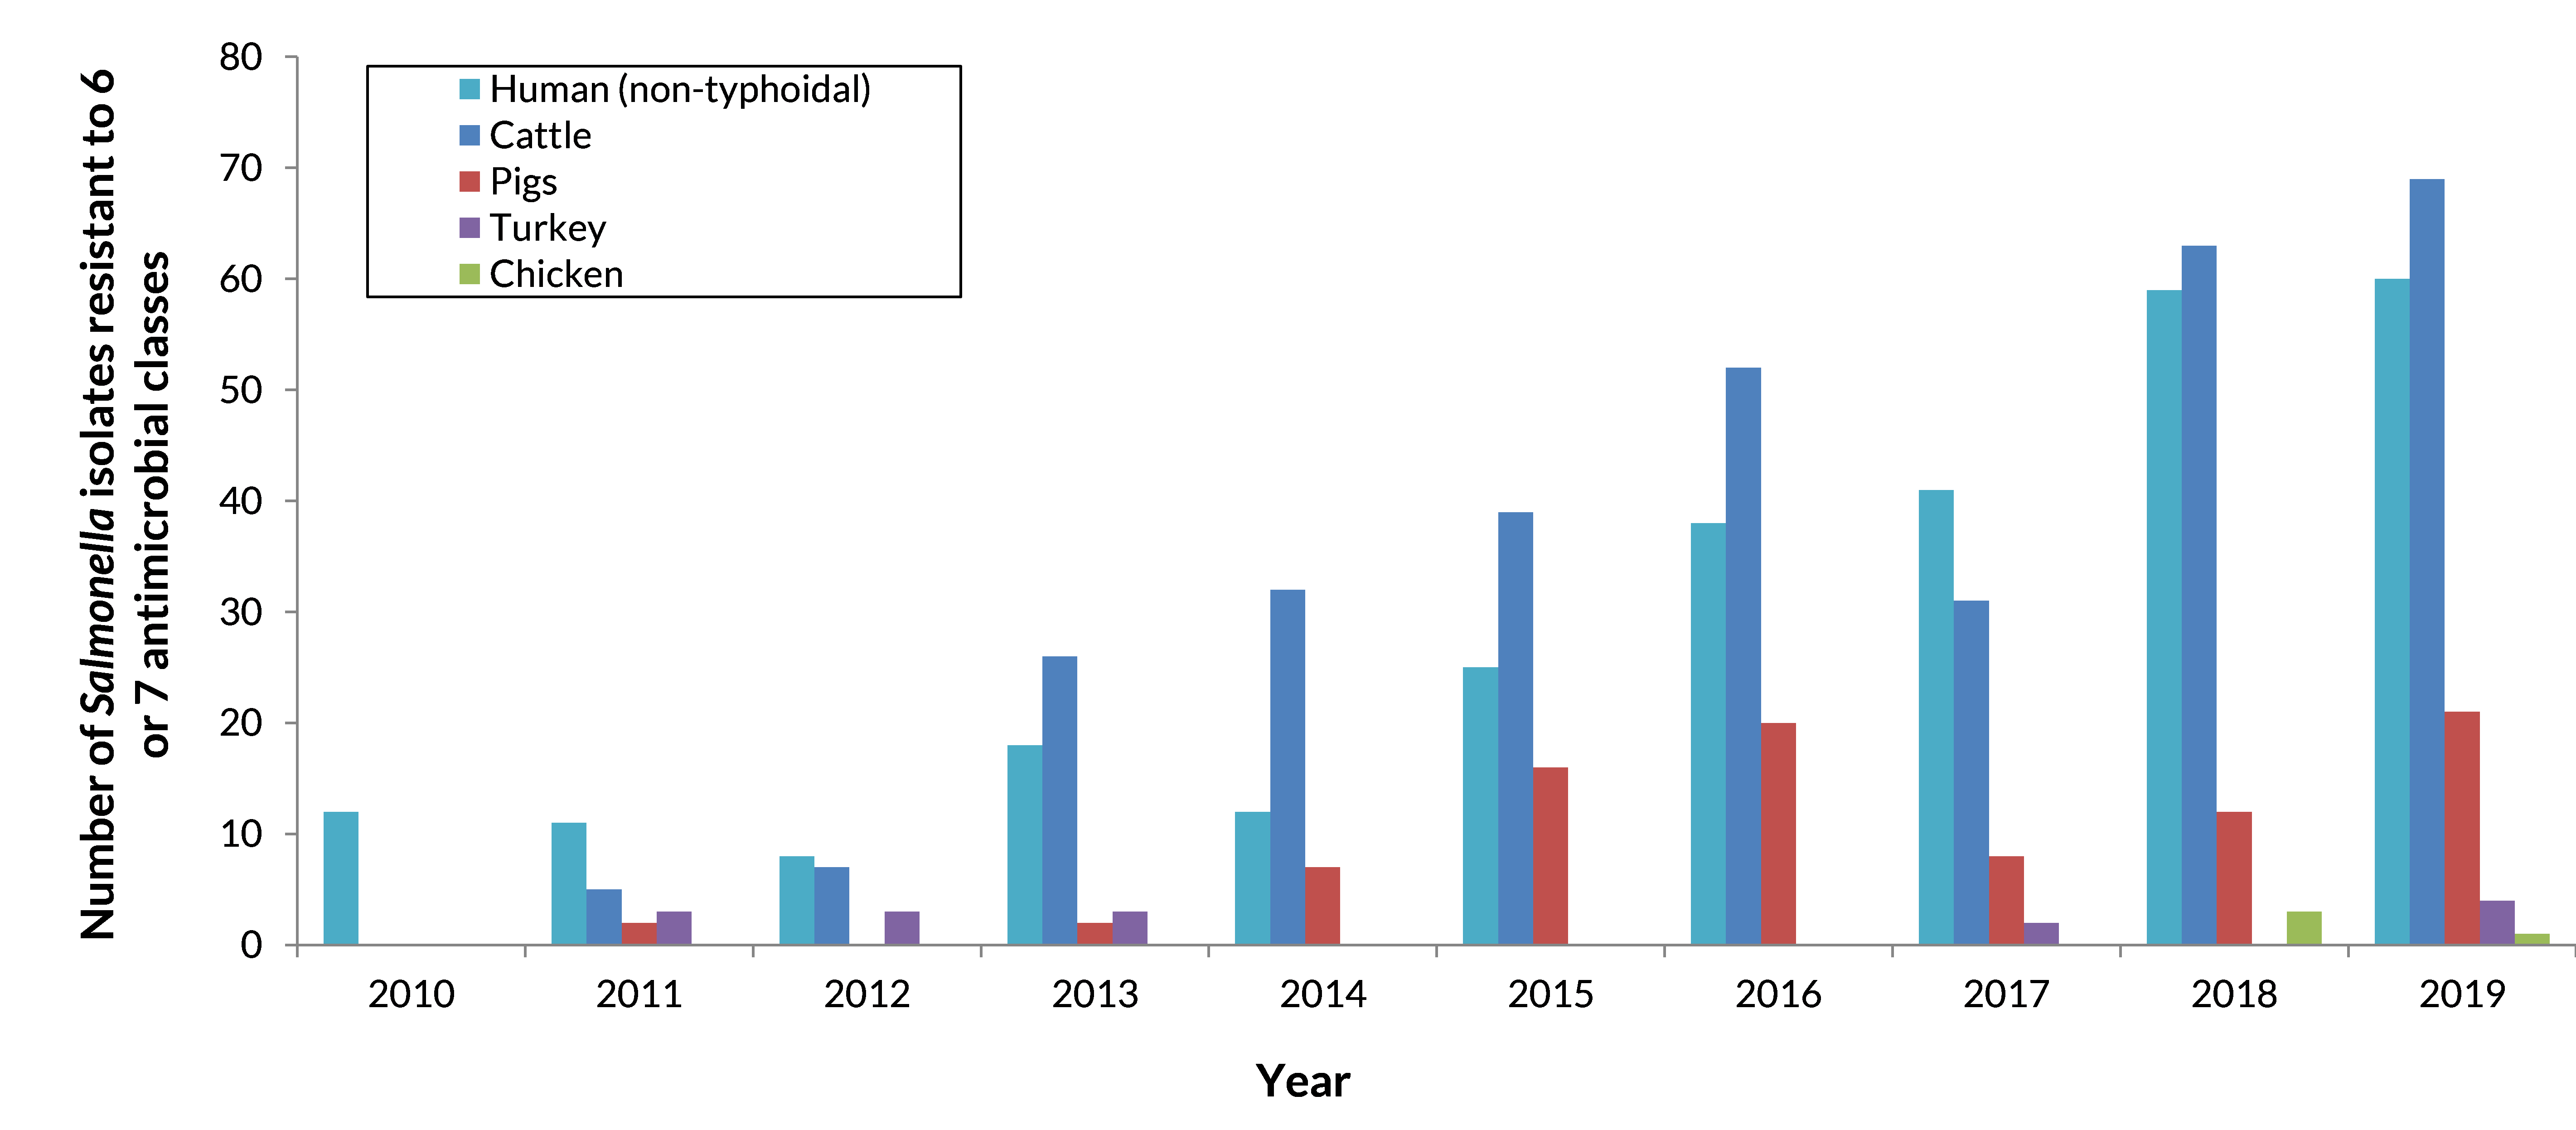
Figure 16 - Text description
| Year | Cattle | Pigs | Chicken | Turkey | Human (non-typhoidal) |
|---|---|---|---|---|---|
| 2010 | 0 | 0 | 0 | 0 | 12 |
| 2011 | 5 | 2 | 0 | 3 | 11 |
| 2012 | 7 | 0 | 0 | 3 | 8 |
| 2013 | 26 | 2 | 0 | 3 | 18 |
| 2014 | 32 | 7 | 0 | 0 | 12 |
| 2015 | 39 | 16 | 0 | 0 | 25 |
| 2016 | 52 | 20 | 0 | 0 | 38 |
| 2017 | 31 | 8 | 0 | 2 | 41 |
| 2018 | 63 | 12 | 3 | 0 | 59 |
| 2019 | 69 | 21 | 1 | 4 | 60 |
Note: information from sick animals (which do not enter the food chain) is combined with information from healthy animals and meat. These represent different levels of exposure concern to people.
Salmonella Heidelberg from cattle
- In 2019, Salmonella Heidelberg isolates with resistance to 6 antimicrobial classes were identified from healthy cattle on Alberta feedlots.
- There were 6 isolates resistant to 6 classes, with an additional isolate resistant to 5 classes (approximately 25%).
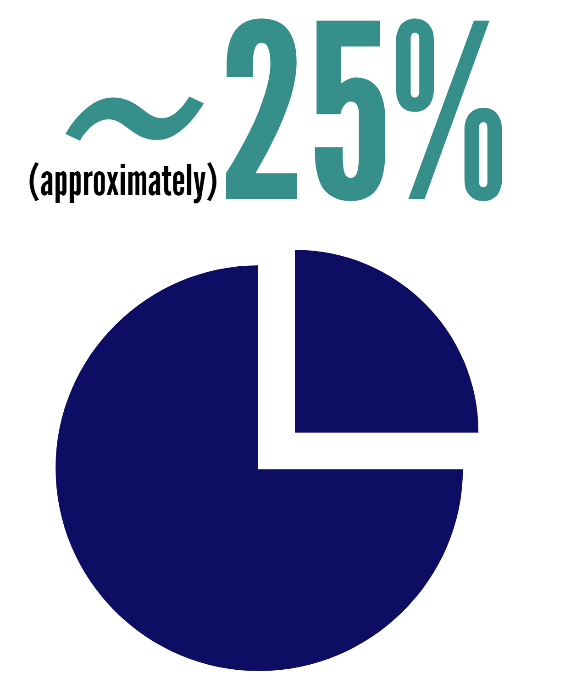
Diagram 3 - Text description
| Salmonella Heidelberg isolate resistant to | Proportion (%) |
|---|---|
| 5 or 6 antimicrobial classes | 25% |
| Less than 5 antimicrobial classes | 75% |
- These were isolated from pens containing Holstein (dairy-origin) cattle from the United States.
- Previously, Salmonella from cattle with resistance to 6 or 7 antimicrobial classes was only identified in sick animals (mostly S. Typhimurium and S. Dublin).
- The prevalence of Salmonella from healthy Canadian feedlot cattle in the past (research and historic CIPARS Feedlot AMR data) has been very low (1 to 2%) and resistance to the antimicrobials tested was not found in these Salmonella isolates.
Salmonella Heidelberg in cattle
- CIPARS does not test for Salmonella from beef cattle in other surveillance components related to the food-chain (abattoir, retail) due to very low recovery rates.
- The finishing of Holstein cattle from the United States in Canada is a new practice in Western Canada and has become an important part of the feedlot industry.
- Whole genome sequencing indicated there is no relation between these S. Heidelberg isolates found in cattle with any human isolates.
Glossary
Antimicrobial class
Antimicrobials are grouped into the same class if they have a common chemical structure and method to kill or stop the growth of bacteria. CIPARS uses the Clinical and Laboratory Standards Institute to define antimicrobial class.
Biomass and Population Correction Unit (PCU)
The PCU accounts for the size of the population. It includes both the number and weight (biomass) of animals or people in the population. CIPARS uses the PCU to interpret the antimicrobial use and sales data, using the same approach as the European Surveillance of Veterinary Antimicrobial Consumption Project.
DDDvet
This is an acronym for the "Defined Daily Dose for animals". The amount of antimicrobials given during a treatment (dose) will vary depending on the antimicrobial, how the antimicrobial is given (e.g. by injection, through water or feed) and the population treated (cattle, chickens, pigs). CIPARS uses this metric to adjust for this variation and help interpret antimicrobial use data.
Grower-finisher pig
A pig that is approximately 25 kilograms to market weight.
Highly Drug-Resistant (HDR)
Resistance to 6 or 7 classes of antimicrobials. No formal international standards exist for defining highly resistant isolates.
Medically important antimicrobials
Antimicrobials deemed to be of very high importance (Category I), high importance (Category II), or medium importance (Category III) in human medicine.
mg/PCU
An antimicrobial use metric that adjusts the quantity (milligram/mg) of antimicrobial used, consumed or distributed by the size of the population.
nDDDvet/1000 animal-days
An antimicrobial use metric that adjusts for both variation in the amount of antimicrobial given during a treatment (DDDvet), and the length of time that an animal or group of animals are treated to help interpret antimicrobial use data.
Susceptible
Susceptible to all tested antimicrobial classes. In 2019, CIPARS tested for resistance to 7 antimicrobial classes.
CIPARS analysts are working to develop new ways of identifying emerging issues and integrating data across various host species, bacterial species, and across regions.
CIPARS will continue to monitor and communicate the impact of changing antimicrobial use practices on the occurrence of antimicrobial resistance to preserve the effectiveness of antimicrobials in animals and humans.