
Surveillance for Ixodes scapularis and Ixodes pacificus ticks and their associated pathogens in Canada, 2022

 Download this article as a PDF (919 KB)
Published by: The Public Health Agency of Canada
Issue: Volume 52-1/2, January/February 2026: Tick and Mosquito Surveillance in Canada
Date published: February 2026
ISSN: 1481-8531
Submit a manuscript
About CCDR
Browse
Volume 52-1/2, January/February 2026: Tick and Mosquito Surveillance in Canada
Surveillance
Surveillance for Ixodes scapularis and Ixodes pacificus ticks and their associated pathogens in Canada, 2022
Gamal Wafy1, Safa Ahmad1, Christy Wilson1, Heather Coatsworth2, Jade Savage3, Mark Nelder4, Kirby Cronin4, Pauline Zhang4, Karine Thivierge5,6, Kirsten Crandall7, Priya Goundar8, Louwrens Snyman9,10, Emily Jenkins9, Muhammed Morshed11,12, Catherine Hogan11,12, Min‑Kuang Lee11, Peter Buck1, Annie‑Claude Bourgeois1, Salima Gasmi13
Affiliations
1 Centre for Food-borne, Environmental and Zoonotic Infectious Diseases, Public Health Agency of Canada, Ottawa, ON
2 National Microbiology Laboratory Branch, Public Health Agency of Canada, Winnipeg, MB
3 Department of Biology and Biochemistry, Bishop’s University, Sherbrooke, QC
4 Public Health Ontario, Toronto, ON
5 Laboratoire de santé publique du Québec, Sainte-Anne-de-Bellevue, QC
6 Institute of Parasitology, McGill University, Sainte-Anne-de-Bellevue, QC
7 Institut national de santé publique du Québec, Montréal, QC
8 Ministry of Health, Regina, SK
9 Department of Veterinary Microbiology, Western College of Veterinary Medicine, University of Saskatchewan, Saskatoon, SK
10 Royal Alberta Museum, Edmonton, AB
11 BCCDC Public Health Laboratory, BC Centre for Disease Control, Vancouver, BC
12 Department of Pathology and Laboratory Medicine, University of British Columbia, Vancouver, BC
13 Centre for Food-borne, Environmental and Zoonotic Infectious Diseases, Public Health Agency of Canada, Saint-Hyacinthe, QC
Correspondence
Suggested citation
Wafy G, Ahmad S, Wilson CH, Coatsworth H, Savage J, Nelder MP, Cronin K, Zhang P, Thivierge K, Crandall K, Goundar P, Snyman LP, Jenkins E, Morshed MG, Hogan CA, Lee M-K, Buck PA, Bourgeois A-C, Gasmi S. Surveillance for Ixodes scapularis and Ixodes pacificus ticks and their associated pathogens in Canada, 2022. Can Commun Dis Rep 2026;52(1/2):26–35. https://doi.org/10.14745/ccdr.v52i0102a04
Keywords: Ixodes scapularis, Ixodes pacificus, surveillance, ticks, Borrelia, Anaplasma, Babesia, Powassan virus
Abstract
Background: This article continues the annual series on tick surveillance in Canada, tracking two of the primary tick vectors of concern in the country, Ixodes scapularis and Ixodes pacificus, which can transmit the agent of Lyme disease alongside several other tick-borne pathogens.
Objective: This study analyzed passive and active tick surveillance data, including geographic distribution, pathogen prevalence and other characteristics to inform public health prevention.
Methods: Passive and active surveillance data were compiled from eTick (an online, image-based platform), the National Microbiology Laboratory (Public Health Agency of Canada), provincial and local public health authorities and the Canadian Lyme Disease Research Network. Descriptive statistics of ticks and their associated pathogens are presented, including infection prevalence estimates.
Results: In 2022, a total of 7,030 I. scapularis were submitted through passive surveillance from all provinces, while 911 I. pacificus were submitted from British Columbia (n=909) and Yukon (n=2). Ixodes scapularis submissions peaked in May and again in October. For I. pacificus, submissions peaked in May with a second, smaller peak in November. Six tick-borne pathogens (Anaplasma phagocytophilum, Borrelia burgdorferi, Borrelia miyamotoi, Babesia microti, Babesia odocoilei, Powassan virus) were identified from the I. scapularis collected by dragging in Manitoba, Ontario, Québec, New Brunswick or Nova Scotia.
Conclusion: This report provides a summary of tick surveillance data collected in 2022. Tick characteristics and tick-borne pathogen infection prevalence were similar to previous years. Tick surveillance continues to play an important role in monitoring infection prevalence among ticks and their geographic distribution, which will help inform public health prevention and intervention efforts.
Introduction
Tick-borne diseases (TBDs) continue to be a public health concern in Canada Footnote 1. Ixodes scapularis (blacklegged tick) and Ixodes pacificus (western blacklegged tick) are the primary tick vectors of importance in Canada, and are capable of transmitting several bacterial, viral and protozoan pathogens Footnote 2Footnote 3. These pathogens include Borrelia burgdorferi (senso stricto) (causing Lyme disease, LD), Borrelia miyamotoi (tick-borne relapsing fever), Anaplasma phagocytophilum (anaplasmosis), Babesia spp. (babesiosis) and Powassan virus–Lineage II Footnote 2Footnote 3. Ixodes scapularis are usually identified in Central and Eastern Canada and I. pacificus in British Columbia Footnote 4Footnote 5Footnote 6Footnote 7. In addition to LD becoming nationally notifiable in 2009, anaplasmosis, babesiosis and Powassan virus disease are nationally notifiable in humans as of 2024 Footnote 8.
Tick surveillance in Canada continues to play an important role in understanding the increasing risk of TBDs Footnote 4. By 2022, the national LD incidence had increased 6.5-fold relative to 2012 (from 338 to 2,525 cases) Footnote 9. Together, the increasing incidence of LD and the updated nationally notifiable status of other TBDs emphasize the importance of tick surveillance. Furthermore, I. scapularis ticks have been testing positive for B. burgdorferi since the 1990s Footnote 4Footnote 5. Continued surveillance efforts help identify the expanding geographic distribution of I. scapularis and their infection with relevant tick-borne pathogens Footnote 10Footnote 11. In addition, tick surveillance data can help inform prevention efforts such as where and when to target awareness campaigns.
Since 2019, I. scapularis and I. pacificus surveillance data collected in Canada has been summarized at the national level Footnote 7. These annual surveillance reports help monitor the current situation in Canada by summarizing the geographic distributions and seasonal activity of the selected Ixodes species Footnote 6Footnote 7. The objective of this surveillance report is to summarize characteristics of I. scapularis and I. pacificus, collected through passive and active surveillance in 2022. This article will also summarize the prevalence and spatial distribution of several tick-borne pathogens.
Methods
Data sources
This report uses passive and active tick surveillance data from seven organizations including public health authorities and academics. Passive surveillance data were provided by eTick (Bishop’s University), British Columbia Centre for Disease Control (BCCDC), Public Health Ontario (PHO), Saskatchewan Ministry of Health, Institut national de santé publique du Québec (INSPQ) and the National Microbiology Laboratory (NML) of the Public Health Agency of Canada. Active surveillance data were provided by the Canadian Lyme Disease Research Network (CLyDRN). The CLyDRN conducts active surveillance across all 10 provinces. In addition, active surveillance data was provided by BCCDC, PHO and INSPQ.
Passive tick surveillance
This report follows similar methodology as previous annual reports Footnote 6Footnote 7Footnote 12. This analysis was limited to I. scapularis and I. pacificus collected in Canada in 2022. Submission records of ticks acquired outside of the submission province, as well as ticks acquired outside of Canada, were excluded, as were all records associated with a prior two-week history of travel outside of Canada. Ticks were either submitted individually (single submission) or in groups of two or more (multiple submission).
Since 2009, regional passive tick surveillance and testing programs have been gradually discontinued in several jurisdictions. This could be due, in part, to limited laboratory capacity as I. scapularis populations become established in various parts of the country and are more often encountered. eTick remains open to the public to submit images and spatiotemporal data of ticks encountered throughout Canada. eTick is a web-based, community-science project inviting the public to help with tick monitoring and used as a passive surveillance system for ticks in Canada Footnote 13. The images and associated data of ticks encountered by members of the public are submitted to the eTick website or through the eTick application, for identification by trained personnel. While images of Dermacentor ticks are only identified to genus, those of Ixodes and other genera are identified to species, unless the picture quality is inadequate in which case the specimen is requested to be submitted for further examination.
Ticks submitted from Saskatchewan and INSPQ were tested for A. phagocytophilum, B. burgdorferi, B. miyamotoi and B. microti using methods previously described Footnote 7Footnote 14. Ixodes pacificus submitted by the BCCDC were tested for B. burgdorferi Footnote 15. Ticks submitted from PHO were not tested for pathogens. Ticks submitted through eTick were not routinely requested for testing for tick-borne pathogens, but they could be forwarded onto a laboratory for this purpose at the request of local public health authorities.
Active tick surveillance
Ticks were collected from the environment using drag sampling. This report analyzed I. scapularis collected via drag sampling from 19 sites in Alberta, 10 sites in Saskatchewan, 12 sites in Manitoba, 95 sites in Ontario, 124 sites in Québec, 10 sites in New Brunswick, 24 sites in Nova Scotia, five sites in Prince Edward Island and 10 sites in Newfoundland and Labrador. Also included in this report are I. pacificus data collected from 22 sites throughout British Columbia. Drag sampling took place in late spring/summer (May–July) across all regions. Some sentinel sites included a second sampling period in the fall (September–November).
Ticks submitted through CLyDRN and INSPQ were tested for A. phagocytophilum, B. burgdorferi, B. miyamotoi, B. microti, B. odocoilei and Powassan virus. Ixodes pacificus submitted by the BCCDC were tested for B. burgdorferi. Ticks that tested positive for A. phagocytophilum underwent further testing to identify the strain as pathogenic (A. phagocytophilum–human active, Ap-ha) or non-pathogenic (A. phagocytophilum–Ap-V1). The protocols for testing the ticks have been previously described Footnote 7Footnote 14Footnote 16.
Analysis
Descriptive and spatiotemporal characteristics: For passive surveillance, descriptive statistics were calculated for several characteristics including submission type, the tick species covered in this report, province of acquisition, life stage (larva, nymph, adult female or adult male), level of engorgement (unfed or engorged), host (human, dog, cat or other) and month of collection. For active surveillance, descriptive statistics were calculated for province of collection and life stage (larva, nymph or adult). All data were cleaned and analysed in R (version 4.3.2) Footnote 17.
Ticks submitted through passive surveillance were mapped using QGIS (version 3.34.7) based on their location of acquisition. Records with a history of travel in Canada in the previous 14 days were geocoded to the probable location of exposure during travel. Data records were excluded from geocoding but kept in the overall analysis if the submitter had a history of multiple travel locations within Canada, travel to another province or were missing a location of tick acquisition. In active surveillance, the location of tick dragging was geocoded before being mapped except where site coordinates were already provided.
Infection prevalence: Prevalence was calculated as the number of positive ticks divided by the total number of ticks tested. Using the binom package in R, 95% confidence intervals were calculated.
Results
Overview of passive surveillance data
In 2022, there were 911 I. pacificus and 7,030 I. scapularis submitted from 10 provinces and one territory (Table 1, Figure 1). No ticks were submitted from Northwest Territories or Nunavut. A higher proportion (54%) of the records were obtained from image-based submissions (n=4,324) while the rest were sample-based submissions (n=3,617). Submissions from Ontario, Québec and Nova Scotia comprised 83.4% of all ticks submitted. The majority (99.2%) of ticks were from single submissions, but there were 61 multiple submissions (range: 2–4 ticks per submission).
| Province | Tick species (number of ticks) |
Type of surveillanceFootnote a (number of ticks) |
Type of submissionFootnote b (number of submissions) |
||||
|---|---|---|---|---|---|---|---|
| Ixodes pacificus | Ixodes scapularis | Total | Sample-based | Image-based | Single submissions | Multiple submissions | |
| British Columbia | 909 | 3 | 912 | 628 | 284 | 871 | 19 |
| Alberta | 0 | 126 | 126 | 0 | 126 | 126 | 0 |
| Saskatchewan | 0 | 17 | 17 | 0 | 17Footnote c | 17 | 0 |
| Manitoba | 0 | 51 | 51 | N/A | 51 | 51 | 0 |
| Ontario | 0 | 4,338 | 4,338 | 2,211 | 2,127 | 4,249 | 42 |
| Québec | 0 | 1,629 | 1,629 | 778 | 851 | 1,629 | 0 |
| Newfoundland and Labrador | 0 | 12 | 12 | 0 | 12 | 12 | 0 |
| New Brunswick | 0 | 146 | 146 | 0 | 146 | 146 | 0 |
| Nova Scotia | 0 | 657 | 657 | 0 | 657 | 657 | 0 |
| Prince Edward Island | 0 | 51 | 51 | 0 | 51 | 51 | 0 |
| Yukon | 2 | 0 | 2 | 0 | 2 | 2 | 0 |
| Total | 911 | 7,030 | 7,941 | 3,617 | 4,324 | 7,811 | 61 |
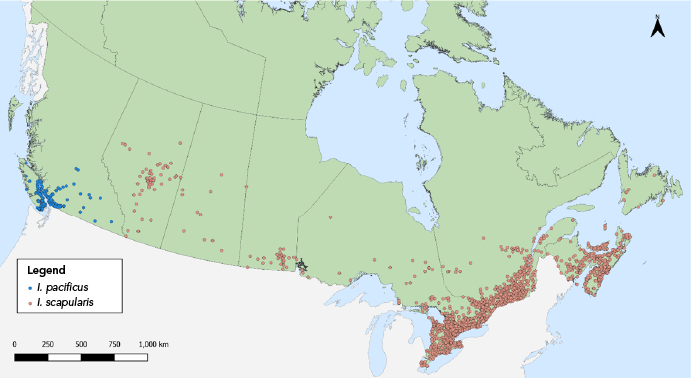
Figure 1: Descriptive text
This map shows the probable location of acquisition of Ixodes scapularis and Ixodes pacificus ticks submitted through passive surveillance. Ixodes pacificus ticks were present in British Columbia. Ixodes scapularis ticks were present across all provinces to varying extents.
Most ticks submitted were adult female (I. pacificus: 89.7%; I. scapularis: 89.9%) (Table 2). Adult males, nymphs and larvae were submitted less frequently (I. pacificus: 2.3%, 6.9% and 1.1%; I. scapularis: 5.6%, 4.4% and 0.1%, respectively). Overall, 11.3% of I. pacificus and 62.7% of I. scapularis adult females were engorged. Humans were the most common host among I. pacificus and I. scapularis (75.2% and 59.1%, respectively) followed by dogs (16.2% and 34.0%, respectively).
| Characteristics | Tick species | ||||||
|---|---|---|---|---|---|---|---|
| Ixodes pacificus | Ixodes scapularis | ||||||
| n | % | n | % | ||||
| Life stage | |||||||
| Larva | 10 | 1.1 | 4 | 0.1 | |||
| Nymph | 62 | 6.9 | 282 | 4.4 | |||
| Adult female | 810 | 89.7 | 5,701 | 89.9 | |||
| Adult male | 21 | 2.3 | 353 | 5.6 | |||
| Total | 903 | 100 | 6,340 | 100 | |||
| Level of engorgementFootnote c | |||||||
| Adult female | |||||||
| Engorged | 70 | 11.3 | 1,663 | 62.7 | |||
| Unfed | 548 | 88.7 | 991 | 37.3 | |||
| Total | 618 | 100 | 2,654 | 100 | |||
| Nymph | |||||||
| Engorged | N/A | N/A | 74 | 63.8 | |||
| Unfed | N/A | N/A | 42 | 36.2 | |||
| Total | N/A | N/A | 116 | 100 | |||
| Host | |||||||
| Human | 685 | 75.2 | 2,849 | 59.1 | |||
| Dog | 148 | 16.2 | 1,640 | 34.0 | |||
| Cat | 5 | 0.6 | 219 | 4.5 | |||
| OtherFootnote d | 73 | 8.0 | 111 | 2.3 | |||
| Total | 911 | 100 | 4,819 | 100 | |||
Two submission peaks for adult I. scapularis were observed, one in May and a second slightly larger peak in October (Figure 2). The number of adult I. pacificus submissions peaked in May with a second, considerably smaller peak in November.
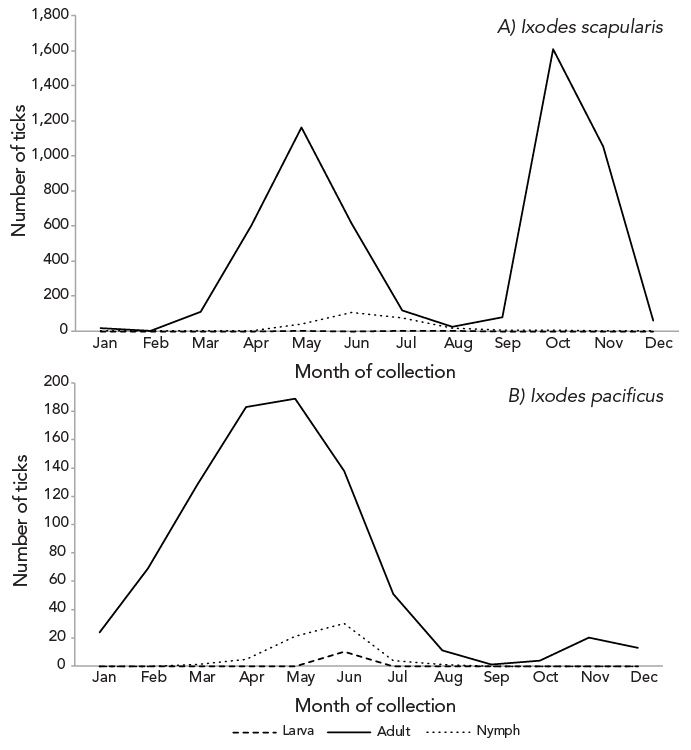
Figure 2: Descriptive text
| Month of collection | Adult | Larva | Nymph |
|---|---|---|---|
| January | 15 | 0 | 0 |
| February | 0 | 0 | 0 |
| March | 108 | 0 | 0 |
| April | 602 | 0 | 1 |
| May | 1,161 | 1 | 39 |
| June | 613 | 0 | 104 |
| July | 119 | 1 | 76 |
| August | 23 | 1 | 15 |
| September | 77 | 0 | 5 |
| October | 1,610 | 0 | 4 |
| November | 1,055 | 0 | 1 |
| December | 58 | 0 | 1 |
| Total | 5,441 | 3 | 246 |
| Month of collection | Adult | Nymph | Total |
|---|---|---|---|
| January | 24 | 0 | 0 |
| February | 69 | 0 | 0 |
| March | 128 | 0 | 1 |
| April | 183 | 0 | 5 |
| May | 189 | 0 | 21 |
| June | 138 | 10 | 30 |
| July | 51 | 0 | 4 |
| August | 11 | 0 | 1 |
| September | 1 | 0 | 0 |
| October | 4 | 0 | 0 |
| November | 20 | 0 | 0 |
| December | 13 | 0 | 0 |
| Total | 831 | 10 | 62 |
Passive surveillance infection prevalence
The majority of I. pacificus submitted by BCCDC were tested for B. burgdorferi (n=624/625; 99.8%). In comparison, 64.6% (n=509/788) to 65.0% (n=512/788) of sample-based I. scapularis submissions were tested, depending on the pathogen of interest. Of 788 I. scapularis, three were submitted from BCCDC, seven from Saskatchewan and 778 from INSPQ. Although most of the prevalence data for I. scapularis came from Québec, one tick was found positive for B. burgdorferi in British Columbia, and another tick was found positive for B. miyamotoi in Saskatchewan (Table 3).
| Province | Infection prevalence (% positive, 95% CI) | ||||||
|---|---|---|---|---|---|---|---|
| Borrelia burgdorferi | Borrelia miyamotoi | ||||||
| Adult | Nymph | Total | Adult | Nymph | Total | ||
| Ixodes pacificus | |||||||
| British Columbia | 7/624 (1.1, 0.5–2.3) |
0 | 7/624 (1.1, 0.5–2.3) |
NT | NT | NT | |
| Ixodes scapularis | |||||||
| British Columbia | 1/3 (33.3, 0.8–90.6) |
0 | 1/3 (33.3, 0.8–90.6) |
NT | NT | NT | |
| Saskatchewan | 0/7 (0.0, 0.0–41.0) |
0 | 0/7 (0.0, 0.0–41.0) |
1/7 (14.3, 0.4–57.9) |
0 | 1/7 (14.3, 0.4–57.9) |
|
| Québec | 113/477 (23.7, 19.9–27.8) |
2/25 (8.0, 1.0–26.0) |
115/502 (22.9, 19.3–26.8) |
5/477 (1.0, 0.3–2.4) |
0/25 (0.0, 0.0–13.7) |
5/502 (1.0, 0.3–2.3) |
|
| Total | 114/487 (23.4, 19.7–27.4) |
2/25 (8.0, 1.0–26.0) |
116/512 (22.7, 19.1–26.5) |
6/484 (1.2, 0.5–2.7) |
0/25 (0.0, 0.0–13.7) |
6/509 (1.2, 0.4–2.6) |
|
While ticks from human (95.7%) and non-human hosts (4.3%) were both tested, pathogens were found only in I. scapularis and I. pacificus submitted from human hosts. Pathogen testing information from Québec identified five ticks co-infected with A. phagocytophilum and B. burgdorferi, and one tick coinfected with B. burgdorferi and B. miyamotoi (Table 4).
| Province | Infection prevalenceFootnote a (% positive, 95% CI) |
|||||
|---|---|---|---|---|---|---|
| Anaplasma phagocytophilum | Babesia microti | |||||
| Adult | Nymph | Total | Adult | Nymph | Total | |
| Ixodes pacificus | ||||||
| British Columbia | NT | NT | NT | NT | NT | NT |
| Ixodes scapularis | ||||||
| British Columbia | NT | NT | NT | NT | NT | NT |
| Saskatchewan | 0/7 (0.0, 0.0–41.0) |
0 | 0/7 (0.0, 0.0–41.0) |
0/7 (0.0, 0.0–41.0) |
0 | 0/7 (0.0, 0.0–40.96) |
| Québec | 13/477 (2.7, 1.5–4.6) |
2/25 (8.0, 1.0–26.0) |
15/502 (3.0, 1.7–4.9) |
0/477 (0.0, 0.0–0.8) |
0/25 (0.0, 0.0–13.7) |
0/502 (0.0, 0.0–0.7) |
| Total | 13/484 (2.7, 1.4–4.6) |
2/25 (8.0, 1.0–26.0) |
15/509 (3.0, 1.7–4.8) |
0/484 (0.0, 0.0–0.8) |
0/25 (0.0, 0.0–13.7) |
0/509 (0.0, 0.0–0.7) |
Overview of active surveillance data
In 2022, I. scapularis (n=2,292) were collected in six provinces via active surveillance: Alberta (n=1), Manitoba (n=12), Ontario (n=904), Québec (n=1,077), New Brunswick (n=56) and Nova Scotia (n=242). Nymphs (n=1,116/2,292; 48.7%) were collected most often, followed by adults (n=894/2,292; 39.0%) and larvae (n=282/2,292; 12.3%). One I. scapularis was found in Alberta and it was not tested for pathogens. No I. scapularis were found by dragging in Saskatchewan, Prince Edward Island and Newfoundland and Labrador. Ixodes pacificus were collected in British Columbia (n=109). Ixodes pacificus nymphs (n=58/109; 53.2%) were collected most often, followed by larvae (n=26/109; 23.9%) and adults (n=25/109; 22.9%).
Active surveillance infection prevalence
The most prevalent pathogen detected in I. scapularis was B. burgdorferi (24.4%, 95% CI: 22.5–26.4) (Table 5). Anaplasma phagocytophilum (2.9%, 95% CI: 2.2–3.7) was found in I. scapularis in all provinces where I. scapularis were recovered by active surveillance except Manitoba and Alberta (Table 6). Of the 57 ticks testing positive for A. phagocytophilum, 29 were tested to determine the strain variant, with 15 (51.7%) carrying the strain that is pathogenic to humans (Ap-ha). Babesia odocoilei was found in I. scapularis (10.6%, 95% CI: 9.3–12.1) in all provinces where active surveillance was conducted except Alberta (Table 6). The remaining pathogens (B. miyamotoi, B. microti and Powassan virus) were each found in less than 0.3% of tested ticks. Four B. microti-positive ticks were found in Québec and one in Nova Scotia (Table 6). Three B. miyamotoi-positive ticks were collected in Ontario and two in Québec (Table 5). Two ticks from Québec tested positive for Powassan virus Lineage II (Table 5). A higher infection prevalence was found in adult ticks versus nymphs for B. burgdorferi, B. miyamotoi and A. phagocytophilum (Table 5 and Table 6). In contrast, a higher infection prevalence was found in nymphs versus adult ticks for B. microti and B. odocoilei (Table 6).
| Province | Infection prevalenceFootnote a (% positive, 95% CI) |
|||||||||||
|---|---|---|---|---|---|---|---|---|---|---|---|---|
| Anaplasma phagocytophilum | Babesia microti | Powassan virus | ||||||||||
| Adult | Nymph | Total | Adult | Nymph | Total | Adult | Nymph | Total | ||||
| Ixodes pacificus | ||||||||||||
| British Columbia | 0/25 (0.0, 0.0–13.7) |
1/58 (1.7, 0.0–9.2) |
1/83 (1.2, 0.0–6.5) |
0/9 (0.0, 0.0–33.6) |
0/58 (0.0, 0.0–6.2) |
0/67 (0.0, 0.0–5.4) |
0/9 (0.0, 0.0–33.63) |
0/58 (0.0, 0.0–6.2) |
0/67 (0.0, 0.0–5.4) |
|||
| Ixodes scapularis | ||||||||||||
| Manitoba | 2/10 (20.0, 2.5–55.6) |
0/2 (0.0, 0.0–84.2) |
2/12 (16.7, 2.1–48.4) |
0/10 (0.0, 0.0–30.9) |
0/2 (0.0, 0.0–84.2) |
0/12 (0.0, 0.0–26.5) |
0/10 (0.0, 0.0–30.9) |
0/2 (0.0, 0.0–84.2) |
0/12 (0.0, 0.0–26.5) |
|||
| Ontario | 176/674 (26.1, 22.8–29.6) |
70/223 (31.4, 25.4–37.9) |
246/897 (27.4, 24.5–30.5) |
3/676 (0.4, 0.1–1.3) |
0/223 (0.0, 0.0–1.6) |
3/899 (0.3, 0.1–1.0) |
0/672 (0.0, 0.0–0.5) |
0/223 (0.0, 0.0–1.6) |
0/895 (0.0, 0.0–0.4) |
|||
| Québec | 43/113 (38.1, 29.1–47.7) |
101/668 (15.1, 12.5–18.1) |
144/781 (18.4, 15.8–21.3) |
0/113 (0.0, 0.0–3.2) |
2/668 (0.3, 0.0–1.1) |
2/781 (0.3, 0.0–0.9) |
1/113 (0.9, 0.0–4.8) |
1/668 (0.1, 0.0–0.8) |
2/781 (0.3, 0.0–0.9) |
|||
| New Brunswick | 7/16 (43.8, 19.8–70.1) |
17/40 (42.5, 27.0–59.1) |
24/56 (42.9, 29.7–56.8) |
0/16 (0.0, 0.0–20.6) |
0/40 (0.0, 0.0–8.8) |
0/56 (0.0, 0.0–6.4) |
0/16 (0.0, 0.0–20.6) |
0/40 (0.0, 0.0–8.8) |
0/56 (0.0, 0.0–6.4) |
|||
| Nova Scotia | 30/73 (41.1, 29.7–53.2) |
38/163 (23.3, 17.1–30.6) |
68/236 (28.8, 23.1–35.0) |
0/73 (0.0, 0.0–4.9) |
0/163 (0.0, 0.0–2.2) |
0/236 (0.0, 0.0–1.6) |
0/73 (0.0, 0.0–4.9) |
0/163 (0.0, 0.0–2.2) |
0/236 (0.0, 0.0–1.6) |
|||
| Total | 258/886 (29.1, 26.1–32.2) |
226/1,096 (20.6, 18.3–23.1) |
484/1,982 (24.4, 22.5–26.4) |
3/888 (0.3, 0.1–1.0) |
2/1,096 (0.2, 0.0–0.7) |
5/1,984 (0.3, 0.1–0.6) |
1/884 (0.1, 0.0–0.6) |
1/1,096 (0.1, 0.0–0.5) |
2/1,980 (0.1, 0.0–0.4) |
|||
| Province | Infection prevalenceFootnote a (% positive, 95% CI) |
|||||||||||
|---|---|---|---|---|---|---|---|---|---|---|---|---|
| Anaplasma phagocytophilum | Babesia microti | Babesia odocoilei | ||||||||||
| Adult | Nymph | Total | Adult | Nymph | Total | Adult | Nymph | Total | ||||
| Ixodes pacificus | ||||||||||||
| British Columbia | 1/9 (11.1, 0.3–48.2) |
1/58 (1.7, 0.0–9.2) |
2/67 (3.0, 0.4–10.4) |
0/9 (0.0, 0.0–33.6) |
0/58 (0.0, 0.0–6.2) |
0/67 (0.0, 0.0–5.4) |
0/9 (0.0, 0.0–33.6) |
3/58 (5.2, 1.1–14.4) |
3/67 (4.5, 0.9–12.5) |
|||
| Ixodes scapularis | ||||||||||||
| Manitoba | 0/10 (0.0, 0.0–30.8) |
0/2 (0.0, 0.0–84.2) |
0/12 (0.0, 0.0–26.5) |
0/10 (0.0, 0.0–30.8) |
0/2 (0.0, 0.0–84.2) |
0/12 (0.0, 0.0–26.5) |
2/10 (20.0, 2.5–55.6) |
0/2 (0.0, 0.0–84.2) |
2/12 (16.7, 2.1–48.4) |
|||
| Ontario | 27/676 (4.0, 2.6–5.8) |
7/223 (3.1, 1.3–6.4) |
34/899 (3.8, 2.6–5.2) |
0/676 (0.0, 0.0–0.5) |
0/223 (0.0, 0.0–1.6) |
0/899 (0.0, 0.0–0.4) |
32/676 (4.7, 3.3–6.6) |
18/223 (8.1, 4.9–12.5) |
50/899 (5.6, 4.2–7.3) |
|||
| Québec | 2/113 (1.8, 0.2–6.2) |
13/668 (1.9, 1.0–3.3) |
15/781 (1.9, 1.1–3.1) |
0/113 (0.0, 0.0–3.2) |
4/668 (0.6, 0.2–1.5) |
4/781 (0.5, 0.1–1.3) |
18/113 (15.9, 9.7–24.0) |
104/668 (15.6, 12.9–18.5) |
122/781 (15.6, 13.1–18.4) |
|||
| New Brunswick | 2/16 (12.5, 1.6–38.3) |
3/40 (7.5, 1.6–10.4) |
5/56 (8.9, 3.0–19.6) |
0/16 (0.0, 0.0–20.6) |
0/40 (0.0, 0.0–8.8) |
0/56 (0.0, 0.0–6.4) |
4/16 (25.0, 7.3–52.4) |
9/40 (22.5, 10.8–38.5) |
13/56 (23.2, 13.0–36.4) |
|||
| Nova Scotia | 0/73 (0.0, 0.0–4.9) |
3/163 (1.8, 0.4–5.3) |
3/236 (1.3, 0.3–3.7) |
0/73 (0.0, 0.0–4.9) |
1/163 (0.6, 0.0–3.4) |
1/236 (0.4, 0.0–2.3) |
11/73 (15.1, 7.8–25.4) |
13/163 (8.0, 4.3–13.3) |
24/236 (10.2, 6.6–14.8) |
|||
| Total | 31/888 (3.5, 2.4–4.9) |
26/1,096 (2.4, 1.6–3.5) |
57/1,984 (2.9, 2.2–3.7) |
0/888 (0.0, 0.0–0.4) |
5/1,096 (0.5, 0.1–1.1) |
5/1,984 (0.3, 0.1–0.6) |
67/888 (7.5, 5.9–9.5) |
144/1,096 (13.1, 11.2–15.3) |
211/1,984 (10.6, 9.3–12.1) |
|||
Among I. pacificus, B. burgdorferi (1.2%, 95% CI: 0.0–6.5), A. phagocytophilum (3.0%, 95% CI: 0.4–10.4) and B. odocoilei (4.5%, 95% CI: 0.9–12.5) were found (Table 6). The site locations where I. scapularis and I. pacificus were collected in active surveillance and the pathogens detected therein are shown in Figure 3 and Figure 4.

Figure 3: Descriptive text
This map shows the locations where Ixodes scapularis ticks infected with Borrelia burgdorferi or Anaplasma phagocytophilum were found in active surveillance. Both were found in ticks in British Columbia, Ontario, Québec, New Brunswick and Nova Scotia.

Figure 4: Descriptive text
This map shows the locations where Ixodes scapularis ticks infected with Powassan virus, Borrelia miyamotoi, Babesia microti or Babesia odocoilei were found in active surveillance. Powassan virus was found in a tick in Québec. Borrelia miyamotoi was found in ticks in Ontario and Québec. Babesia microti was found in ticks in Québec and Nova Scotia. Babesia odocoilei was found in British Columbia, Ontario, Québec, New Brunswick and Nova Scotia.
Discussion
This annual summary provides an update on the characteristics, geographic distribution, and pathogen prevalence of I. scapularis and I. pacificus in Canada, previously analyzed in 2021 (unpublished data). In 2022, a total of 7,941 I. pacificus and I. scapularis were submitted through passive surveillance from 10 provinces and one territory.
Compared to 2021, infection prevalence estimates from passive surveillance for all pathogens tested are slightly higher across both tick species Footnote 12. Seven I. pacificus tested positive for B. burgdorferi from British Columbia (1.1% which is similar to the prevalence reported in 2021) (0.9%, 95% CI: 0.4–1.8). For I. scapularis, the prevalence of pathogens ranged from 0% to 22.7%, with B. burgdorferi being the most prevalent. A somewhat higher prevalence of I. scapularis infected with B. burgdorferi (22.7%, 95% CI: 19.1–26.5) was recorded in 2022 compared to 2021 (18.6%, 95% CI: 17.2–20.1).
Pathogen testing for passive surveillance specimens identified two distinct types of co-infections in Québec (A. phagocytophilum and B. burgdorferi; B. burgdorferi and B. miyamotoi), both of which have been reported in previous years Footnote 6Footnote 7. Adult ticks had a higher prevalence of infection across all pathogens except A. phagocytophilum; however, it is important to note that there was a considerably larger number of adult ticks collected and tested compared to nymphs in passive surveillance.
Passive surveillance data showed that tick life stage and month of collection continued to follow similar patterns as previous years Footnote 6Footnote 7; for example, a higher proportion of submitted ticks were adult females and found on human hosts. Furthermore, I. scapularis adult submissions showed a bimodal distribution in the month of collection with peaks occurring in May and October. This distribution has been consistently demonstrated to occur in Central and Eastern Canada through previous reports Footnote 6Footnote 7Footnote 18Footnote 19Footnote 20. Ixodes pacificus tick submissions were also consistent with previous reports, showing a large peak across April and May and a considerably smaller peak in November Footnote 6Footnote 7Footnote 15. These bimodal peaks reflect when ticks are most active due to suitable weather conditions. It is well recognized that Lyme disease symptom onset occurs around seasons where ticks are most active Footnote 9Footnote 21Footnote 22. In addition, tick engorgement, which reflects the ticks’ feeding activity, is slightly different compared to previous years, with adult female and nymphal I. scapularis showing a higher proportion of engorgement compared to previous years. This may also be due to the higher proportion of image-based submissions where engorgement data are missing.
Active surveillance data in 2022 identified six tick-borne pathogens (A. phagocytophilum, B. burgdorferi, B. miyamotoi, B. microti, B. odocoilei, Powassan virus) among the I. scapularis collected in Manitoba, Ontario, Québec, New Brunswick and Nova Scotia. The most prevalent pathogen was B. burgdorferi (24.4%, 95% CI: 22.5–26.4). The least prevalent pathogen was Powassan virus and was only identified in Québec. In contrast, three tick-borne pathogens (A. phagocytophilum, B. burgdorferi and B. odocoilei) were identified among I. pacificus collected in British Columbia.
Infection prevalence determined through active surveillance was comparable to previous years with slight differences depending on the pathogen Footnote 6Footnote 7Footnote 12. For example, the total prevalence for B. burgdorferi in I. scapularis increased from 22.3% in 2021 to 24.4% in 2022. To highlight, ticks in Ontario had a lower B. burgdorferi infection prevalence in 2022 (27.4%) compared to 2021 (29.3%), while ticks in Québec had a higher prevalence (18.4% in 2022 and 15.9% in 2021). A. phagocytophilum had a lower total infection prevalence in 2022 (2.9%) compared to 2021 (4.3%). Babesia microti had a higher total infection prevalence in 2022 compared to previous years. Finally, B. odocoilei had the highest infection prevalence in New Brunswick (23.2%) followed by Manitoba (16.7%) and Québec (15.6%). Infection prevalence should be interpreted with caution due to the varying number of ticks tested between provinces and years. Other factors that influence infection prevalence estimates from year-to-year or between provinces include variation in sites selected and their ecological and host-related characteristics Footnote 23.
Strengths and limitations
In 2022, there were fewer pathogen testing data available for ticks collected through passive surveillance compared to previous years. This was in part due to the gradual discontinuation of passive surveillance programs over time; however, active surveillance data continued to provide standardized information on infection prevalence across Canada, with a larger number of sites and enhanced efforts to span more areas. Available passive surveillance data continued to provide comprehensive geographic and temporal information on I. scapularis and I. pacificus.
Other limitations included missing data across several tick characteristics such as life stage, which made interannual comparisons challenging. Furthermore, possible recall bias may have introduced uncertainty to existing passive surveillance data including tick location and date of collection. The annual variation in pathogen testing, including differing sample size and inconsistent surveillance site selection, reduced comparability of infection prevalence estimates. As additional annual data become available, interannual comparisons will be completed using appropriate statistical methods; therefore, comparisons to previous years were purely descriptive and did not assess statistical significance. Finally, this report provides an overview of tick surveillance across Canada but may not include all tick surveillance activities conducted in the country.
Conclusion
Tick surveillance data in 2022 continued to highlight the characteristics of two important TBD vectors in Canada; I. scapularis and I. pacificus. Borrelia burgdorferi continued to be the most prevalent pathogen particularly in I. scapularis. The collection and spatiotemporal data, as well as infection prevalence data, were similar to previous years with slight increases or decreases depending on the pathogen and province.
These findings support public health initiatives such as public education on tick bite prevention and TBD risk area identification. Surveillance activity helps identify stable or shifting trends in pathogen prevalence or geographic distribution, especially as factors such as climate change and resulting expanding tick habitats are expected to continue to affect future tick and pathogen dynamics. Thus, continued investment in tick surveillance and prevention strategies will remain essential to reduce the burden of tick-borne disease on public health and the healthcare system.
Authors' statement
-
GW — Formal analysis, writing−original draft, writing−review & editing
SA — Visualization, writing−review & editing
CW — Writing−review & editing
HC — Writing-review & editing
JS — Writing−review & editing
MN — Writing−review & editing
KCronin — Writing−review & editing
PZ — Writing−review & editing
KT — Writing−review & editing
KCrandall — Writing−review & editing
PG — Writing−review & editing
LS — Writing−review & editing
EJ — Writing−review & editing
MM — Writing−review & editing
CH — Writing−review & editing
MKL — Writing−review & editing
PB — Writing−review & editing
ACB — Writing−review & editing
SG — Conceptualization, supervision, writing−review & editing
Competing interests
None.
ORCID numbers
None.
Acknowledgements
We thank all those involved with tick collection and testing at regional, provincial, and national levels, including and members of the public who submitted ticks. We thank the Canadian Lyme Disease Research Network (CLyDRN) for their oversight and provision of their active surveillance data. In addition to co-author J Savage, the composition of the team involved in collection and processing of eTick data included several students as well as the following people: C Jardine (Department of Pathobiology, Ontario Veterinary College (OVC), University of Guelph, Guelph, ON); K Clow (Department of Population Medicine, OVC, University of Guelph, Guelph, ON); M Kulkarni (School of Epidemiology and Public Health, University of Ottawa, Ottawa, ON); J Nocera (Faculty of Forestry and Environmental Management, University of New Brunswick, Fredericton, NB); S Heard (Department of Biology, University of New Brunswick, Fredericton, NB); E Jenkins (Department of Veterinary Microbiology, Western College of Veterinary Medicine, University of Saskatchewan, Saskatoon, SK); D Shutler, K Hillier (Department of Biology, Acadia University, Wolfville, NS); J Bowden (Atlantic Forestry Centre, Canadian Forest Service, Natural Resources Canada, Corner Brook, NL); K Rochon (Department of Entomology, University of Manitoba, Winnipeg, MB). In Saskatchewan, we acknowledge P Curry, B Heisler, S Minkova and M Jarque.
Funding
This study was supported by the Public Health Agency of Canada (PHAC). Passive surveillance from British Columbia was supported by the BC Centre for Disease Control Foundation. Passive and active surveillance in Saskatchewan is partially funded by the Government of Saskatchewan. Passive and active surveillance from Québec was supported by the Ministère de la Santé et des Services sociaux (MSSS). The Canadian Lyme Disease Research Network’s (CLyDRN) Canadian Lyme Sentinel Network (CaLSeN) is funded by Canadian Institutes of Health Research and the PHAC. The eTick platform is funded by the Infectious Disease and Climate Change Fund of PHAC.
