
COVID-19 Vaccination Coverage Survey (CVCS): Cycle 1 full report
On this page
- About the first cycle
- Highlights
- Response rate
- Intent to get vaccinated against COVID-19 in the territorial capitals
- Reasons for non-vaccination against COVID-19
- Knowledge, attitudes and beliefs
- Trusted sources of information about COVID-19 vaccines
- To summarize
- To be continued
About the first cycle
The first cycle of the COVID-19 Vaccination Coverage Survey (CVCS) targets all adults 18 years of age and older living in the capital cities of the Yukon (Whitehorse), Northwest Territories (Yellowknife) and Nunavut (Iqaluit). In the territories, Statistics Canada usually surveys residents from small communities outside of the capitals through home visits. Due to the COVID-19 pandemic, surveying in small communities outside the capitals was not possible.
Highlights
- Cycle 1 of CVCS was conducted in March-April 2021 in the capitals of the 3 territories.
- 80% of residents in the 3 capitals were already vaccinated against COVID-19, while 16% were likely to get vaccinated and 4% were unlikely to get vaccinated.
- Individuals with university education or higher, and those with an annual income of more than $60,000 were more likely to have received at least one dose of a COVID-19 vaccine.
- The majority of residents of territorial capitals are confident that COVID-19 vaccines are safe (87%) and effective (88%).
Response rate
| Cycle 1 | Sample size (n): | Response rate (%): |
|---|---|---|
| All 3 capitals | 1,025 | 38 |
| Whitehorse (Yukon) | 476 | 55 |
| Yellowknife (Northwest Territories) | 407 | 46 |
| Iqaluit (Nunavut) | 142 | 15Footnote * |
- *
-
The low response rate and sample size for Nunavut will limit the availability of results.
Intent to get vaccinated against COVID-19 in the territorial capitals
Respondents were asked whether they intended to get vaccinated against COVID-19. This allows to better understand the uptake of COVID-19 vaccines in the territorial capitals.
Overall, individuals were more likely to get vaccinated than to not get vaccinated; only 4% of the residents in the 3 capitals did not intend on getting vaccinated against COVID-19.
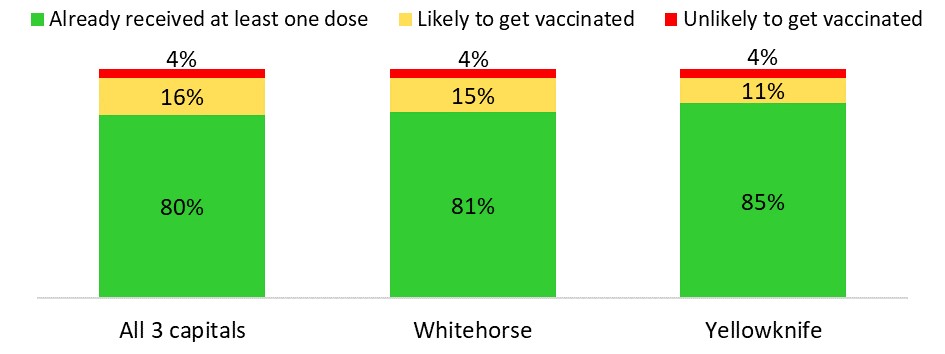
Note: Results for Iqaluit (Nunavut) is not included since number of respondents in this capital is insufficient to produce reliable results.
Figure 1: Text description
Percentage of individuals 18 years old or older who intended to get vaccinated against COVID-19 in all 3 capitals, and in Whitehorse and Yellowknife, March-April 2021
| Capital | Already received at least one dose | Non-vaccinated | |
|---|---|---|---|
| Likely to get vaccinated | Unlikely to get vaccinated | ||
| All 3 capitals | 80 | 16 | 4 |
| Whitehorse | 81 | 15 | 4 |
| Yellowknife | 85 | 11 | 4 |
Key results by socio-demographic factors
The intent to receive COVID-19 vaccines may be associated with socio-demographic factors such as level of education and household income. The next section shows how intent of getting vaccinated against COVID-19 varies with these factors in all territorial capitals.
By level of education
The proportion of individuals who were unlikely to get vaccinated against COVID-19 was higher in those with secondary education or less.
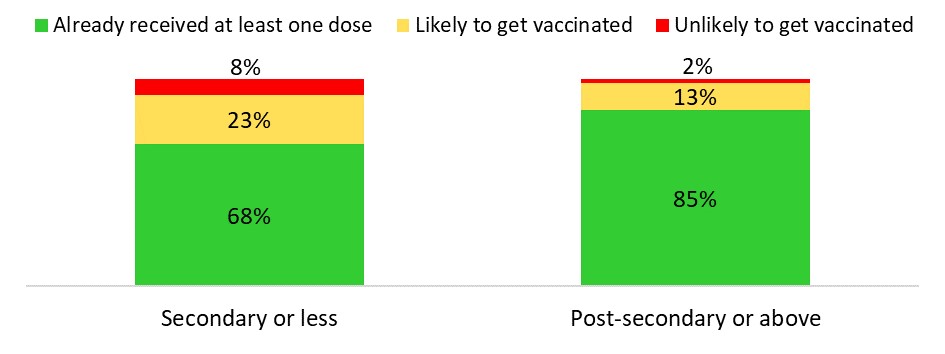
Figure 2: Text description
Percentage of individuals 18 years old or older who intended to get vaccinated against COVID-19 in all 3 capitals by level of education, March-April 2021
| Level of education | Already received at least one dose | Non-vaccinated | |
|---|---|---|---|
| Likely to get vaccinated | Unlikely to get vaccinated | ||
| Secondary or less | 68 | 23 | 8 |
| Post-secondary or above | 85 | 13 | 2 |
By household income
The proportion of residents of the territorial capitals who are unlikely to get vaccinated was higher in those with household income of less than $60,000 comparing to the higher income groups.

Figure 3: Text description
Percentage of individuals 18 years old or older who intended to get vaccinated against COVID-19 in all territorial capitals by household income, March-April 2021
| Household income | Already received at least one dose | Non-vaccinated | |
|---|---|---|---|
| Likely to get vaccinated | Unlikely to get vaccinated | ||
| < $60,000 | 69 | 21 | 10 |
| $60,000 to <$120,000 | 83 | 15 | 2 |
| ≥ $120,000 | 85 | 12 | 2 |
Reasons for non-vaccination against COVID-19
- The most common reason across all adults for not getting their COVID-19 vaccine was they do not want to be vaccinated at this time (24%).
- Almost one fifth of residents of the territorial capitals stated that they have an appointment in the future (19%).
- The top reasons among those who do not want to be vaccinated at this time and those who do not want to be vaccinated at all (7%) include:
- I do not trust the safety of the COVID-19 vaccines.
- I am not at high risk of getting COVID-19.
- I do not trust the effectiveness of the COVID-19 vaccines.
Knowledge, attitudes and beliefs
To better understand the factors influencing decisions on vaccination, respondents were asked about their views regarding COVID-19 vaccine and vaccines in general (Table 2).
- The majority of residents of territorial capitals are confident that COVID-19 vaccines are safe (87%) and effective (88%) in preventing the disease.
- Most of residents of territorial capitals believe that vaccines in general are safe (95%) and effective (97%) in protecting people.
- However, 18% distrusts COVID-19 vaccines because they were developed too quickly and 26% believe that physical distancing, frequent handwashing and wearing a mask are enough to protect themselves from the disease.
| Statement | Percentage of residents of territorial capitals who agree or strongly agree with |
|---|---|
| Vaccines in general | |
| In general, vaccines are safe | 95% |
| In general, vaccines are effective in protecting people from disease | 97% |
| I am confident that Canada's regulation process approves vaccines only if they are safe and effective | 94% |
| COVID-19 vaccines | |
| I am confident that COVID-19 vaccines are safe | 87% |
| I am confident that COVID-19 vaccines are effective in preventing the disease | 88% |
| By being vaccinated against COVID-19, I am protecting myself from the disease | 93% |
| By being vaccinated against COVID-19, I am helping to protect the health of others in my community | 94% |
| I distrust COVID-19 vaccines because they were developed too quickly | 18% |
| Only those at risk of becoming seriously ill from COVID-19 need to be vaccinated | 12% |
| It is better to develop immunity from having COVID-19 rather than from a vaccine | 11% |
| Physical distancing, frequent handwashing and wearing a mask are enough to protect me from COVID-19 | 26% |
| Those who have had COVID-19 do not need to be vaccinated | 10% |
| The severity of the pandemic has been overstated | 20% |
Trusted sources of information about COVID-19 vaccines
To measure the performance of vaccination campaigns and design future vaccination programs, respondents were asked about their trusted sources of information regarding COVID-19 vaccines (Table 3).
- The most trusted sources of information about the COVID-19 vaccines are the Public Health Agency of Canada and Health Canada (89%), and provincial, territorial or regional health authorities (85%).
- Less than one fifth of residents of territorial capitals trust vaccine information from friends or family (19%), and 11% believe the information from alternative health providers.
| Sources of information | Percentage of residents of territorial capitals trusting each source |
|---|---|
| Public Health Agency of Canada and Health Canada | 89% |
| Provincial, territorial or regional health authorities | 85% |
| Health scientists and researchers | 74% |
| World Health Organization (WHO) | 72% |
| My physician | 67% |
| Other healthcare professionals | 57% |
| Pharmaceutical companies producing the COVID-19 vaccines | 36% |
| Friends or family | 19% |
| Other people's experience or knowledge | 19% |
| Alternative health providers | 11% |
| Other source | 8% |
To summarize
The majority (80%) of the population eligible for vaccination had received at least one dose, and less than half (39%) were fully vaccinated. About three quarters of the unvaccinated residents of territorial capitals intended to get vaccinated against COVID-19.
To be continued
Data collection for Cycle 2 of the CVCS in the 10 provinces was completed on May 12, 2021. The survey results will be available in late June or July 2021.
For more information about the COVID-19 Vaccination Coverage Survey, please contact us at: phac.coverage-couvertures.aspc@canada.ca.
For more information about COVID-19 vaccines
- Vaccines for COVID-19
- COVID-19 in Canada
- Canada’s vaccine supply and donation strategy
- Reported side effects following COVID-19 vaccination in Canada
- The facts about COVID-19 vaccines
- Publications: Vaccines and immunization