
Housing inequalities in Canada
Download in PDF format
(760 KB, 2 page)
Organization: Public Health Agency of Canada
Date published: 2022-07-07
Housing is a basic human need that not only provides shelter to provide safety from the outside world and a place to share with family and friends, but is also an important determinant of health.
Three key indicators related to housing inequalities include:
- living with a core housing need1
- experiencing at least one neighbourhood issue reported as a big problem2
- at least one lifetime experience of homeless3
The indicators combine considerations such as income, affordability, neighbourhood dynamics, and dimensions of homelessness.
The proportion of adults living in core housing need is:
- 2.0 times higher among adults who have lower than high school education than among adults who are university graduates. This inequality is more prominent among women4.
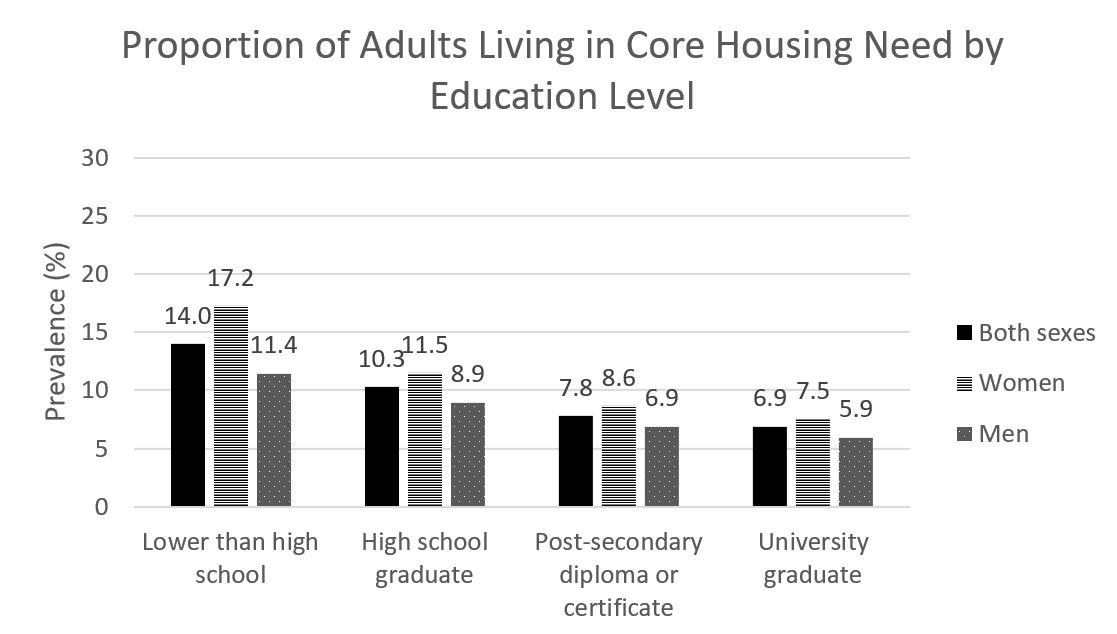
Table 1: Proportion of Adults Living in Core Housing Need by Education Level
| Both sexes | Females | Males | |
| Lower than high school | 14.0 | 17.2 | 11.4 |
| High school graduate | 10.3 | 11.5 | 8.9 |
| Post secondary diploma or certificate | 7.8 | 8.6 | 6.9 |
| University graduate | 6.9 | 7.5 | 5.9 |
- 3.1 times higher among adults who are unemployed than among adults who are employed.
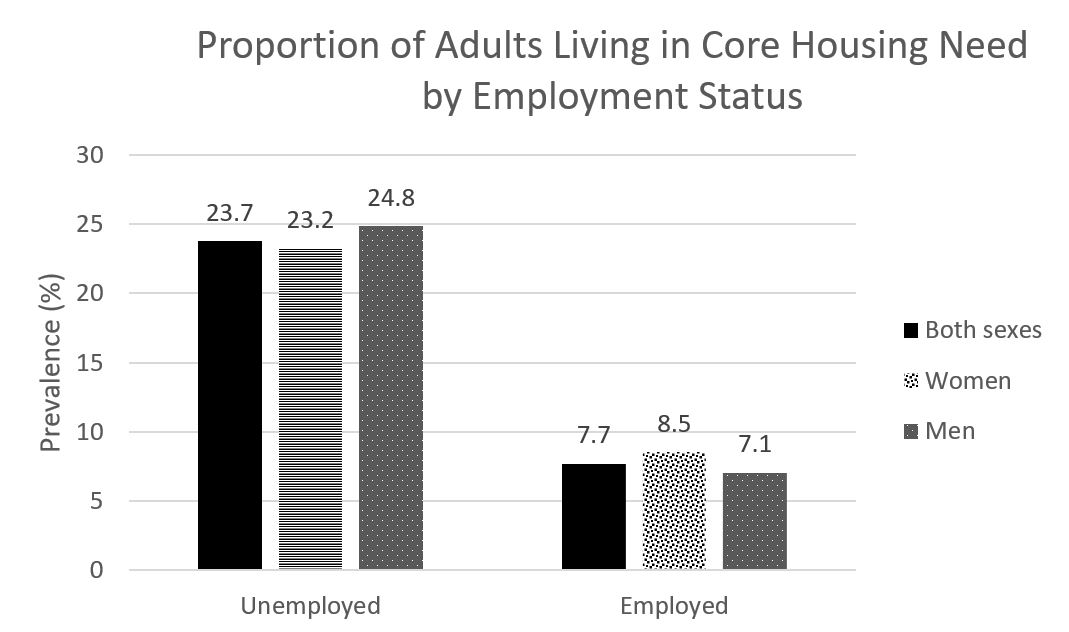
Table 2: Proportion of Adults Living in Core Housing Need by Employment Status
| Both sexes | Females | Males | |
| Unemployed | 23.7 | 23.2 | 24.8 |
| Employed | 7.7 | 8.5 | 7.1 |
- 3.4 times higher among adults who are separated or divorced or widowed and 3.3 times higher among who have never been married than adults who are married. This inequality is more prominent among women.

Table 3: Proportion of Adults Living in Core Housing Need by Marital Status
| Both sexes | Females | Males | |
| Married | 6.3 | 5.0 | 8.2 |
| Living common-law | 7.0 | 6.8 | 7.3 |
| Never married | 20.5 | 21.2 | 19.5 |
| Separated/divorced/ widowed | 21.3 | 24.2 | 15.1 |
Reporting at least one neighbourhood issue as a big problem might be experienced by Canadians in all socioeconomic groups but is particularly concentrated among those with the lowest socioeconomic status.
The proportion of adults experiencing at least one neighbourhood issue reported as a big problem is:
- 1.5 times higher among adults who have lower than high school education than among adults who are university graduates.
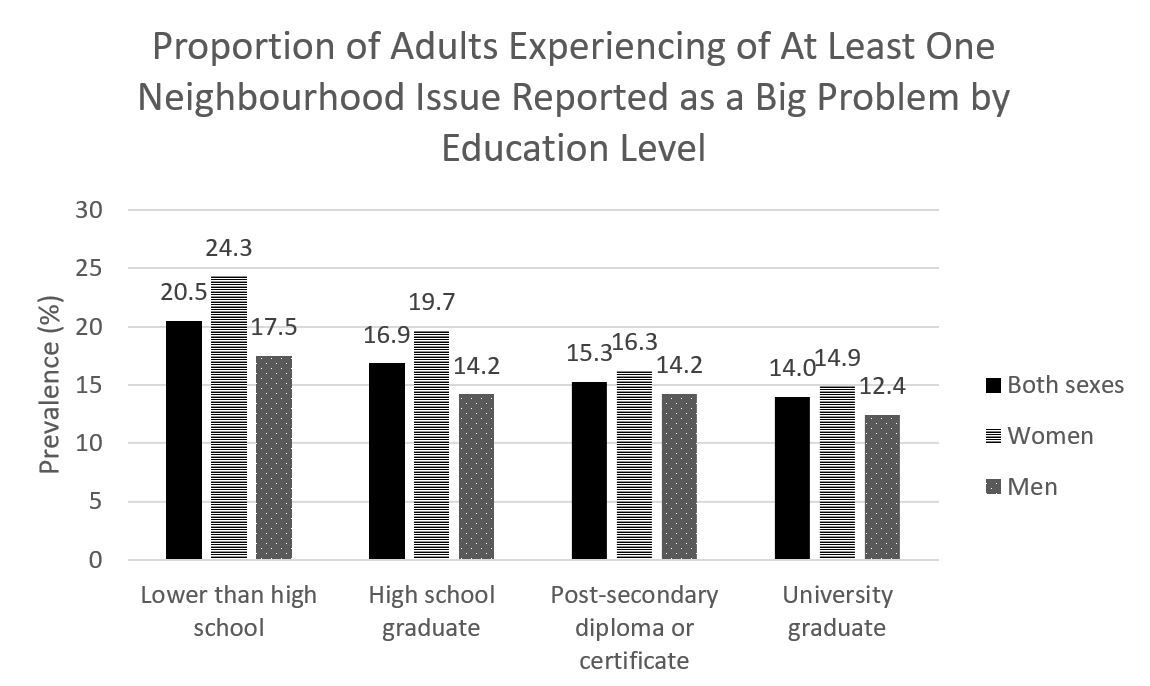
Table 4: Proportion of Adults Experiencing of At Least One Neighbourhood Issue Reported as a Big Problem by Education Level
| Both sexes | Females | Males | |
| Lower than high school | 20.5 | 24.3 | 17.5 |
| High school graduate | 16.9 | 19.7 | 14.2 |
| Post secondary diploma or certificate | 15.6 | 16.3 | 14.2 |
| University graduate | 14.0 | 14.9 | 12.4 |
- 1.4 times higher among adults who are unemployed than among adults who are employed.
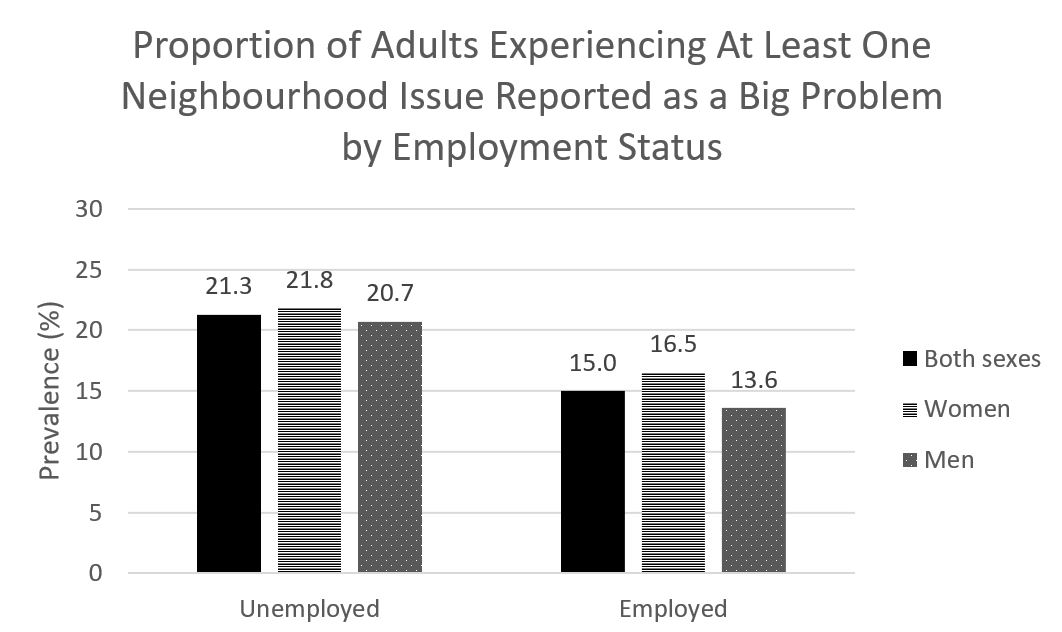
Table 5: Proportion of Adults Experiencing At Least One Neighbourhood Issue Reported as a Big Problem by Employment Status
| Both sexes | Females | Males | |
| Both sexes | Women | Men | |
| Unemployed | 21.3 | 21.8 | 20.7 |
| Employed | 15.0 | 16.5 | 13.6 |
- 2.3 times higher among adults in the lowest income group than among adults in the highest income group5.
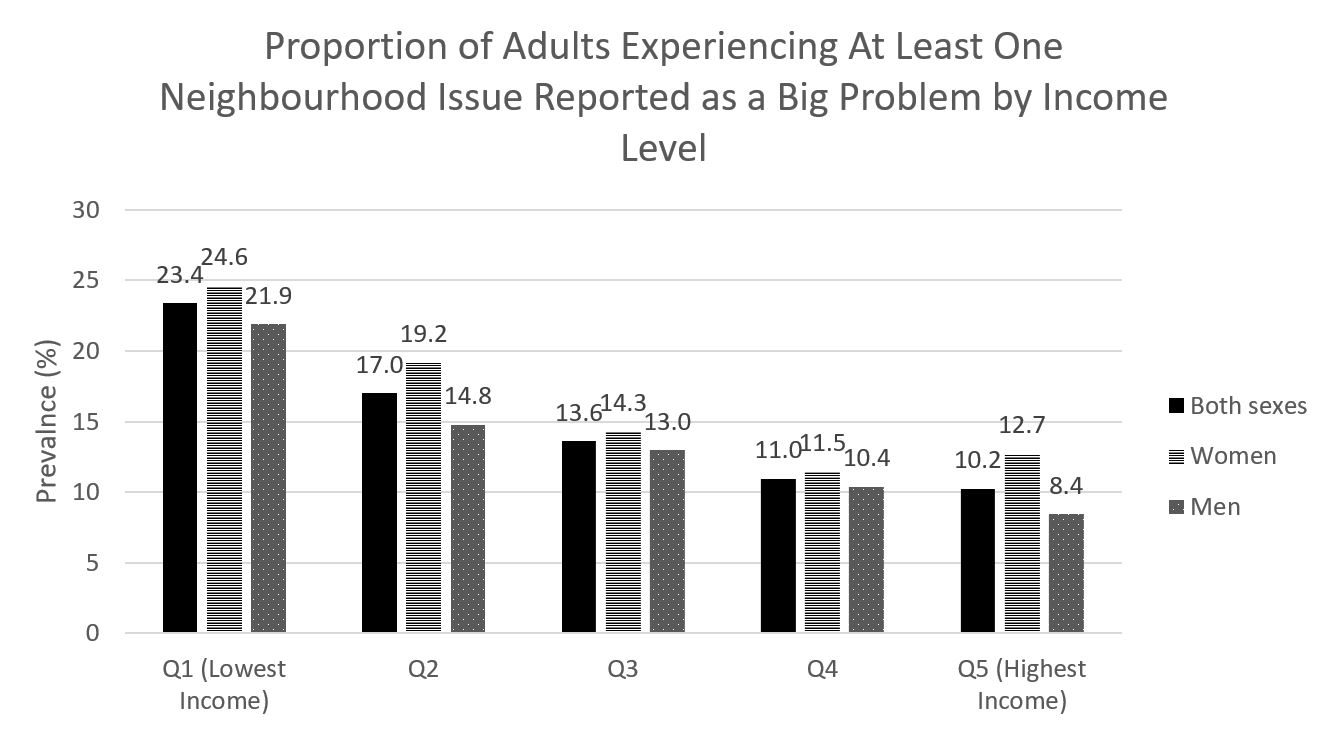
Table 6: Proportion of Adults Experiencing At Least One Neighbourhood Issue Reported as a Big Problem by Income Level
| Both sexes | Females | Males | |
| Q1 | 23.4 | 24.6 | 21.9 |
| Q2 | 17.0 | 19.2 | 14.8 |
| Q3 | 13.6 | 14.3 | 13.0 |
| Q4 | 11.0 | 11.5 | 10.4 |
| Q5 | 10.2 | 12.7 | 8.4 |
Experience of having ever been homeless might be reported by Canadians in all socioeconomic groups but is particularly concentrated among those with the lowest socioeconomic status.
The proportion of adults who have ever been homeless is:
- 6.1 times higher among adults who have lower than high school education than among adults who are university graduates.
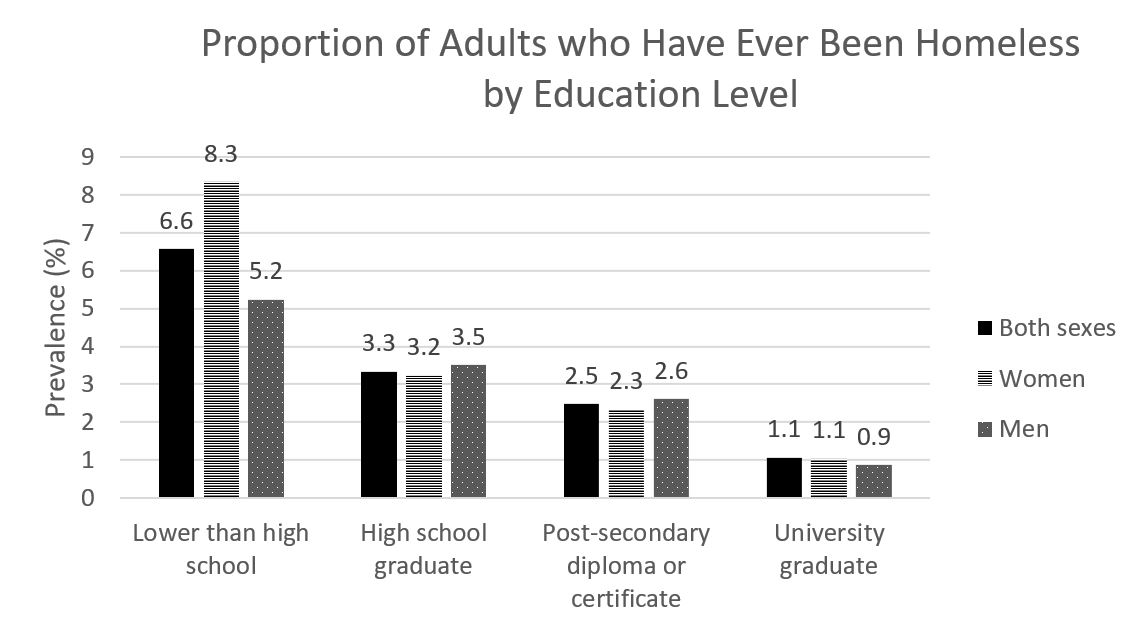
Table 7: Proportion of Adults who Have Ever Been Homeless by Education Level
| Both sexes | Females | Males | |
| Lower than high school | 6.6 | 8.3 | 5.2 |
| High school graduate | 3.3 | 3.2 | 3.5 |
| Post secondary diploma or certificate | 2.5 | 2.3 | 2.6 |
| University graduate | 1.1 | 1.1 | 0.9 |
- 3.2 times higher among adults who are unemployed than among adults who are employed.

Table 8: Proportion of Adults who Have Ever Been Homeless by Employment Status
| Both sexes | Females | Males | |
| Unemployed | 5.7 | 5.6 | 5.6 |
| Employed | 1.8 | 1.7 | 1.8 |
Understanding and exploring the inequalities within these housing indicators allows for future research and policy development to reduce inequalities.
For more data on health inequalities in Canada, visit: https://health-infobase.canada.ca/health-inequalities/data-tool/index
Note: All reported data on infographic are significantly different from reference category.
Source: Canadian Housing Survey (CHS) 2018
- Footnote 1
-
The core housing need indicator is defined as living in unsuitable, inadequate or unaffordable dwelling and not being able to afford alternative housing in the community. http://www.phn-rsp.ca/pubs/ihi-idps/pdf/Indicators-of-Health-Inequalities-Report-PHPEG-Feb-2010-EN.pdf
- Footnote 2
-
Neighbourhood issues being reported as a big problem include noisy neighbours or loud parties, people hanging around on the streets, garbage or litter lying around, vandalism/graffiti/other damage, attacks motivated by race/ethnicity/religion, people using or dealing drugs, people being drunk or rowdy in public, abandoned buildings, smog or air pollution. https://www150.statcan.gc.ca/n1/pub/89-652-x/89-652-x2016002-eng.htm
- Footnote 3
-
The have ever been homeless indicator is defined as an individual that has ever reported being homeless, which includes living in a homeless shelter, on the street, or in parks, in a makeshift shelter or in an abandoned building. https://www150.statcan.gc.ca/n1/pub/75-006-x/2022001/article/00002-eng.htm
- Footnote 4
-
CHS collects gender information: male, female and other. Only the data for "Other" category is suppressed due to small numbers.
- Footnote 5
-
Income was measured using income quintiles. It is derived from the total before-tax household income adjusted for household size.