
Hepatitis in Canada: 2018 surveillance data
Download the alternative format
(PDF format, 236 KB, 1 page)
Organization: Public Health Agency of Canada
Published: 2020-07-28
Hepatitis B
Number and rate of hepatitis B in Canada, 2018
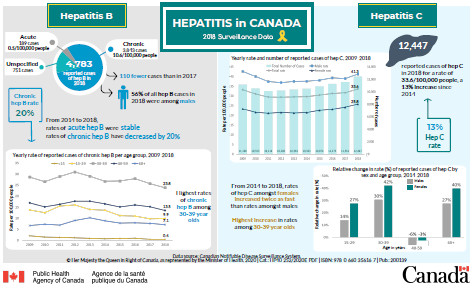
- 4,783 reported cases of hepatitis B in 2018 (110 fewer cases than in 2017).
- Acute hepatitis B: 189 cases for a rate of 0.5 per 100,000 people.
- Chronic hepatitis B: 3,843 cases for a rate of 10.6 per 100,000 people.
- Unspecified: 751 cases.
- 56% of all hepatitis B cases in 2018 were among males.
- From 2014 to 2018, rates of acute hepatitis B were stable, but rates of chronic hepatitis B decreased by 20%.
Rate of chronic hepatitis B per age group, 2018
- The rates of chronic hepatitis B varied by age group:
- 0.4 cases per 100,000 people among those less than 15 years old
- 9.9 per 100,000 in the 15 to 29 age group
- 23.8 per 100,000 in the 30 to 39 age group
- 13.5 per 100,000 in the 40 to 59 age group
- 7.1 per 100,000 among those 60 years old and older
- The highest rates of chronic hepatitis B are among 30 to 39 year olds.
Hepatitis C
Number and rate of hepatitis C in Canada, 2018
- 12,447 reported cases of hepatitis C in 2018 for a rate of 33.6 per 100,000 people (a 13% increase since 2014).
- In 2018, the rate of hepatitis C among males was 41.3 per 100,000 and 25.8 per 100,000 among females.
Rate change of hepatitis C in Canada, 2014 to 2018
- Among 15 to 29 year olds, rates increased by 14% among males and 27% among females.
- Among 30 to 39 year olds, rates increased by 30% among males and 42% among females.
- Among 40 to 59 year olds, rates decreased by 6% among males and 3% among females.
- Among those 60 years old and older, rates increased by 27% among males and 40% among females.
- From 2014 to 2018, female rates increased twice as quickly as male rates.
- Highest increase in rates was among those 30 to 39 years old.
Appendix A: Data tables for hepatitis B and C figures
| Year | <15 years | 15 to 29 years | 30 to 39 years | 40 to 59 years | 60+ years |
|---|---|---|---|---|---|
| 2009 | 2.0 | 13.8 | 28.7 | 16.9 | 6.7 |
| 2010 | 1.4 | 12.5 | 26.5 | 15.2 | 7.3 |
| 2011 | 1.3 | 15.5 | 28.9 | 16.3 | 6.9 |
| 2012 | 1.1 | 16.0 | 31.0 | 17.7 | 9.0 |
| 2013 | 0.9 | 14.0 | 29.0 | 17.7 | 10.2 |
| 2014 | 0.6 | 13.6 | 26.7 | 16.5 | 8.8 |
| 2015 | 0.8 | 11.2 | 26.9 | 15.1 | 7.8 |
| 2016 | 0.9 | 11.0 | 27.9 | 16.0 | 7.9 |
| 2017 | 0.4 | 9.7 | 25.6 | 15.2 | 7.6 |
| 2018 | 0.4 | 9.9 | 23.8 | 13.5 | 7.1 |
| Year | Total number of cases | |||
|---|---|---|---|---|
| Males | Females | Total | ||
| 2009 | 42.6 | 23.3 | 33.2 | 11,168 |
| 2010 | 40.0 | 21.6 | 31.0 | 10,553 |
| 2011 | 37.4 | 21.1 | 29.5 | 10,114 |
| 2012 | 36.9 | 21.5 | 29.4 | 10,206 |
| 2013 | 37.5 | 21.2 | 29.5 | 10,363 |
| 2014 | 37.6 | 21.4 | 29.6 | 10,501 |
| 2015 | 38.1 | 22.6 | 30.5 | 10,874 |
| 2016 | 39.3 | 23.1 | 31.2 | 11,273 |
| 2017 | 38.9 | 24.1 | 31.6 | 11,561 |
| 2018 | 41.3 | 25.8 | 33.6 | 12,447 |
| Age group | 2014 rate (males) | 2018 rate (males) | Rate change (males) | 2014 rate (females) | 2018 rate (females) | Rate change (females) |
|---|---|---|---|---|---|---|
| 15 to 29 years | 34.7 | 39.5 | 14% | 32.0 | 40.8 | 27% |
| 30 to 39 years | 51.9 | 67.7 | 30% | 31.3 | 44.4 | 42% |
| 40 to 59 years | 58.6 | 55.0 | -6% | 27.1 | 26.6 | -3% |
| 60+ years | 31.1 | 39.6 | 27% | 13.9 | 19.5 | 40% |