
Hepatitis B in Canada: 2020 surveillance data update
Download the alternative format
(PDF format, 1982 KB, 1 page)
Organization: Public Health Agency of Canada
Published: 2023-03-03
Impact of the COVID-19 pandemic on reported hepatitis B case counts and rates in 2020
The COVID-19 pandemic reduced the demand for and access to services related to sexually transmitted and blood-borne infections, including testingFootnote 1. This likely impacted new hepatitis B diagnosis rates in 2020, by artificially reducing them. As parts of the country experienced different levels of disruptions due to COVID-19 during 2020, comparisons of hepatitis B case counts and rates between the provinces and territories may also be inaccurate.
Hepatitis B
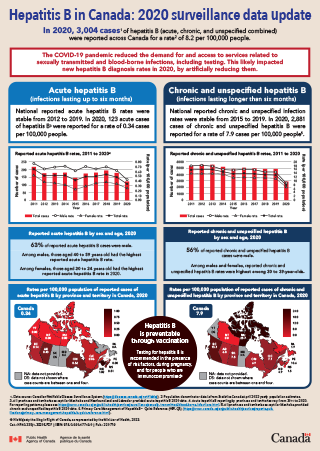
In 2020, 3,004 cases of hepatitis B (acute, chronic, and unspecified cases combined) were reported from 12 provinces and territoriesFootnote 2Footnote 3 for a rate of 8.2 cases per 100,000 people
Acute hepatitis B (infections lasting up to six months)
Figure 1 shows the number and rates of reported acute hepatitis B from 2011 to 2020. The trends in this figure are described below:
- In 2020, a total of 123 acute hepatitis B cases (56 fewer than in 2019) were reported from 11 provinces and territoriesFootnote 2 for a rate of 0.34 cases per 100,000 people
- From 2011 to 2012, the total reported acute hepatitis B rate dropped
- From 2012 to 2019, total reported acute hepatitis B rates were mostly stable
- From 2019 to 2020, the total reported acute hepatitis B rate dropped by 30.6%
Acute hepatitis B by sex and age group
Figure 1 shows the number and rates of reported acute hepatitis B from 2011 to 2020 and Table 4 summarizes the number of cases, rates, and proportions of acute hepatitis B by age and sex reported in 2020. The trends in this figure and in this table are described below:
- In 2020, 62.6% of reported acute hepatitis B cases were male
- In 2020, the rate of reported acute hepatitis B among males was 0.43 cases per 100,000 males, and the rate among females was 0.25 cases per 100,000 females
- In 2020, among males, those aged 40 to 59 years had the highest reported acute hepatitis B rate at 0.80 cases per 100,000 males 40 to 59 years old
- In 2020, among females, those aged 20 to 24 years had the highest reported acute hepatitis B rate at 0.44 cases per 100,000 females 20 to 24 years old
- In 2020, among males, the largest proportion of reported acute hepatitis B cases was among males aged 40 to 59 years (49.4%)
- In 2020, among females, the largest proportion of reported acute hepatitis B cases was among females aged 40 to 59 years (43.5%)
- From 2011 to 2020, reported acute hepatitis B rates were higher among males than females
- Among males:
- from 2011 to 2012, rates of reported acute hepatitis B declined
- from 2012 to 2019, rates of reported acute hepatitis B fluctuated but were stable overall
- from 2019 to 2020, the reported acute hepatitis B rate dropped by 30.6%
- Among females:
- from 2011 to 2015, rates of reported acute hepatitis B declined
- from 2016 to 2018, rates of reported acute hepatitis B increased
- from 2018 to 2019, the reported acute hepatitis B rate declined slightly by 9.0%
- from 2019 to 2020, the reported acute hepatitis B rate dropped by 26.5%
Note: Acute hepatitis B reporting differed by province and territory from 2011 to 2020. See Appendix B for provincial and territorial acute hepatitis B reporting patterns.
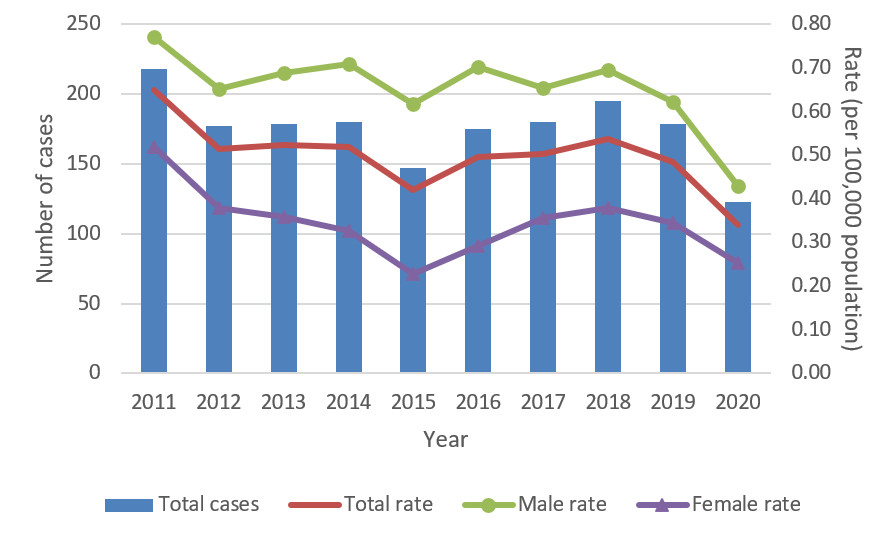
Figure 1 - Text description
| Year | Total cases | Male cases | Female cases | Total rate (per 100,000 population of Canada) |
Male rate (per 100,000 males) |
Female rate (per 100,000 females) |
|---|---|---|---|---|---|---|
| 2011 | 218 | 128 | 88 | 0.65 | 0.77 | 0.52 |
| 2012 | 177 | 111 | 66 | 0.51 | 0.65 | 0.38 |
| 2013 | 179 | 117 | 62 | 0.52 | 0.69 | 0.36 |
| 2014 | 180 | 122 | 57 | 0.52 | 0.71 | 0.33 |
| 2015 | 147 | 107 | 40 | 0.42 | 0.62 | 0.23 |
| 2016 | 175 | 123 | 52 | 0.50 | 0.70 | 0.29 |
| 2017 | 180 | 116 | 64 | 0.50 | 0.65 | 0.36 |
| 2018 | 195 | 125 | 69 | 0.54 | 0.70 | 0.38 |
| 2019 | 179 | 114 | 64 | 0.49 | 0.62 | 0.34 |
| 2020 | 123 | 77 | 46 | 0.34 | 0.43 | 0.25 |
|
National annual acute hepatitis B rates were calculated using the number of acute hepatitis B cases from the Canadian Notifiable Disease Surveillance System as numerators and Statistics Canada April 2022 yearly population estimates as denominators. |
||||||
Acute hepatitis B by province and territory
In 2020, the national reported acute hepatitis B rate was 0.34 cases per 100,000 people. Provinces and territories that had rates of reported acute hepatitis B above the national rate included:
- New Brunswick (1.02 cases per 100,000 population)Footnote 4 (eight cases of acute hepatitis B in 2020)
- Ontario (0.52 cases per 100,000 population)
- Nova Scotia (0.51 cases per 100,000 populationFootnote 4 (five cases of acute hepatitis B in 2020)
- Alberta (0.43 cases per 100,000 population)
In 2020, provinces and territories with rates of reported acute hepatitis B below the national rate included:
- Saskatchewan (DS cases per 100,000 population)
- British Columbia (0.14 cases per 100,000 population)
- Quebec (0.06 cases per 100,000 population)
- Prince Edward Island (0.00 cases per 100,000 population)
- Yukon (0.00 cases per 100,000 population)
- Northwest Territories (0.00 cases per 100,000 population)
- Nunavut (0.00 cases per 100,000 population)
DS: Data not shown where case counts are between one and four, inclusive.
In 2020, Manitoba and Newfoundland and Labrador did not provide acute hepatitis B surveillance data.
- In 2020, the greatest proportion of reported acute hepatitis B cases came from Ontario (62.6%), followed by Alberta (15.4%) and New Brunswick (6.5%)
Chronic and unspecified hepatitis B (infections lasting longer than six months)
Figure 2 shows the number and rates of reported chronic and unspecified hepatitis B from 2011 to 2020. The trends in this figure are described below:
- In 2020, a total of 2,881 (1,996 fewer than in 2019) chronic and unspecified hepatitis B cases were reported by 12 provinces and territoriesFootnote 3 for a rate of 7.9 cases per 100,000 people
- From 2011 to 2013, the total reported chronic and unspecified hepatitis B rates were stable
- From 2013 to 2015, the total reported chronic and unspecified hepatitis B rates declined
- From 2015 to 2019, the total reported chronic and unspecified hepatitis B rates were stable
- From 2019 to 2020, the total reported chronic and unspecified hepatitis B rate dropped by 39.2%
Chronic and unspecified hepatitis B by sex and age group
Figure 2 shows the number and rates of reported chronic and unspecified hepatitis B from 2011 to 2020 and Table 6 summarizes the number of cases, rates, and proportions of chronic and unspecified hepatitis B by age and sex reported in 2020. The trends in this figure and in this table are described below:
- In 2020, 55.8% of reported chronic and unspecified hepatitis B cases were male
- In 2020, the rate of reported chronic and unspecified hepatitis B among males was 8.8 cases per 100,000 males, and the rate among females was 6.7 cases per 100,000 females
- In 2020, among males, those aged 30 to 39 years had the highest reported chronic and unspecified hepatitis B rate at 17.8 cases per 100,000 males 30 to 39 years old
- In 2020, among females, those aged 30 to 39 years had the highest reported chronic and unspecified hepatitis B rate at 16.2 cases per 100,000 females 30 to 39 years old
- In 2020, among males, the largest proportion of reported chronic and unspecified hepatitis B cases was among those aged 40 to 59 years (41.7%)
- In 2020, among females, the largest proportion of reported chronic and unspecified hepatitis B cases was among those aged 30 to 39 years (33.2%)
- From 2011 to 2020, reported chronic and unspecified hepatitis B rates were higher among males than females
- Among males:
- from 2011 to 2013, the rates of reported chronic and unspecified hepatitis B were stable
- from 2013 to 2014, the rate of reported chronic and unspecified hepatitis B declined
- from 2014 to 2017, the rates of reported chronic and unspecified hepatitis B were stable
- from 2017 to 2019, the rates of reported chronic and unspecified hepatitis B declined
- from 2019 to 2020, the reported chronic and unspecified hepatitis B rate dropped by 39.3%
- Among females:
- from 2011 to 2014, the rates of reported chronic and unspecified hepatitis B were stable
- from 2014 to 2015, the rate of reported chronic and unspecified hepatitis B declined
- from 2015 to 2019, the rates of reported chronic and unspecified hepatitis B were stable
- from 2019 to 2020, the reported chronic and unspecified hepatitis B rate dropped by 40.7%
Note: Chronic and unspecified hepatitis B subtype reporting differed by province and territory from 2011 to 2020. See Appendix B for provincial and territorial chronic and unspecified hepatitis B reporting patterns.
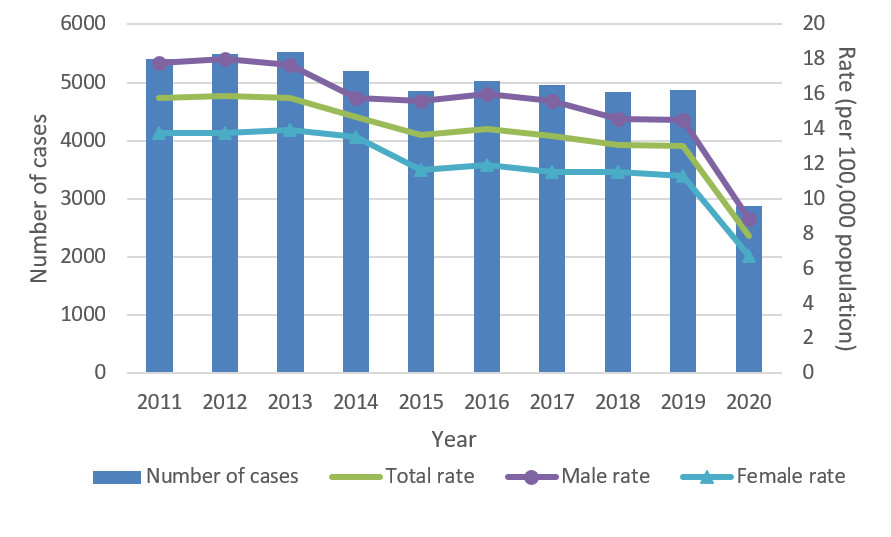
Figure 2 - Text description
| Year | Total cases (n) | Male cases (n) | Female cases (n) | Total rate (per 100,000 population of Canada) | Male rate (per 100,000 males) | Female rate (per 100,000 females) |
|---|---|---|---|---|---|---|
| 2011 | 5404 | 3015 | 2379 | 15.8 | 17.8 | 13.8 |
| 2012 | 5500 | 3088 | 2406 | 15.9 | 18.0 | 13.8 |
| 2013 | 5527 | 3065 | 2458 | 15.8 | 17.7 | 13.9 |
| 2014 | 5193 | 2769 | 2415 | 14.7 | 15.8 | 13.6 |
| 2015 | 4861 | 2757 | 2089 | 13.7 | 15.6 | 11.6 |
| 2016 | 5029 | 2854 | 2165 | 14.0 | 16.0 | 11.9 |
| 2017 | 4951 | 2822 | 2119 | 13.6 | 15.6 | 11.5 |
| 2018 | 4835 | 2672 | 2144 | 13.1 | 14.6 | 11.5 |
| 2019 | 4877 | 2698 | 2136 | 13.0 | 14.5 | 11.3 |
| 2020 | 2881 | 1608 | 1240 | 7.9 | 8.8 | 6.7 |
|
National annual chronic and unspecified hepatitis B rates were calculated using the number of chronic and unspecified hepatitis B cases reported to the Canadian Notifiable Disease Surveillance System as numerators and Statistics Canada April 2022 yearly population estimates as denominators. |
||||||
Reported chronic and unspecified hepatitis B by province and territory
In 2020, the national rate of chronic and unspecified hepatitis B was 7.9 cases per 100,000 people. Provinces and territories that had rates of chronic and unspecified hepatitis B above the national rate included:
- Nunavut (25.7 cases per 100,000 population)Footnote 4 (there were ten cases)
- British Columbia (15.1 cases per 100,000 population)
- Prince Edward Island (10.6 cases per 100,000 population)Footnote 4 (there were 17 cases)
In 2020, provinces and territories with rates of chronic and unspecified hepatitis B below the national rate included:
- Saskatchewan (7.5 cases per 100,000 population)
- Quebec (7.1 cases per 100,000 population)
- Ontario (6.9 cases per 100,000 population)
- Alberta (6.8 cases per 100,000 population)
- New Brunswick (4.9 cases per 100,000 population)
- Yukon (DS per 100,000 population)
- Nova Scotia (1.5 cases per 100,000 population)
- Newfoundland and Labrador (1.9 cases per 100,000 population)
- Northwest Territories (0.0 cases per 100,000 population)
DS: Data not shown where case counts are between one and four, inclusive.
In 2020, Manitoba did not provide chronic and unspecified hepatitis B data.
In 2020, the greatest proportion of reported chronic and unspecified hepatitis B cases came from Ontario (35.1%), followed by British Columbia (27.0%) and Quebec (21.1%).
Hepatitis B public health messaging
- Hepatitis B is preventable through vaccination
- Testing for hepatitis B is recommended in the presence of risk factors, during pregnancy, and for people who are immunocompromised (see Primary Care Management of Hepatitis B – Quick Reference (HBV-QR) - Canada.ca)
Appendix A: Data tables corresponding to described hepatitis B information
| Hepatitis B disease status | Number of cases | Rate per 100,000 population |
|---|---|---|
| Acute | 123 | 0.34 |
| Chronic | 2,375 | 6.6 |
| Unspecified | 506 | 2.4 |
| Total | 3,004 | 8.2 |
National annual rates of reported acute, chronic, and unspecified hepatitis B were computed using the number of acute, chronic, and unspecified hepatitis B cases from the Canadian Notifiable Disease Surveillance System as numerators and Statistics Canada April 2022, 2020, population estimates as denominators. |
||
| Age group (years) | Males | Females | Total | ||||||
|---|---|---|---|---|---|---|---|---|---|
| Cases (n) | Rate (per 100,000 males) | Proportion of all male cases | Cases (n) | Rate (per 100,000 females) | Proportion of all female cases | Cases (n) | Rate (per 100,000 population) | Proportion of all reported cases | |
| <15 | 2 | 0.07 | 2.6% | 0 | 0.00 | 0.0% | 2 | 0.04 | 1.6% |
| 15 to 19 | 1 | 0.10 | 1.3% | 1 | 0.10 | 2.2% | 2 | 0.10 | 1.6% |
| 20 to 24 | 4 | 0.32 | 5.2% | 5 | 0.44 | 10.9% | 9 | 0.38 | 7.3% |
| 25 to 29 | 3 | 0.23 | 3.9% | 3 | 0.24 | 6.5% | 6 | 0.24 | 4.9% |
| 30 to 39 | 12 | 0.47 | 15.6% | 6 | 0.24 | 13.0% | 18 | 0.36 | 14.6% |
| 40 to 59 | 38 | 0.80 | 49.4% | 20 | 0.41 | 43.5% | 58 | 0.61 | 47.2% |
| ≥60 | 17 | 0.41 | 22.1% | 11 | 0.23 | 23.9% | 28 | 0.32 | 22.8% |
National reported acute hepatitis B age rates by sex and overall were computed using the number of acute hepatitis B cases reported to the Canadian Notifiable Disease Surveillance System as numerators and Statistics Canada April 2022, 2020, population estimates as denominators. |
|||||||||
| Jurisdiction | Cases (n) | Rate (per 100,000 population) | Proportion of all reported acute hepatitis B cases |
|---|---|---|---|
| Canada | 123 | 0.34 | 100.0% |
| British Columbia | 7 | 0.14 | 5.7% |
| Alberta | 19 | 0.43 | 15.4% |
| Saskatchewan | DS | DS | DS |
| Manitoba | NA | NA | NA |
| Ontario | 77 | 0.52 | 62.6% |
| Quebec | 5 | 0.06 | 4.1% |
| Newfoundland and Labrador | NA | NA | NA |
| Prince Edward Island | 0 | 0.00 | 0.0% |
| Nova Scotia | 5 | 0.51 | 4.1% |
| New Brunswick | 8 | 1.02 | 6.5% |
| Yukon | 0 | 0.00 | 0.0% |
| Northwest Territories | 0 | 0.00 | 0.0% |
| Nunavut | 0 | 0.00 | 0.0% |
Provincial and territorial annual acute hepatitis B rates were calculated using the number of acute hepatitis B cases reported to the Canadian Notifiable Disease Surveillance System as numerators and Statistics Canada April 2022, 2020, population estimates as denominators. |
|||
| Age group (years) | Males | Females | Total | ||||||
|---|---|---|---|---|---|---|---|---|---|
| Cases (n) | Rate (per 100,000 males) | Proportion of all male cases | Cases (n) | Rate (per 100,000 females) | Proportion of all female cases | Cases (n) | Rate (per 100,000 population) | Proportion of all reported cases | |
| <15 | 11 | 0.4 | 0.7% | 8 | 0.3 | 0.6% | 19 | 0.3 | 0.7% |
| 15 to 19 | 17 | 1.6 | 1.1% | 10 | 1.0 | 0.8% | 27 | 1.3 | 0.9% |
| 20 to 24 | 50 | 4.0 | 3.1% | 56 | 4.9 | 4.5% | 109 | 4.5 | 3.8% |
| 25 to 29 | 122 | 9.2 | 7.6% | 118 | 9.5 | 9.6% | 243 | 9.5 | 8.5% |
| 30 to 39 | 456 | 17.8 | 28.4% | 409 | 16.2 | 33.2% | 873 | 17.2 | 30.4% |
| 40 to 59 | 670 | 13.9 | 41.7% | 401 | 8.2 | 32.6% | 1086 | 11.2 | 37.9% |
| ≥60 | 279 | 6.6 | 17.4% | 229 | 4.8 | 18.6% | 511 | 5.7 | 17.8% |
National reported chronic and unspecified hepatitis B age rates by sex and overall were computed using the number of chronic and unspecified hepatitis B cases reported to the Canadian Notifiable Disease Surveillance System as numerators and Statistics Canada April 2022, 2020, population estimates as denominators. |
|||||||||
| Jurisdiction | Cases (n) | Rate per 100,000 population | Proportion of all reported chronic and unspecified hepatitis B cases |
|---|---|---|---|
| Canada | 2881 | 7.9 | 100.0% |
| British Columbia | 779 | 15.1 | 27.0% |
| Alberta | 301 | 6.8 | 10.4% |
| Saskatchewan | 88 | 7.5 | 3.1% |
| Manitoba | NA | NA | NA |
| Ontario | 1012 | 6.9 | 35.1% |
| Quebec | 609 | 7.1 | 21.1% |
| Newfoundland and Labrador | 10 | 1.9 | 0.3% |
| Prince Edward Island | 17 | 10.6 | 0.6% |
| Nova Scotia | 15 | 1.5 | 0.5% |
| New Brunswick | 38 | 4.9 | 1.3% |
| Yukon | DS | DS | DS |
| Northwest Territories | 0 | 0.0 | 0.0% |
| Nunavut | 10 | 25.7 | 0.3% |
Provincial and territorial annual chronic and unspecified hepatitis B rates were calculated using the number of chronic and unspecified hepatitis B cases reported to the Canadian Notifiable Disease Surveillance System as numerators and Statistics Canada April 2022, 2020, population estimates as denominators. |
|||
Appendix B: Acute, chronic, and unspecified hepatitis B reporting patterns by province and territory, 2011 to 2020
| PT | 2011 | 2012 | 2013 | 2014 | 2015 | 2016 | 2017 | 2018 | 2019 | 2020 |
|---|---|---|---|---|---|---|---|---|---|---|
| BC | Acute, chronic, and unspecified | |||||||||
| QC | Acute, chronic, and unspecified | |||||||||
| YT | Acute, chronic, and unspecified | |||||||||
| AB | Acute and chronic | Acute, chronic, and unspecified | ||||||||
| MB | Acute and unspecified | Acute, chronic, and unspecified | Did not provide data | |||||||
| NU | Unspecified | Acute, chronic, and unspecified | Acute and unspecified | Unspecified | Acute, chronic, and unspecified | |||||
| NS | Acute, chronic, and unspecified | Acute and chronic | Acute, chronic, and unspecified | Acute and chronic | Acute, chronic, and unspecified | |||||
| SK | Acute and chronic | Acute, chronic, and unspecified | ||||||||
| ON | Acute and chronic | |||||||||
| NB | Acute and chronic | |||||||||
| NT | Acute, chronic, and unspecified | Acute and unspecified | ||||||||
| PE | Unspecified | Acute, chronic, and unspecified | ||||||||
| NL | Unspecified | Acute, chronic, and unspecified | Unspecified | |||||||
PT=province or territory, BC=British Columbia, QC=Quebec, YT=Yukon Territories, AB=Alberta, MB=Manitoba, NU=Nunavut, NS=Nova Scotia, ON=Ontario, NB=New Brunswick, SK=Saskatchewan, NT=Northwest Territories, NL=Newfoundland and Labrador, PE=Prince Edward Island |
||||||||||
Appendix C: List of supplementary tables
Due to the impact of the COVID-19 pandemic on the number of reported hepatitis B cases, a 2020 hepatitis B and C in Canada surveillance report was not prepared by the Public Health Agency of Canada. However, the supplementary tables described below are available upon request via sti-hep-its@phac-aspc.gc.ca.
List of supplementary tables and figures:
- Table 1. Number of reported acute hepatitis B cases among males by age group in Canada, 2011 to 2020
- Table 2. Number of reported acute hepatitis B cases among females by age group in Canada, 2011 to 2020
- Table 3. Reported acute hepatitis B rates (per 100,000 males living in Canada) among males by age group in Canada, 2011 to 2020
- Table 4. Reported acute hepatitis B rates (per 100,000 females living in Canada) among females by age group in Canada, 2011 to 2020
- Table 5. Number of reported acute hepatitis B cases by province or territory in Canada, 2011 to 2020
- Table 6. Reported acute hepatitis B rates (per 100,000 population) by province or territory in Canada, 2011 to 2020
- Table 7. Number of reported acute hepatitis B cases among males by province or territory in Canada, 2011 to 2020
- Table 8. Number of reported acute hepatitis B cases among females by province or territory in Canada, 2011 to 2020
- Table 9. Reported acute hepatitis B rates (per 100,000 population) among males by province or territory in Canada, 2011 to 2020
- Table 10. Reported acute hepatitis B rates (per 100,000 population) among females by province or territory in Canada, 2011 to 2020
- Table 11. Number of reported chronic and unspecified hepatitis B cases among males by age group in Canada, 2011 to 2020
- Table 12. Number of reported chronic and unspecified hepatitis B cases among females by age group in Canada, 2011 to 2020
- Table 13. Reported chronic and unspecified hepatitis B rates (per 100,000 males) among males by age group in Canada, 2011 to 2020
- Table 14. Reported chronic and unspecified hepatitis B rates (per 100,000 females) among females by age group in Canada, 2011 to 2020
- Table 15. Number of reported chronic and unspecified hepatitis B cases by province or territory in Canada, 2011 to 2020
- Table 16. Reported chronic and unspecified hepatitis B rates (per 100,000 population) by province or territory in Canada, 2011 to 2020
- Table 17. Number of reported chronic and unspecified hepatitis B cases among males by province or territory in Canada, 2011 to 2020
- Table 18. Number of reported chronic and unspecified hepatitis B cases among females by province or territory in Canada, 2011 to 2020
- Table 19. Reported chronic and unspecified hepatitis B rates (per 100,000 population) among males by province or territory in Canada, 2011 to 2020
- Table 20. Reported chronic and unspecified hepatitis B rates (per 100,000 population) among females by province or territory in Canada, 2011 to 2020
- Figure 1. Number of reported cases and rates of acute hepatitis B by sex and age group (years) in Canada, 2020
- Figure 2. Number of reported cases and rates of chronic and unspecified hepatitis B by sex and age group (years) in Canada, 2020
- Figure 3. Reported chronic and unspecified hepatitis B rates by sex and age group in Canada, 2011 to 2020
Notes
Observed differences in the data published here and the data published in provincial and territorial surveillance products may be due to reporting delays, differences in the date data were extracted from the provincial and territorial surveillance databases or other reporting variations. Where such differences are noted, it is recommended that data and results from provincial and territorial products be used.
Footnotes
- Footnote 1
-
Public Health Agency of Canada. Survey on the impact of COVID-19 on the delivery of STBBI prevention, testing and treatment, including harm reduction services, in Canada. Ottawa, ON: Public Health Agency of Canada; 2022. Pub.: 210294
- Footnote 2
-
In 2020, Manitoba and Newfoundland and Labrador did not provide acute hepatitis B surveillance data.
- Footnote 3
-
In 2020, Manitoba did not provide chronic and unspecified hepatitis B surveillance data.
- Footnote 4
-
Interpret rate with caution since it was calculated as the number of cases among a smaller population. In such instances, it is best to consider the number of cases reported for the jurisdiction.