
FluWatch report: November 13 to November 19, 2022 (week 46)
Download in PDF format
(2.47 MB, 12 pages)
Organization: Public Health Agency of Canada
Published: 2022-11-25
Related Topics
Weekly Highlights
- At the national level, influenza activity has continued to increase steeply as we enter the fourth week of the national influenza epidemic. Most surveillance indicators are increasing and all are above expected levels typical of this time of year.
Virologic
- In week 46, a total of 5,891 laboratory detections (5,876 influenza A and 15 influenza B) were reported.
- Among subtyped influenza A detections in week 46, 97% (2,213) were influenza A(H3N2) and 3% (73) were influenza A(H1N1).
- Among detections for which age information was reported in week 46 (3,256), 1,605 (49%) of detections were in individuals aged 0-19 years old.
Syndromic
- The percentage of visits for influenza-like illness (ILI) was 2.1% in week 46. The percentage visits for ILI is slightly above levels typical of this time of year.
- The percentage of FluWatchers reporting fever and cough was 2.9% in week 46. The percentage of FluWatchers reporting cough and fever is well above levels typical of this time of year.
Outbreaks
- From August 28, 2022 to November 19, 2022 (weeks 35 to 46), 127 laboratory-confirmed influenza outbreaks have been reported.
Severe Outcomes
- In recent weeks, the IMPACT network has reported a sharp increase in influenza-associated hospitalizations among the pediatric population. Currently, the weekly number of pediatric hospitalizations being reported is above levels typically seen at the peak of the influenza season. In week 46, 205 influenza-associated hospitalizations were reported.
- The highest cumulative hospitalization rates are among children under 5 years of age (26/100,000 population) and adults 65 years of age and older 21/100,000 population).
On this page
- Influenza/Influenza-like Illness Activity - Geographic Spread
- Laboratory-Confirmed Influenza Detections
- Syndromic / Influenza-like Illness Surveillance
- Influenza Outbreak Surveillance
- Influenza Severe Outcomes Surveillance
- Influenza Strain Characterization
- Antiviral Resistance
- Influenza Vaccine Monitoring
- Provincial and International Influenza Reports
Influenza/Influenza-like Illness Activity - Geographic Spread
In week 46, four regions in two provinces (Alta., and Man.) reported widespread activity, 16 regions in six provinces (P.E.I., N.S., N.B., Ont., Sask., and Alta.) reported localized activity and 24 regions in ten provinces and territories reported sporadic influenza activity (N.L., N.S., N.B., Que., Ont., Man., Alta., Y.T., N.W.T., and Nvt.) (Figure 1).
Number of Regions Reporting in Week 46: 49 out of 53
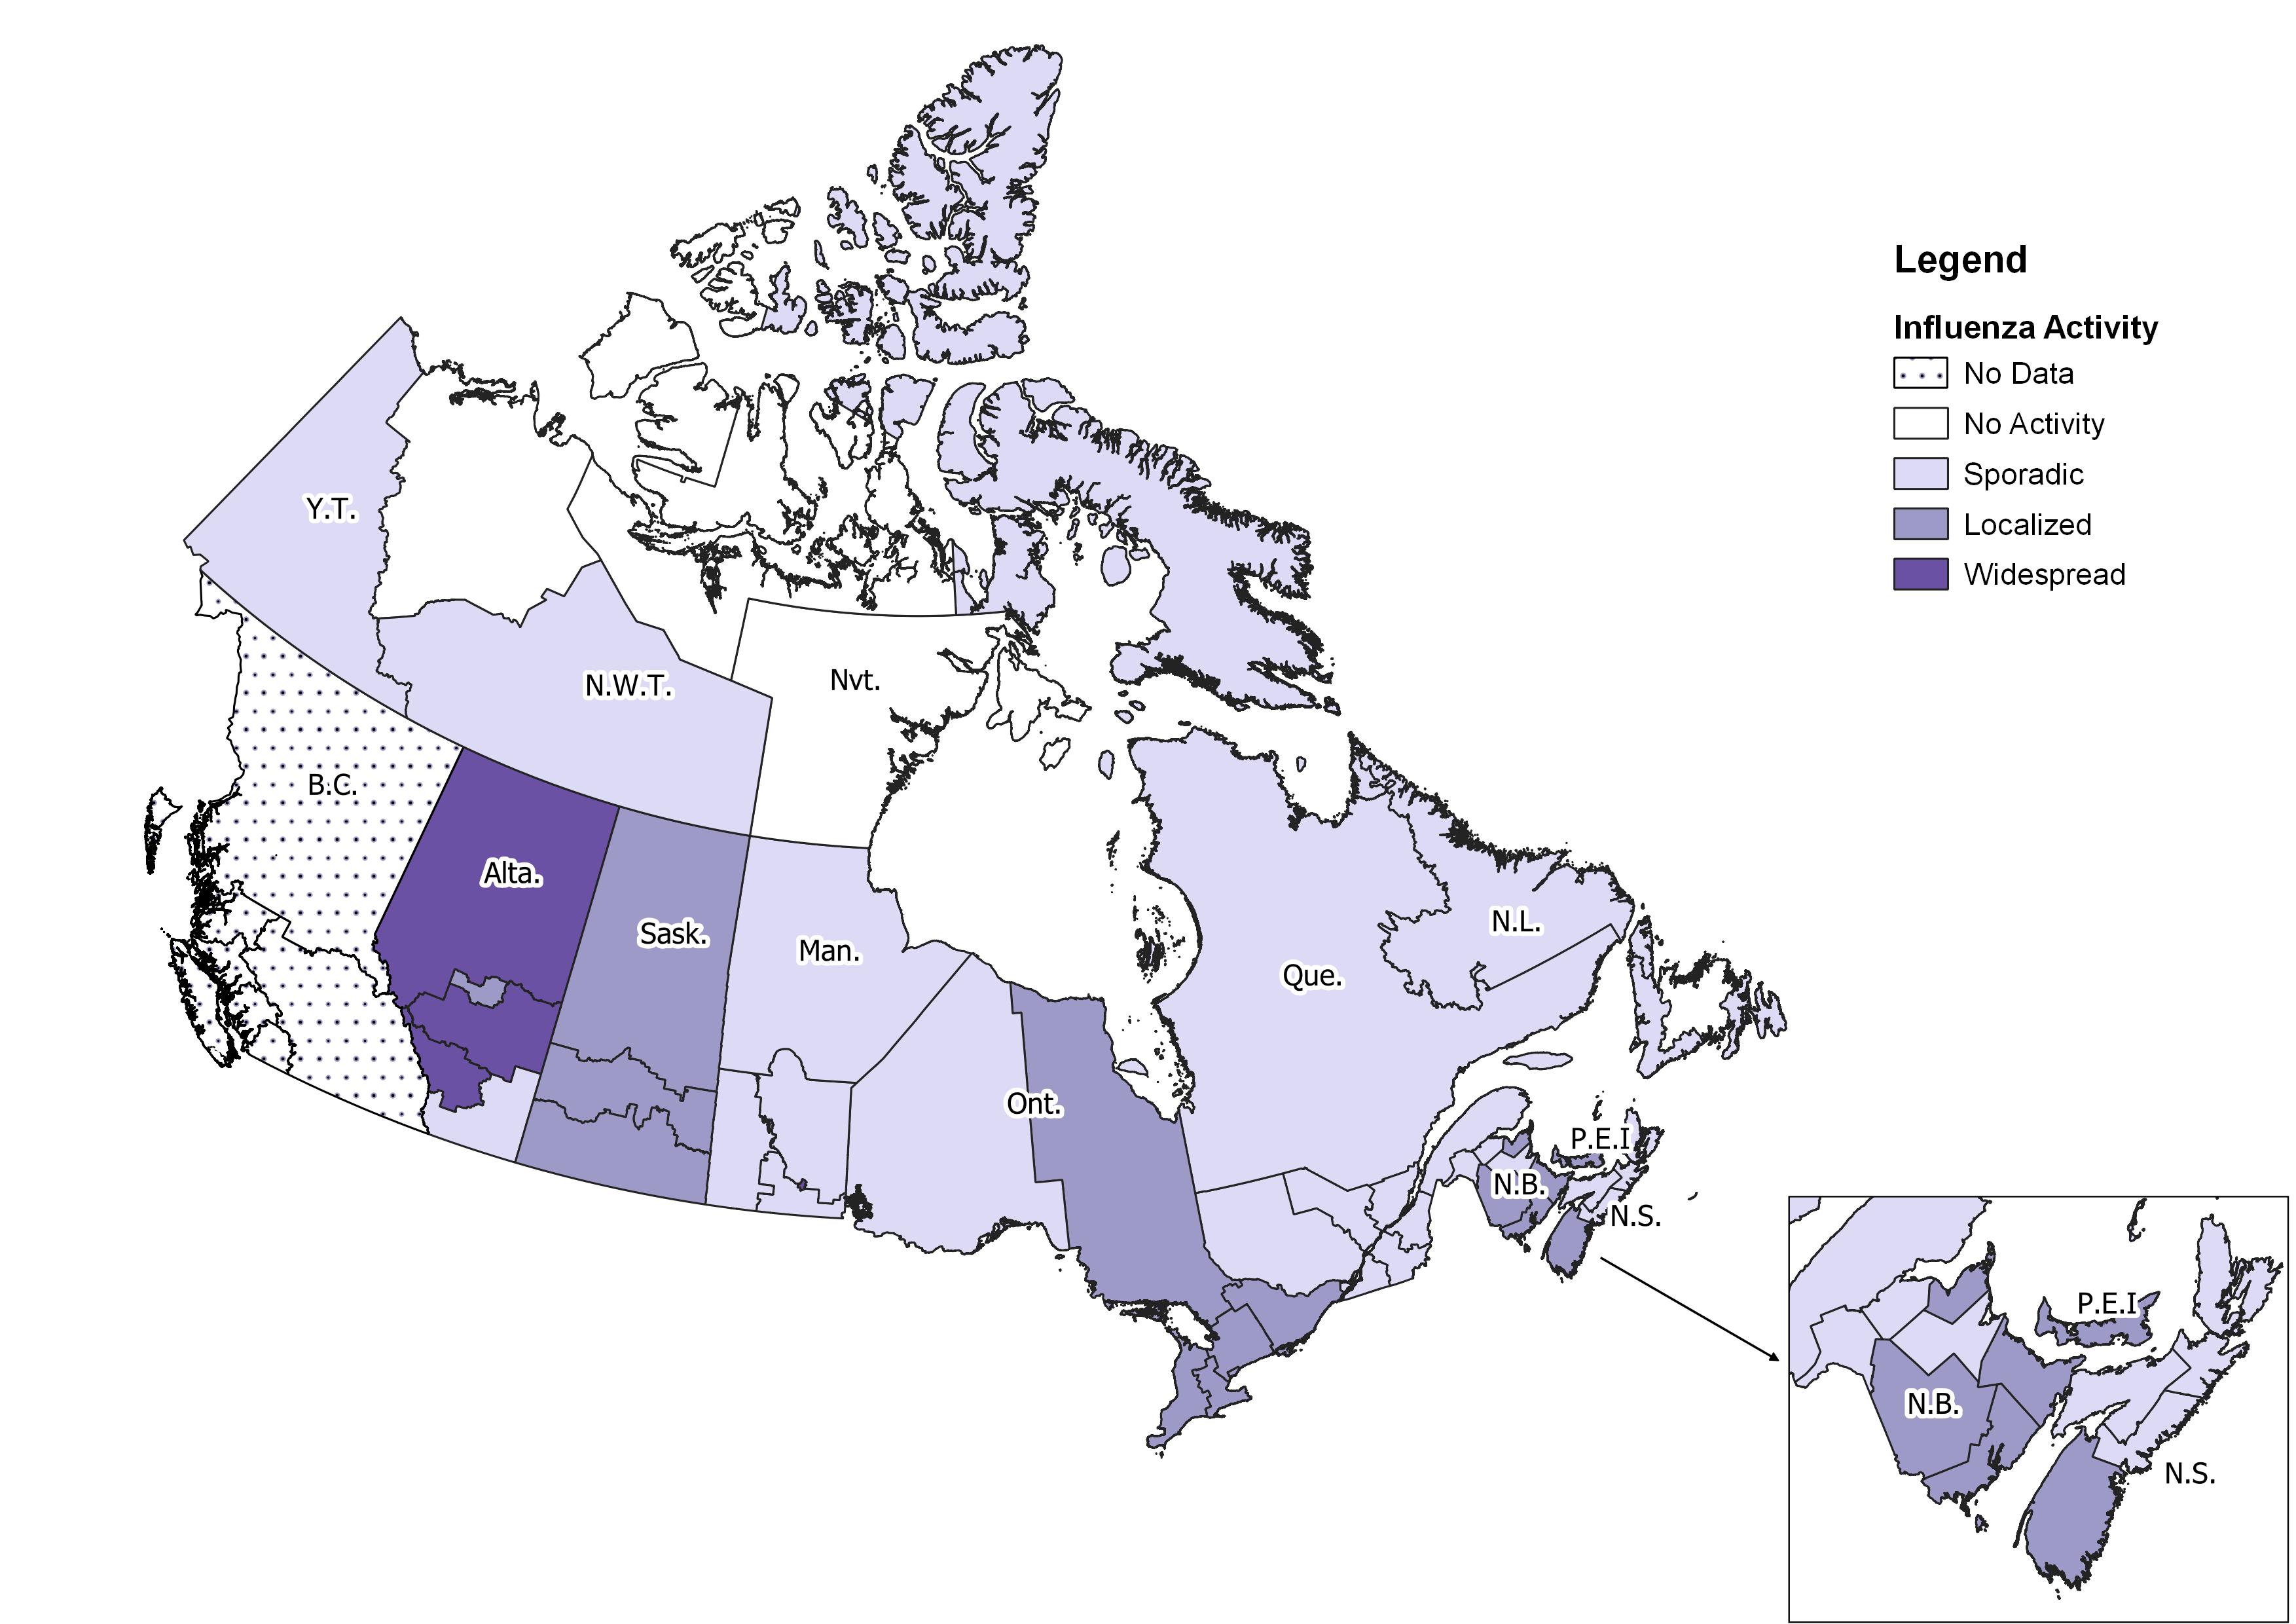
Figure 1 - Text description
| Province | Influenza Surveillance Region | Activity Level |
|---|---|---|
| N.L. | Eastern | Sporadic |
| N.L. | Labrador-Grenfell | Sporadic |
| N.L. | Central | No Activity |
| N.L. | Western | Sporadic |
| P.E.I. | Prince Edward Island | Localized |
| N.S. | Zone 1 - Western | Localized |
| N.S. | Zone 2 - Northern | Sporadic |
| N.S. | Zone 3 - Eastern | Sporadic |
| N.S. | Zone 4 - Central | Sporadic |
| N.B. | Region 1 | Localized |
| N.B. | Region 2 | Localized |
| N.B. | Region 3 | Localized |
| N.B. | Region 4 | Sporadic |
| N.B. | Region 5 | Sporadic |
| N.B. | Region 6 | Localized |
| N.B. | Region 7 | Sporadic |
| Que. | Nord-est | Sporadic |
| Que. | Québec et Chaudieres-Appalaches | Sporadic |
| Que. | Centre-du-Québec | Sporadic |
| Que. | Montréal et Laval | Sporadic |
| Que. | Ouest-du-Québec | Sporadic |
| Que. | Montérégie | Sporadic |
| Ont. | Central East | Localized |
| Ont. | Central West | Localized |
| Ont. | Eastern | Localized |
| Ont. | North East | Localized |
| Ont. | North West | Sporadic |
| Ont. | South West | Localized |
| Ont. | Toronto | Localized |
| Man. | Northern Regional | Sporadic |
| Man. | Prairie Mountain | Sporadic |
| Man. | Interlake-Eastern | Sporadic |
| Man. | Winnipeg | Widespread |
| Man. | Southern Health | Sporadic |
| Sask. | North | Localized |
| Sask. | Central | Localized |
| Sask. | South | Localized |
| Alta. | North Zone | Widespread |
| Alta. | Edmonton | Localized |
| Alta. | Central Zone | Widespread |
| Alta. | Calgary | Widespread |
| Alta. | South Zone | Sporadic |
| B.C. | Interior | No Data |
| B.C. | Fraser | No Data |
| B.C. | Vancouver Coastal | No Data |
| B.C. | Vancouver Island | No Data |
| B.C. | Northern | No Data |
| Y.T. | Yukon | Sporadic |
| N.W.T. | North | No Activity |
| N.W.T. | South | Sporadic |
| Nvt. | Qikiqtaaluk | Sporadic |
| Nvt. | Kivalliq | No Activity |
| Nvt. | Kitimeot | No Activity |
Laboratory-Confirmed Influenza Detections
In week 46, a total of 5,891 laboratory detections (5,876 influenza A and 15 influenza B) were reported as we progress through the 4th week of the national influenza epidemic.
The following results were reported from sentinel laboratories across Canada in week 46 (Figures 2 and 3):- The weekly percentage of tests positive for influenza increased from 16.0% in week 45 to 19.3% in week 46 and is above expected pre-pandemic levels.
- Among subtyped influenza A detections, 97% (2,213) were influenza A(H3N2) and 3% (73) were influenza A(H1N1).
- Among detections for which age information was reported (3,256), 1,605 (49%) of detections were in individuals aged 0-19 years old, a decrease from recent weeks.
To date this season (August 28, 2022 to November 19, 2022):
- 14,455 influenza detections were reported, of which 99% (14,384) were influenza A and among subtyped influenza A detections (7,230), influenza A(H3N2) accounted for 96% of detections.
- 8,541 laboratory-confirmed influenza detections with age information were reported, of which 4,646 (54%) were in individuals aged 0-19 years old (Figure 4).
For more detailed weekly and cumulative influenza data, see the text descriptions for Figures 2 and 3 or the Respiratory Virus Detections in Canada Report.
Number of Laboratories Reporting in Week 46: 34 out of 35
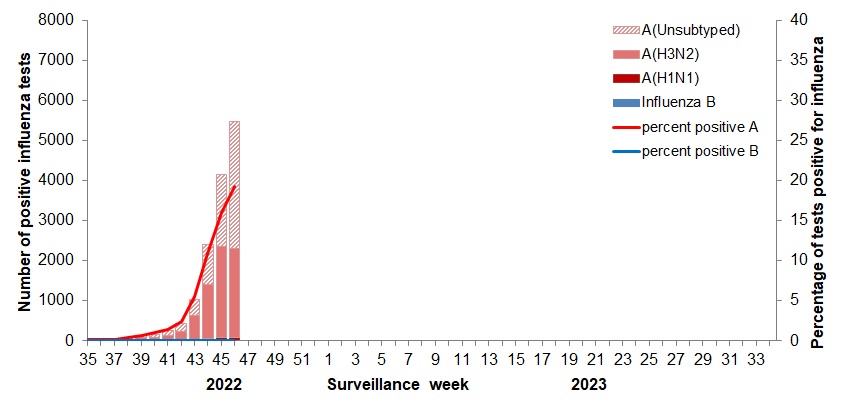
Figure 2 - Text description
| Surveillance Week | A(Unsubtyped) | A(H3N2) | A(H1N1) | Influenza B | Percent Positive A | Percent Positive B |
|---|---|---|---|---|---|---|
| 35 | 12 | 10 | 2 | 3 | 0.2 | 0.0 |
| 36 | 9 | 5 | 1 | 5 | 0.1 | 0.0 |
| 37 | 19 | 9 | 3 | 2 | 0.2 | 0.0 |
| 38 | 26 | 35 | 20 | 3 | 0.5 | 0.0 |
| 39 | 44 | 53 | 22 | 5 | 0.7 | 0.0 |
| 40 | 63 | 66 | 16 | 4 | 1.0 | 0.0 |
| 41 | 120 | 110 | 20 | 1 | 1.5 | 0.0 |
| 42 | 214 | 204 | 11 | 9 | 2.4 | 0.1 |
| 43 | 407 | 595 | 23 | 6 | 5.6 | 0.0 |
| 44 | 995 | 1351 | 54 | 7 | 10.9 | 0.0 |
| 45 | 1799 | 2265 | 69 | 11 | 16.0 | 0.0 |
| 46 | 3159 | 2213 | 73 | 15 | 19.2 | 0.1 |
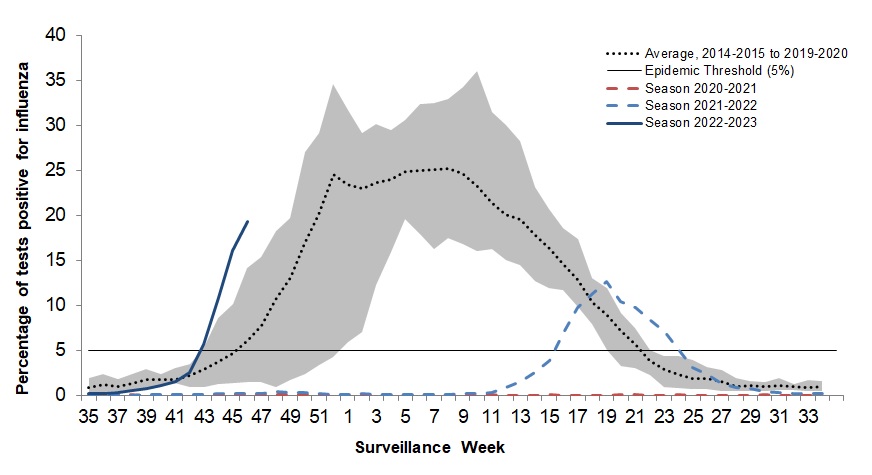
The shaded area represents the maximum and minimum number of influenza tests or percentage of tests positive reported by week from seasons 2014-2015 to 2019-2020. Data from week 11 of the 2019-2020 season onwards are excluded from the historical comparison due to the COVID-19 pandemic.
The epidemic threshold is 5% tests positive for influenza. When it is exceeded, and a minimum of 15 weekly influenza detections are reported, a seasonal influenza epidemic is declared.
Figure 3 - Text description
| Surveillance Week | Percentage of tests positive, 2022-2023 | Percentage of tests positive, 2021-2022 | Percentage of tests positive, 2020-2021 | Maximum Percentage of Tests Positive | Minimum Percentage of Tests Positive | Average Percentage of Tests Positive |
|---|---|---|---|---|---|---|
| 35 | 0.2 | 0.0 | 0.0 | 1.9 | 0.1 | 0.8 |
| 36 | 0.2 | 0.0 | 0.0 | 2.3 | 0.3 | 1.1 |
| 37 | 0.3 | 0.0 | 0.0 | 1.8 | 0.4 | 1.0 |
| 38 | 0.5 | 0.0 | 0.0 | 2.4 | 0.5 | 1.3 |
| 39 | 0.7 | 0.0 | 0.0 | 2.9 | 0.7 | 1.7 |
| 40 | 1.0 | 0.0 | 0.0 | 2.3 | 1.1 | 1.7 |
| 41 | 1.5 | 0.1 | 0.0 | 3.0 | 1.3 | 1.7 |
| 42 | 2.5 | 0.1 | 0.0 | 3.4 | 0.9 | 2.2 |
| 43 | 5.6 | 0.1 | 0.0 | 5.3 | 0.8 | 2.8 |
| 44 | 10.9 | 0.2 | 0.1 | 8.5 | 1.2 | 3.7 |
| 45 | 16.0 | 0.1 | 0.0 | 10.1 | 1.4 | 4.6 |
| 46 | 19.3 | 0.2 | 0.0 | 14.1 | 1.5 | 6.1 |
| 47 | N/A | 0.2 | 0.1 | 15.4 | 1.4 | 7.7 |
| 48 | N/A | 0.3 | 0.1 | 18.2 | 0.8 | 10.6 |
| 49 | N/A | 0.3 | 0.0 | 19.7 | 1.6 | 13.0 |
| 50 | N/A | 0.3 | 0.0 | 27.0 | 2.4 | 16.8 |
| 51 | N/A | 0.2 | 0.0 | 29.1 | 3.3 | 20.1 |
| 52 | N/A | 0.1 | 0.0 | 34.5 | 4.3 | 24.5 |
| 1 | N/A | 0.1 | 0.0 | 31.7 | 5.8 | 23.4 |
| 2 | N/A | 0.1 | 0.0 | 29.1 | 7.1 | 23.0 |
| 3 | N/A | 0.1 | 0.0 | 30.1 | 12.2 | 23.6 |
| 4 | N/A | 0.1 | 0.0 | 29.5 | 15.9 | 24.0 |
| 5 | N/A | 0.0 | 0.0 | 30.6 | 19.6 | 24.9 |
| 6 | N/A | 0.1 | 0.0 | 32.4 | 17.9 | 25.0 |
| 7 | N/A | 0.0 | 0.0 | 32.5 | 16.3 | 25.1 |
| 8 | N/A | 0.1 | 0.0 | 32.9 | 17.5 | 25.1 |
| 9 | N/A | 0.1 | 0.0 | 34.3 | 16.8 | 24.6 |
| 10 | N/A | 0.2 | 0.0 | 36.0 | 16.0 | 23.2 |
| 11 | N/A | 0.3 | 0.0 | 31.4 | 16.2 | 21.4 |
| 12 | N/A | 0.9 | 0.0 | 30.0 | 15.0 | 20.1 |
| 13 | N/A | 1.5 | 0.0 | 28.3 | 14.5 | 19.6 |
| 14 | N/A | 2.5 | 0.0 | 23.2 | 12.7 | 17.9 |
| 15 | N/A | 3.9 | 0.0 | 20.7 | 11.9 | 16.3 |
| 16 | N/A | 7.0 | 0.0 | 18.5 | 11.6 | 14.5 |
| 17 | N/A | 9.7 | 0.0 | 17.3 | 9.8 | 12.8 |
| 18 | N/A | 11.3 | 0.0 | 13.0 | 7.9 | 10.3 |
| 19 | N/A | 12.6 | 0.0 | 11.9 | 5.0 | 9.0 |
| 20 | N/A | 10.4 | 0.0 | 9.1 | 3.2 | 7.2 |
| 21 | N/A | 9.8 | 0.0 | 7.4 | 3.0 | 5.6 |
| 22 | N/A | 8.4 | 0.0 | 5.0 | 2.2 | 3.9 |
| 23 | N/A | 7.0 | 0.0 | 4.4 | 0.9 | 2.9 |
| 24 | N/A | 5.0 | 0.0 | 4.4 | 0.8 | 2.2 |
| 25 | N/A | 3.0 | 0.0 | 3.9 | 0.6 | 1.9 |
| 26 | N/A | 2.3 | 0.0 | 3.1 | 0.7 | 1.8 |
| 27 | N/A | 1.2 | 0.0 | 2.8 | 0.4 | 1.5 |
| 28 | N/A | 0.8 | 0.0 | 1.8 | 0.4 | 0.9 |
| 29 | N/A | 0.7 | 0.0 | 1.6 | 0.5 | 1.1 |
| 30 | N/A | 0.4 | 0.0 | 1.5 | 0.5 | 0.9 |
| 31 | N/A | 0.3 | 0.0 | 1.9 | 0.6 | 1.1 |
| 32 | N/A | 0.2 | 0.0 | 1.2 | 0.5 | 0.9 |
| 33 | N/A | 0.2 | 0.0 | 1.7 | 0.4 | 0.9 |
| 34 | N/A | 0.2 | 0.0 | 1.6 | 0.4 | 0.9 |
Figure 4 - Proportion of positive influenza specimens by type or subtype and age-group reported through case-based laboratory reporting, Canada, week 2022-35 to 2022-46
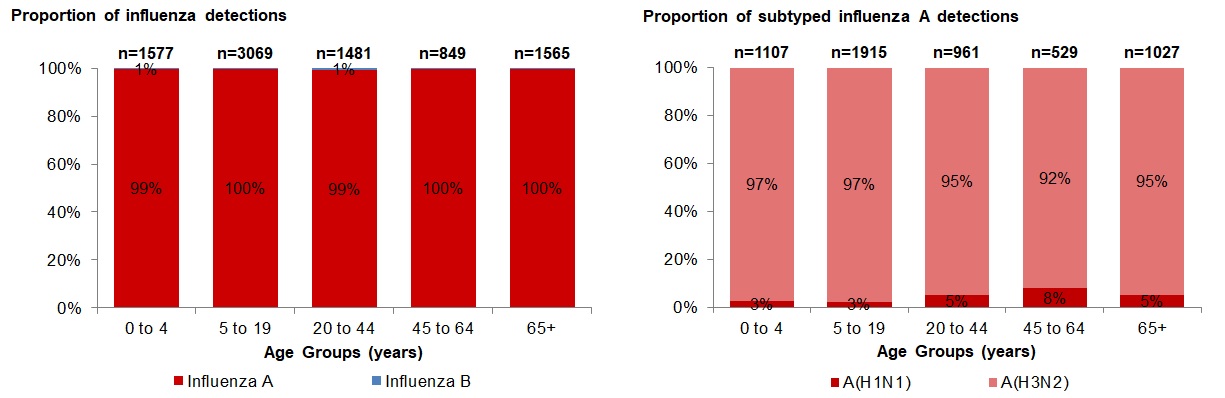
Laboratory data notes:
Testing for influenza and other respiratory viruses has been influenced by the current COVID-19 pandemic. Changes in laboratory testing practices may affect the comparability of data to previous seasons.
Due to different testing protocols of laboratories across Canada, some influenza A subtype detection counts may not be included in total influenza A detection counts and percent positivity calculations.
Figure 4 - Text description
| Age Group | Proportion of Influenza A | Proportion of Influenza B | Total Number Influenza Detections |
|---|---|---|---|
| 0 to 4 | 99.5% | 0.5% | 1577 |
| 5 to 19 | 99.8% | 0.2% | 3069 |
| 20 to 44 | 99.1% | 0.9% | 1481 |
| 45 to 64 | 99.8% | 0.2% | 849 |
| 65+ | 99.6% | 0.4% | 1565 |
| Age Group | Proportion of A(H1N1) | Proportion of A(H3N2) | Total Number of Subtyped Influenza Detections |
|---|---|---|---|
| 0 to 4 | 2.9% | 97.1% | 1107 |
| 5 to 19 | 2.5% | 97.5% | 1915 |
| 20 to 44 | 5.2% | 94.8% | 961 |
| 45 to 64 | 7.9% | 92.1% | 529 |
| 65+ | 5.3% | 94.7% | 1027 |
Syndromic / Influenza-like Illness Surveillance
Healthcare Practitioners Sentinel Surveillance
In week 46, 2.1% of visits to healthcare professionals were due to influenza-like illness (ILI). The percentage of visits for ILI is slightly above expected levels for this time of year.
Since the beginning of the surveillance season, the percentage of visits for ILI has been within or near expected pre-pandemic levels (Figure 5). ILI symptoms are not specific to any one respiratory pathogen and can be due to influenza, or other respiratory viruses, including respiratory syncytial virus and SARS-CoV-2, the virus that causes COVID-19.
This indicator should be interpreted with caution as there have been changes in healthcare seeking behavior of individuals and a smaller number of sentinels reporting compared to previous seasons.
Number of Sentinels Reporting in Week 46: 43
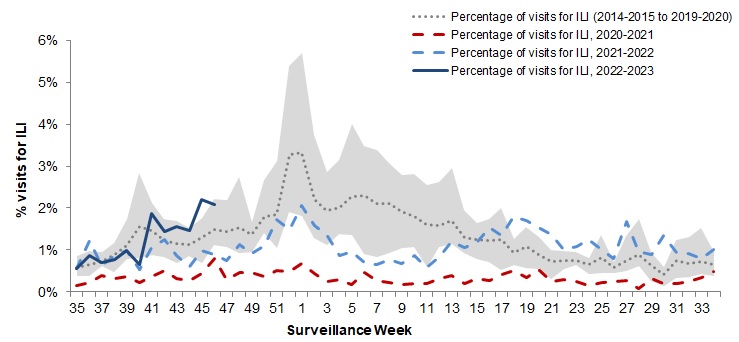
The shaded area represents the maximum and minimum percentage of percentage of participants reporting cough and fever by week, from seasons 2014-2015 to 2019-2020. Data from week 11 of the 2019-2020 season onwards are excluded from the historical comparison due to the COVID-19 pandemic.
Figure 5 - Text description
| Surveillance Week | 2022-2023 | 2021-2022 | 2020-2021 | Average | Min | Max |
|---|---|---|---|---|---|---|
| 35 | 0.6% | 0.6% | 0.1% | 0.6% | 0.4% | 0.9% |
| 36 | 0.9% | 1.2% | 0.2% | 0.6% | 0.4% | 0.9% |
| 37 | 0.7% | 0.6% | 0.4% | 0.7% | 0.5% | 1.0% |
| 38 | 0.8% | 0.9% | 0.3% | 0.7% | 0.6% | 1.0% |
| 39 | 1.0% | 1.0% | 0.4% | 0.9% | 0.5% | 1.2% |
| 40 | 0.7% | 0.5% | 0.2% | 1.2% | 0.8% | 1.7% |
| 41 | 1.9% | 1.1% | 0.4% | 1.7% | 0.8% | 2.8% |
| 42 | 1.4% | 1.2% | 0.5% | 1.6% | 1.2% | 2.1% |
| 43 | 1.6% | 0.9% | 0.3% | 1.2% | 0.8% | 1.7% |
| 44 | 1.5% | 0.6% | 0.3% | 1.2% | 0.7% | 1.7% |
| 45 | 2.2% | 1.0% | 0.4% | 1.2% | 0.9% | 1.5% |
| 46 | 2.1% | 0.9% | 0.8% | 1.4% | 1.2% | 1.8% |
FluWatchers
In week 46, 10,913 participants reported to FluWatchers, of which 2.9% reported symptoms of cough and fever (Figure 6). The percentage of FluWatchers who have reported cough and fever remains well above expected levels typical of this time of year.
The reports of cough and fever are not specific to any one respiratory pathogen and can be due to influenza, or other respiratory viruses, including respiratory syncytial virus, rhinovirus, and SARS-CoV-2, the virus that causes COVID-19. FluWatchers reporting is not impacted by changes in health services or health seeking behaviours.
Among the 312 participants who reported cough and fever:
- 19% consulted a healthcare professional;
- 82% reported days missed from work or school, resulting in an average of 2.7 missed days from work or school among those 255 participants.
If you are interested in becoming a FluWatcher, sign up today.
Number of Participants Reporting in Week 46: 10,913
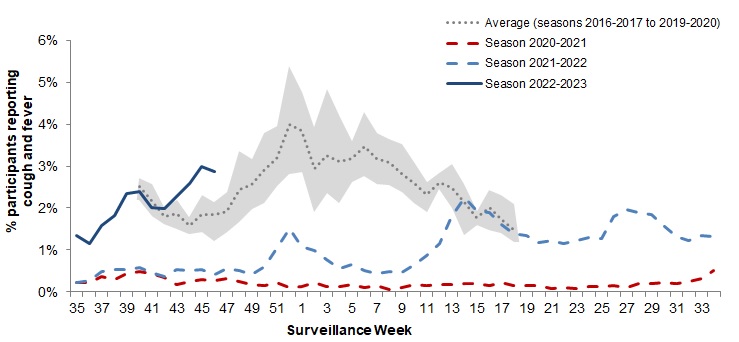
The shaded area represents the maximum and minimum percentage of percentage of participants reporting cough and fever by week, from seasons 2014-2015 to 2019-2020. Data from week 11 of the 2019-2020 season onwards are excluded from the historical comparison due to the COVID-19 pandemic.
Figure 6 - Text description
| Surveillance Week | 2022-2023 | 2021-2022 | 2020-2021 | Average | Min | Max |
|---|---|---|---|---|---|---|
| 35 | 1.3% | 0.2% | 0.2% | N/A | N/A | N/A |
| 36 | 1.2% | 0.3% | 0.2% | N/A | N/A | N/A |
| 37 | 1.6% | 0.5% | 0.4% | N/A | N/A | N/A |
| 38 | 1.8% | 0.5% | 0.3% | N/A | N/A | N/A |
| 39 | 2.3% | 0.5% | 0.4% | N/A | N/A | N/A |
| 40 | 2.4% | 0.6% | 0.5% | 2.5% | 2.2% | 2.7% |
| 41 | 2.0% | 0.5% | 0.4% | 2.2% | 1.8% | 2.6% |
| 42 | 2.0% | 0.4% | 0.3% | 1.8% | 1.6% | 2.0% |
| 43 | 2.3% | 0.5% | 0.2% | 1.9% | 1.5% | 2.2% |
| 44 | 2.6% | 0.5% | 0.3% | 1.6% | 1.4% | 1.8% |
| 45 | 3.0% | 0.5% | 0.3% | 1.8% | 1.4% | 2.3% |
| 46 | 2.9% | 0.4% | 0.3% | 1.8% | 1.2% | 2.2% |
| 47 | N/A | 0.6% | 0.3% | 1.9% | 1.4% | 2.4% |
| 48 | N/A | 0.5% | 0.3% | 2.4% | 1.7% | 3.4% |
| 49 | N/A | 0.4% | 0.2% | 2.6% | 2.0% | 3.2% |
| 50 | N/A | 0.6% | 0.1% | 2.9% | 2.1% | 3.8% |
| 51 | N/A | 1.0% | 0.2% | 3.2% | 2.5% | 3.9% |
| 52 | N/A | 1.5% | 0.1% | 4.0% | 2.8% | 5.4% |
| 1 | N/A | 1.1% | 0.1% | 3.8% | 2.9% | 4.8% |
| 2 | N/A | 1.0% | 0.2% | 2.9% | 1.9% | 3.9% |
| 3 | N/A | 0.8% | 0.1% | 3.3% | 2.3% | 4.8% |
| 4 | N/A | 0.6% | 0.1% | 3.1% | 2.1% | 4.2% |
| 5 | N/A | 0.6% | 0.2% | 3.2% | 2.6% | 3.6% |
| 6 | N/A | 0.5% | 0.1% | 3.5% | 2.8% | 4.3% |
| 7 | N/A | 0.4% | 0.2% | 3.2% | 2.6% | 3.8% |
| 8 | N/A | 0.5% | 0.1% | 3.1% | 2.5% | 3.6% |
| 9 | N/A | 0.5% | 0.1% | 2.8% | 2.4% | 3.5% |
| 10 | N/A | 0.6% | 0.2% | 2.6% | 2.1% | 3.1% |
| 11 | N/A | 0.9% | 0.2% | 2.3% | 1.9% | 2.6% |
| 12 | N/A | 1.2% | 0.2% | 2.6% | 2.5% | 2.8% |
| 13 | N/A | 1.8% | 0.2% | 2.5% | 2.0% | 3.1% |
| 14 | N/A | 2.3% | 0.2% | 2.1% | 1.3% | 2.6% |
| 15 | N/A | 1.9% | 0.2% | 1.8% | 1.6% | 1.9% |
| 16 | N/A | 1.9% | 0.1% | 2.0% | 1.5% | 2.4% |
| 17 | N/A | 1.6% | 0.2% | 1.7% | 1.4% | 2.3% |
| 18 | N/A | 1.4% | 0.2% | 1.5% | 1.2% | 2.1% |
| 19 | N/A | 1.3% | 0.1% | N/A | N/A | N/A |
| 20 | N/A | 1.2% | 0.2% | N/A | N/A | N/A |
| 21 | N/A | 1.2% | 0.1% | N/A | N/A | N/A |
| 22 | N/A | 1.2% | 0.1% | N/A | N/A | N/A |
| 23 | N/A | 1.2% | 0.1% | N/A | N/A | N/A |
| 24 | N/A | 1.3% | 0.1% | N/A | N/A | N/A |
| 25 | N/A | 1.3% | 0.1% | N/A | N/A | N/A |
| 26 | N/A | 1.8% | 0.2% | N/A | N/A | N/A |
| 27 | N/A | 2.0% | 0.1% | N/A | N/A | N/A |
| 28 | N/A | 1.9% | 0.2% | N/A | N/A | N/A |
| 29 | N/A | 1.8% | 0.2% | N/A | N/A | N/A |
| 30 | N/A | 1.6% | 0.2% | N/A | N/A | N/A |
| 31 | N/A | 1.3% | 0.2% | N/A | N/A | N/A |
| 32 | N/A | 1.2% | 0.3% | N/A | N/A | N/A |
| 33 | N/A | 1.4% | 0.3% | N/A | N/A | N/A |
| 34 | N/A | 1.3% | 0.5% | N/A | N/A | N/A |
Influenza Outbreak Surveillance
In week 46, 45 laboratory-confirmed influenza outbreaks were reported in Canada (22 in long-term care facilities (LTC), 12 in acute care facilities, and 11 in facilities categorized as ‘other’). All outbreaks were due to influenza A. 25 ILI outbreaks were reported in schools/daycares.
To date this season (August 28, 2022 to November 19, 2022):
- 127 laboratory-confirmed influenza outbreaks have been reported
- 54 were in LTC facilities (43%)
- 39 were in facilities categorized as ‘other’ (31%)
- 30 were in acute care facilities (24%)
- 4 were in schools/daycares (3%)
- All but one outbreak were due to influenza A
- 41 ILI outbreaks have been reported
- All ILI outbreaks have been reported in schools and/or daycares.
Outbreaks of ILI are not specific to any one respiratory pathogen and can be due influenza, or other respiratory viruses, including respiratory syncytial virus, rhinovirus, COVID-19, or a mixture of viruses. Many respiratory viruses in addition to the flu commonly circulate during the fall and winter, and can cause clusters of cases with respiratory illness which could be captured as ILI.
Number of provinces and territoriesFootnote 1 reporting in week 46: 12 out of 13
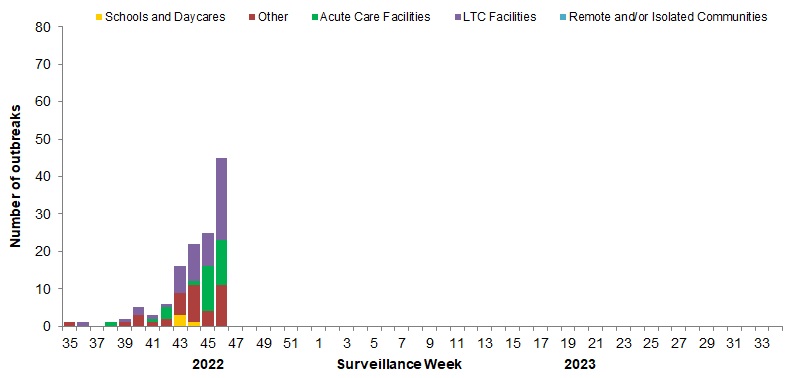
Figure 7 - Text description
| Surveillance Week | Acute Care Facilities | Long Term Care Facilities | Other | Schools and Daycares | Remote and/or Isolated Communities |
|---|---|---|---|---|---|
| 35 | 0 | 0 | 1 | 0 | 0 |
| 36 | 0 | 1 | 0 | 0 | 0 |
| 37 | 0 | 0 | 0 | 0 | 0 |
| 38 | 1 | 0 | 0 | 0 | 0 |
| 39 | 0 | 1 | 1 | 0 | 0 |
| 40 | 0 | 2 | 3 | 0 | 0 |
| 41 | 1 | 1 | 1 | 0 | 0 |
| 42 | 3 | 1 | 2 | 0 | 0 |
| 43 | 0 | 7 | 6 | 3 | 0 |
| 44 | 1 | 10 | 10 | 1 | 0 |
| 45 | 12 | 9 | 4 | 0 | 0 |
| 46 | 12 | 22 | 11 | 0 | 0 |
Influenza Severe Outcomes Surveillance
Provincial/Territorial Influenza Hospitalizations and Deaths
In week 46, 196 influenza-associated hospitalizations and 20 ICU admissions were reported by participating provinces and territoriesFootnote 2. This week, 6 influenza-associated deaths were reported.
To date this season 736 influenza-associated hospitalizations were reported (August 28, 2022 to November 19, 2022) by participating provinces and territories
- 99% of the hospitalizations were associated with influenza A.
- Of the cases with subtype information (529), 94% were associated with influenza A(H3N2)
- The highest cumulative hospitalization rates up to week 46 were among children under 5 years of age (26/100,000 population) and adults 65 years of age and older (21/100,000 population).
To date this season (August 28, 2022 to November 19, 2022), 64 ICU admissions and 25 influenza-associated deaths were reported.
Number of provinces and territories reporting in week 46: 9 out of 9
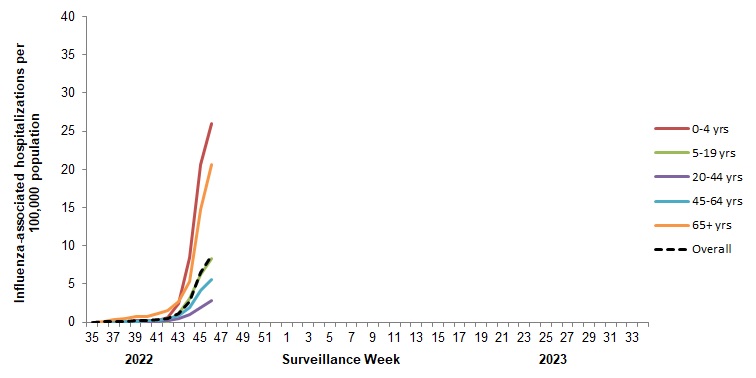
Figure 8 - Text description
| Surveillance Week | 0-4 yrs | 5-19 yrs | 20-44 yrs | 45-64 yrs | 65+ yrs | Overall |
|---|---|---|---|---|---|---|
| 35 | 0.2 | - | 0.0 | 0.0 | 0.1 | 0.0 |
| 36 | 0.2 | - | 0.0 | 0.0 | 0.1 | 0.1 |
| 37 | 0.2 | - | 0.0 | 0.1 | 0.4 | 0.1 |
| 38 | 0.2 | - | 0.0 | 0.1 | 0.4 | 0.1 |
| 39 | 0.2 | - | 0.0 | 0.1 | 0.7 | 0.2 |
| 40 | 0.2 | - | 0.1 | 0.2 | 0.7 | 0.2 |
| 41 | 0.2 | 0.1 | 0.1 | 0.2 | 1.2 | 0.3 |
| 42 | 0.7 | 0.1 | 0.2 | 0.4 | 1.5 | 0.5 |
| 43 | 2.5 | 1.1 | 0.4 | 0.9 | 2.7 | 1.1 |
| 44 | 8.5 | 3.1 | 0.9 | 1.9 | 5.3 | 2.7 |
| 45 | 20.6 | 6.2 | 1.9 | 4.2 | 14.7 | 6.4 |
| 46 | 25.9 | 8.4 | 2.9 | 5.6 | 20.6 | 8.8 |
Pediatric Influenza Hospitalizations and Deaths
In week 46, 205 influenza-associated pediatric (≤16 years of age) hospitalizations and 25 ICU admissions were reported by the Immunization Monitoring Program Active (IMPACT) network. The number of weekly influenza-associated hospitalizations is well above levels typical of this time of year and is above levels typically seen at the peak of the influenza season (Figure 9). All hospitalisations reported in week 46 except one were associated with influenza A. This week, less than 5 influenza-associated pediatric deaths were reported.
To date this season (August 28, 2022 to November 19, 2022), 482 pediatric influenza-associated hospitalizations, 58 ICU admissions and less than 5 influenza-associated pediatric deaths have been reported. Children aged between 2-4 years and 5-9 years account for more than 50% of the reported pediatric hospitalizations (Figure 10).
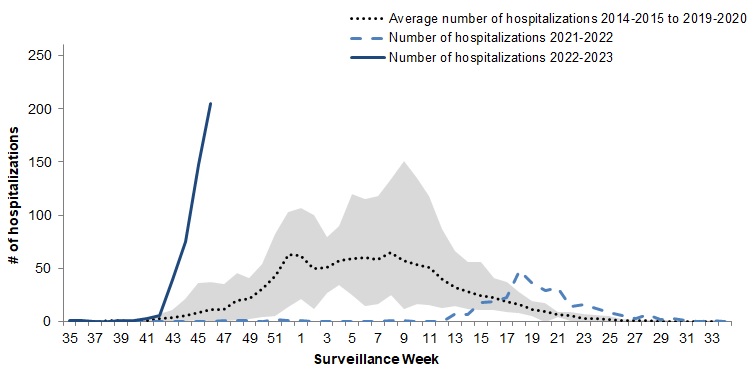
Figure 9 - Text description
| Surveillance week | 2022-2023 | 2021-2022 | Average | Min | Max |
|---|---|---|---|---|---|
| 35 | 1 | 0 | 0 | 0 | 1 |
| 36 | 1 | 0 | 1 | 0 | 2 |
| 37 | 0 | 0 | 1 | 0 | 2 |
| 38 | 0 | 0 | 1 | 0 | 2 |
| 39 | 1 | 0 | 1 | 0 | 3 |
| 40 | 1 | 0 | 1 | 0 | 2 |
| 41 | 3 | 0 | 2 | 0 | 3 |
| 42 | 6 | 0 | 3 | 0 | 7 |
| 43 | 40 | 0 | 4 | 1 | 11 |
| 44 | 75 | 0 | 6 | 1 | 21 |
| 45 | 148 | 0 | 9 | 2 | 36 |
| 46 | 205 | 0 | 12 | 1 | 37 |
| 47 | #N/A | 1 | 11 | 1 | 35 |
| 48 | #N/A | 1 | 20 | 2 | 46 |
| 49 | #N/A | 1 | 21 | 3 | 41 |
| 50 | #N/A | 0 | 31 | 4 | 54 |
| 51 | #N/A | 2 | 44 | 5 | 82 |
| 52 | #N/A | 1 | 63 | 14 | 103 |
| 1 | #N/A | 1 | 62 | 21 | 107 |
| 2 | #N/A | 0 | 50 | 12 | 100 |
| 3 | #N/A | 0 | 51 | 27 | 80 |
| 4 | #N/A | 0 | 58 | 34 | 90 |
| 5 | #N/A | 0 | 59 | 25 | 120 |
| 6 | #N/A | 0 | 60 | 15 | 115 |
| 7 | #N/A | 0 | 59 | 17 | 118 |
| 8 | #N/A | 1 | 65 | 25 | 134 |
| 9 | #N/A | 1 | 57 | 12 | 151 |
| 10 | #N/A | 0 | 54 | 17 | 135 |
| 11 | #N/A | 0 | 51 | 16 | 118 |
| 12 | #N/A | 0 | 39 | 13 | 87 |
| 13 | #N/A | 8 | 32 | 15 | 66 |
| 14 | #N/A | 7 | 28 | 12 | 56 |
| 15 | #N/A | 18 | 25 | 11 | 56 |
| 16 | #N/A | 19 | 23 | 11 | 41 |
| 17 | #N/A | 23 | 19 | 9 | 37 |
| 18 | #N/A | 48 | 16 | 8 | 28 |
| 19 | #N/A | 36 | 11 | 5 | 19 |
| 20 | #N/A | 29 | 10 | 0 | 18 |
| 21 | #N/A | 32 | 6 | 4 | 9 |
| 22 | #N/A | 14 | 6 | 1 | 9 |
| 23 | #N/A | 16 | 3 | 1 | 7 |
| 24 | #N/A | 12 | 3 | 1 | 6 |
| 25 | #N/A | 9 | 2 | 0 | 5 |
| 26 | #N/A | 6 | 1 | 0 | 3 |
| 27 | #N/A | 3 | 1 | 0 | 2 |
| 28 | #N/A | 7 | 1 | 0 | 2 |
| 29 | #N/A | 2 | 1 | 0 | 3 |
| 30 | #N/A | 3 | 1 | 0 | 1 |
| 31 | #N/A | 1 | 0 | 0 | 0 |
| 32 | #N/A | 0 | 0 | 0 | 0 |
| 33 | #N/A | 1 | 0 | 0 | 2 |
| 34 | #N/A | 0 | 1 | 0 | 2 |
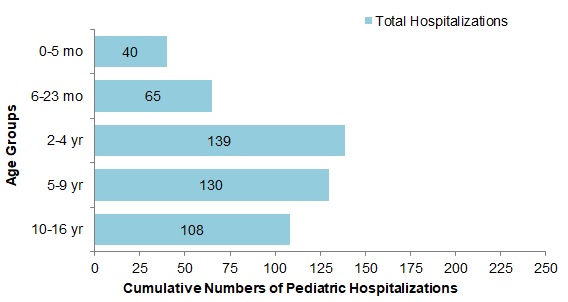
Figure 10 - Text description
| Age Group | Total |
|---|---|
| 0-5 mo | 40 |
| 6-23 mo | 65 |
| 2-4 yr | 139 |
| 5-9 yr | 130 |
| 10-16 yr | 108 |
Influenza Strain Characterization
Since September 1, 2022, the National Microbiology Laboratory (NML) has characterized 28 influenza viruses (23 A(H3N2), 5 A(H1N1)) received from Canadian laboratories.
Genetic Characterization of Influenza A(H3N2)
One influenza A(H3N2) virus did not grow to sufficient hemagglutination titers for antigenic characterization by hemagglutination inhibition (HI) assays. Therefore, NML has performed genetic characterization to determine the genetic group identity of this virus.
Sequence analysis of the HA gene of the virus showed that it belonged to genetic group 3C.2a1b.2a2.
A/Darwin/6/2021 (H3N2)-like virus is an influenza A/H3N2 component of the 2022-23 Northern Hemisphere influenza vaccine and belongs to genetic group 3C.2a1b.2a2.
Antigenic Characterization
Influenza A(H3N2)
- 22 influenza A (H3N2) viruses were characterized as antigenically similar to A/Darwin/6/2021 (H3N2)-like virus with antisera raised against cell-grown A/Darwin/6/2021 (H3N2)-like virus.
- A/Darwin/6/2021 (H3N2)-like virus is an influenza A/H3N2 component of the 2022-23 Northern Hemisphere influenza vaccine.
- The 22 influenza A (H3N2) viruses characterized belonged to genetic group 3C.2a1b.2a2.
Influenza A(H1N1)
- 5 influenza A (H1N1) viruses were characterized as antigenically similar to A/Wisconsin/588/2019-like with ferret antisera produced against cell-propagated A/Wisconsin/588/2019.
- A/Wisconsin/588/2019 is the influenza A/H1N1 component of the 2022-23 Northern Hemisphere influenza vaccine.
Antiviral Resistance
The NML also tests influenza viruses received from Canadian laboratories for antiviral resistance.
Oseltamivir
16 influenza viruses (15 A(H3N2) and 1 A(H1N1)) were tested for resistance to oseltamivir and it was found that:
- All influenza viruses were sensitive to oseltamivir.
Zanamivir
16 influenza viruses (15 A(H3N2) and 1 A(H1N1)) were tested for resistance to zanamivir and it was found that:
- All influenza viruses were sensitive to zanamivir.
Influenza Vaccine Monitoring
Vaccine monitoring refers to activities related to the monitoring of influenza vaccine coverage and effectiveness.
Vaccine Coverage
Influenza vaccine coverage estimates for the 2022-2023 season are anticipated to be available in February or March 2023.
Vaccine Effectiveness
Influenza vaccine effectiveness estimates for the 2022-2023 season are anticipated to be available in February or March 2023.
Provincial and International Surveillance Links
See Influenza surveillance resources
Notes
The data in the FluWatch report represent surveillance data available at the time of writing. All data are preliminary and may change as updates are received.
To learn more about the FluWatch program, see the Overview of influenza monitoring in Canada page.
For more information on the flu, see our Flu (influenza) web page.
We would like to thank all the FluWatch surveillance partners participating in this year's influenza surveillance program.
This report is available on the Government of Canada Influenza webpage.
Ce rapport est disponible dans les deux langues officielles.
- Footnote 1
-
All Provinces and Territories (PTs) participate in the FluWatch outbreak surveillance system. This outbreak system monitors influenza and ILI outbreaks in long-term care facilities (LTCF), acute care facilities, schools and daycares, remote and/or isolated communities, and facilities categorized as 'other'. Not all reporting PTs report outbreaks in all these settings. All PTs report laboratory confirmed outbreaks in LTCF. Four PTs (NB, NL, NS and YK) report ILI outbreaks in schools and/or daycares and other facilities.
- Footnote 2
-
Influenza-associated hospitalizations are reported by Alberta, Manitoba, New Brunswick, Newfoundland and Labrador, Northwest Territories, Nova Scotia, Prince Edward Island and Yukon. Only hospitalizations that require intensive medical care are reported by Saskatchewan