
FluWatch report: November 3 to 9, 2019 (week 45)
Download the alternative format
(PDF format, 464 KB, 9 pages)
Organization: Public Health Agency of Canada
Date published: 2019-11-15
Related Topics
Overall Summary
- Influenza activity remains at interseasonal levels at the national level.
- The number of regions in Canada reporting influenza activity in week 45 was similar to the previous week.
- Influenza A(H3N2) continues to be the most common influenza virus circulating in Canada.
- Weekly reporting of laboratory detections of respiratory viruses continues via the Respiratory Virus Detections Surveillance System.
On this page
- Influenza/ILI Activity (geographic spread)
- Laboratory Confirmed Influenza Detections
- Syndromic/Influenza-like Illness Surveillance
- FluWatchers
- Influenza Outbreak Surveillance
- Severe Outcomes Influenza Surveillance
- Influenza Strain Characterizations
- Antiviral Resistance
- Vaccine Monitoring
- Provincial and International Influenza Reports
Influenza/Influenza-like Illness Activity (geographic spread)
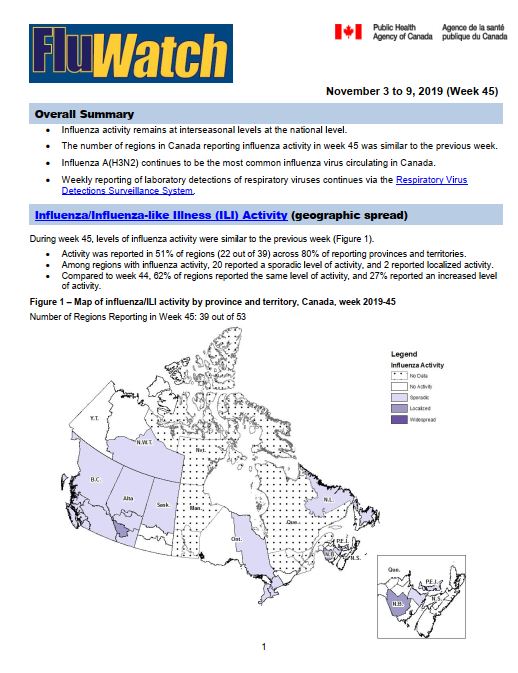
During week 45, levels of influenza activity were similar to the previous week (Figure 1).
- Activity was reported in 51% of regions (22 out of 39) across 80% of reporting provinces and territories.
- Among regions with influenza activity, 20 reported a sporadic level of activity, and 2 reported localized activity.
- Compared to week 44, 62% of regions reported the same level of activity, and 27% reported an increased level of activity.
Figure 1 – Map of influenza/ILI activity by province and territory, Canada, week 2019-45
Number of Regions Reporting in Week 45: 39 out of 53

Figure 1 - Text equivalent
| Province | Influenza Surveillance Region | Activity Level |
|---|---|---|
| N.L. | Eastern | No Activity |
| N.L. | Labrador-Grenfell | Sporadic |
| N.L. | Central | Sporadic |
| N.L. | Western | No Activity |
| P.E.I. | Prince Edward Island | Sporadic |
| N.S. | Zone 1 - Western | No Activity |
| N.S. | Zone 2 - Northern | No Activity |
| N.S. | Zone 3 - Eastern | No Activity |
| N.S. | Zone 4 - Central | No Activity |
| N.B. | Region 1 | Sporadic |
| N.B. | Region 2 | No Activity |
| N.B. | Region 3 | Localized |
| N.B. | Region 4 | No Activity |
| N.B. | Region 5 | No Activity |
| N.B. | Region 6 | No Activity |
| N.B. | Region 7 | No Activity |
| Que. | Nord-est | No Data |
| Que. | Québec et Chaudieres-Appalaches | No Data |
| Que. | Centre-du-Québec | No Data |
| Que. | Montréal et Laval | No Data |
| Que. | Ouest-du-Québec | No Data |
| Que. | Montérégie | No Data |
| Ont. | Central East | Sporadic |
| Ont. | Central West | Sporadic |
| Ont. | Eastern | No Activity |
| Ont. | North East | Sporadic |
| Ont. | North West | No Activity |
| Ont. | South West | Sporadic |
| Ont. | Toronto | Sporadic |
| Man. | Northern Regional | No Data |
| Man. | Prairie Mountain | No Data |
| Man. | Interlake-Eastern | No Data |
| Man. | Winnipeg | No Data |
| Man. | Southern Health | No Data |
| Sask. | North | Sporadic |
| Sask. | Central | No Activity |
| Sask. | South | No Activity |
| Alta. | North Zone | Sporadic |
| Alta. | Edmonton | Sporadic |
| Alta. | Central Zone | Sporadic |
| Alta. | Calgary | Localized |
| Alta. | South Zone | Sporadic |
| B.C. | Interior | Sporadic |
| B.C. | Fraser | Sporadic |
| B.C. | Vancouver Coastal | Sporadic |
| B.C. | Vancouver Island | Sporadic |
| B.C. | Northern | Sporadic |
| Y.T. | Yukon | No Activity |
| N.W.T. | North | No Activity |
| N.W.T. | South | Sporadic |
| Nvt. | Qikiqtaaluk | No Data |
| Nvt. | Kivalliq | No Data |
| Nvt. | Kitimeot | No Data |
Laboratory-Confirmed Influenza Detections
In week 45, the number of detections of influenza continued to increase. The following results were reported from sentinel laboratories across Canada (Figures 2 and 3):
- The percentage of tests positive for influenza increased but remains at interseasonal levels, at 3.1%.
- A total of 147 laboratory detections of influenza were reported, of which 76% (111) were influenza A.
- The proportion of detections of influenza B increased to 25%, which is higher than the average for this time of year.
- Among subtyped influenza A detections 71% (30 out of 42) were influenza A(H3N2).
To date this season (weeks 35 to 45), 711 laboratory detections of influenza were reported:
- 85% (602) were influenza A.
- Among subtyped influenza A detections (233), 80% were influenza A(H3N2).
Detailed information on age and type/subtype has been received for more than 539 laboratory-confirmed influenza cases (Table 1). (The total number of cases is suppressed due to small values in Table 1).
To date this season (weeks 35 to 45):
- The largest proportion of influenza A(H3N2) cases reported were in adults 65 years of age and older (49%).
- The majority of cases of influenza B were in younger age-groups; 85% of cases were under 45 years of age.
For more detailed weekly and cumulative influenza data, see the text descriptions for Figures 2 and 3 or the Respiratory Virus Detections in Canada Report.
Figure 2 - Number of positive influenza tests and percentage of tests positive, by type, subtype and report week, Canada, week 2019-45
Number of Laboratories Reporting in Week 45: 22 out of 34
This week's FluWatch report does not contain data from the Public Health Ontario Laboratory.
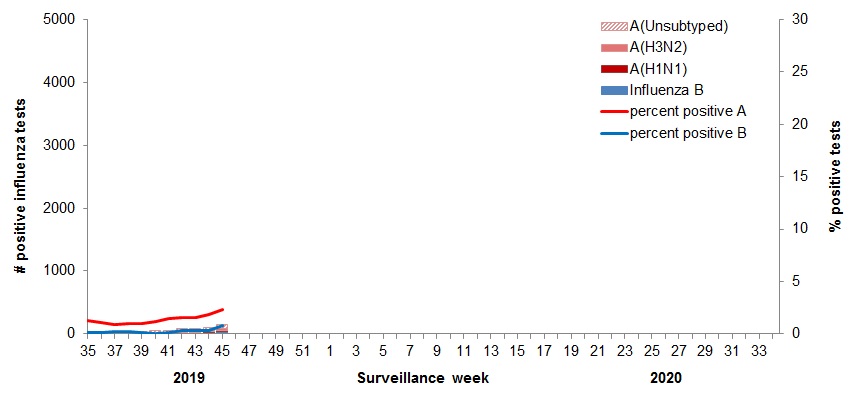
Figure 2 - Text equivalent
| Surveillance Week | A(Unsubtyped) | A(H3N2) | A(H1N1)pdm09 | Influenza B | Percent Positive A | Percent Positive B |
|---|---|---|---|---|---|---|
| 35 | 10 | 16 | 0 | 2 | 1.3 | 0.1 |
| 36 | 11 | 13 | 2 | 2 | 1.1 | 0.1 |
| 37 | 5 | 17 | 2 | 5 | 0.9 | 0.2 |
| 38 | 11 | 15 | 3 | 6 | 1.0 | 0.2 |
| 39 | 11 | 21 | 2 | 3 | 1.0 | 0.1 |
| 40 | 34 | 9 | 1 | 2 | 1.2 | 0.1 |
| 41 | 34 | 18 | 0 | 5 | 1.4 | 0.1 |
| 42 | 54 | 12 | 1 | 14 | 1.6 | 0.3 |
| 43 | 44 | 13 | 7 | 17 | 1.6 | 0.3 |
| 44 | 43 | 23 | 16 | 17 | 1.8 | 0.3 |
| 45 | 65 | 30 | 12 | 36 | 2.4 | 0.8 |
Figure 3 – Distribution of positive influenza specimens by type/subtype and province/territory1, Canada, weeks 2019-35 to 2019-45
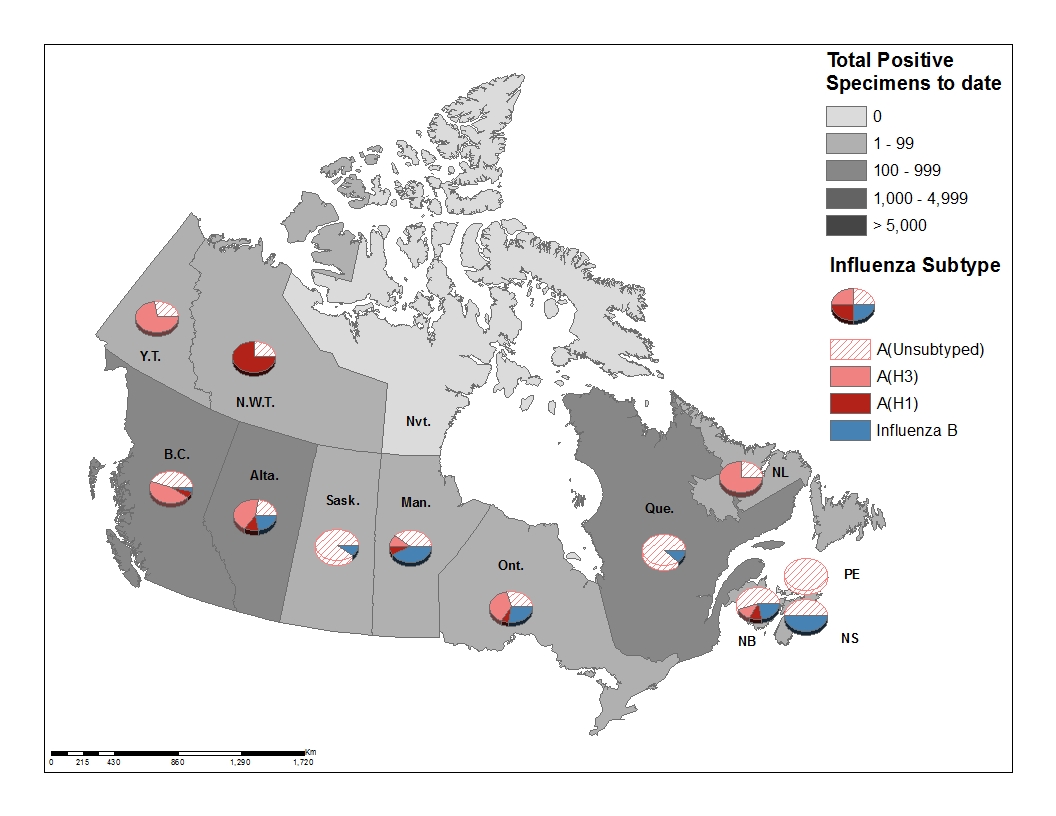
Figure 3 - Text equivalent
| ProvincesTable Figure 3 - Footnote 1 | Cumulative (August 25, 2019 to November 9, 2019) | |||||
|---|---|---|---|---|---|---|
| A Total | A(H1N1) | A(H3N2) | A(UnS)Table Figure 3 - Footnote 3 | B Total | Total | |
| B.C. | 166 | 7 | 57 | 55 | 4 | 170 |
| Alta. | 166 | 28 | 91 | 47 | 46 | 212 |
| Sask. | 35 | 0 | 0 | 26 | 3 | 38 |
| Man. | 23 | 3 | 4 | 16 | 17 | 40 |
| Ont. | 45 | 4 | 23 | 18 | 17 | 62 |
| Que. | 139 | 0 | 0 | 139 | 19 | 158 |
| N.B. | 7 | 1 | 1 | 5 | 2 | 9 |
| N.S. | 1 | 0 | 0 | 1 | 1 | 2 |
| P.E.I. | 1 | 0 | 0 | 1 | 0 | 1 |
| N.L. | 4 | 0 | 3 | 1 | 0 | 4 |
| Y.T. | 11 | 0 | 8 | 3 | 0 | 11 |
| N.W.T | 4 | 3 | 0 | 1 | 0 | 4 |
| Nvt. | 0 | 0 | 0 | 0 | 0 | 0 |
| Canada | 602 | 46 | 187 | 313 | 109 | 711 |
| PercentageTable Figure 3 - Footnote 2 | 85% | 8% | 31% | 52% | 15% | 100% |
|
||||||
| Age groups (years) | Cumulative (August 25, 2019 to November 9, 2019) | ||||||
|---|---|---|---|---|---|---|---|
| Influenza A | B | Influenza A and B | |||||
| A Total | A(H1N1) | A(H3N2) | A (Un subtyped)Table 1 Footnote 1 | Total | # | % | |
| 0-4 | 54 | 11 | 14 | 29 | 16 | 70 | 13% |
| 5-19 | >32 | <5 | 13 | 19 | 27 | >59 | 11% |
| 20-44 | 82 | 8 | 21 | 53 | 32 | 114 | 21% |
| 45-64 | 99 | 18 | 36 | 45 | 5 | 104 | 19% |
| 65+ | >184 | <5 | 82 | 102 | 8 | >192 | 36% |
| Total | >451 | >34 | 166 | 248 | 88 | >539 | 100% |
|
|||||||
Syndromic / Influenza-like Illness Surveillance
Healthcare Professionals Sentinel Syndromic Surveillance
In week 45, 1.0%, of visits to healthcare professionals were due to influenza-like illness (ILI) which is slightly below the average for this time of year (1.2%) (Figure 4).
Figure 4 – Percentage of visits for ILI reported by sentinels by report week, Canada, weeks 2019-35 to 2019-45
Number of participants reporting in week 45: 70
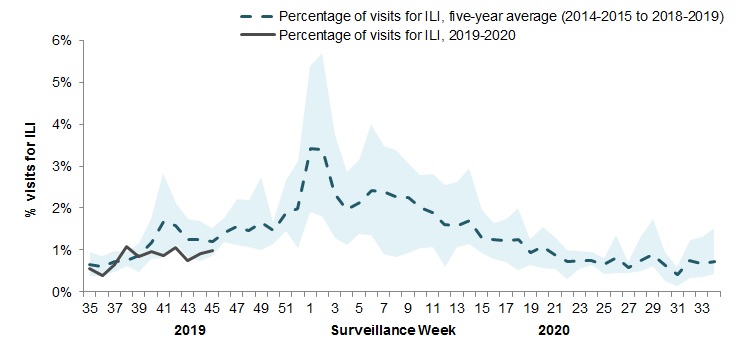
The shaded area represents the maximum and minimum percentage of visits for ILI reported by week from seasons 2014-2015 to 2018-2019
Figure 4 - Text equivalent
| Surveillance Week | 2019-20 | Average | Min | Max |
|---|---|---|---|---|
| 35 | 0.6% | 0.6% | 0.4% | 0.9% |
| 36 | 0.4% | 0.6% | 0.4% | 0.9% |
| 37 | 0.7% | 0.7% | 0.5% | 1.0% |
| 38 | 1.1% | 0.7% | 0.6% | 1.0% |
| 39 | 0.8% | 0.9% | 0.5% | 1.2% |
| 40 | 1.0% | 1.2% | 0.8% | 1.7% |
| 41 | 0.9% | 1.7% | 0.8% | 2.8% |
| 42 | 1.1% | 1.6% | 1.2% | 2.1% |
| 43 | 0.7% | 1.2% | 0.8% | 1.7% |
| 44 | 0.9% | 1.2% | 0.7% | 1.7% |
| 45 | 1.0% | 1.2% | 0.9% | 1.5% |
FluWatchers
In week 45, 2,952 participants reported to FluWatchers, of which 1.5% (43) reported symptoms of cough and fever (Figure 5).
Among the 43 participants who reported cough and fever:
- 33% consulted a healthcare professional;
- 77% reported days missed from work or school, resulting in a combined total of 92 missed days of work or school.
- 49% reported having been vaccinated for influenza this season.
If you are interested in becoming a FluWatcher, sign up today.
Figure 5 – Percentage of FluWatchers participants reporting cough and fever, Canada, week 2019-45
Number of Participants Reporting in Week 45: 2,952
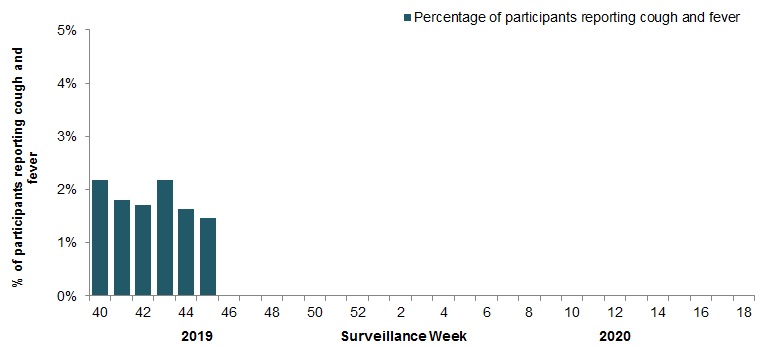
Figure 5 - Text equivalent
| Surveillance Week | % cough and fever |
|---|---|
| 40 | 2.2% |
| 41 | 1.8% |
| 42 | 1.7% |
| 43 | 2.2% |
| 44 | 1.6% |
| 45 | 1.5% |
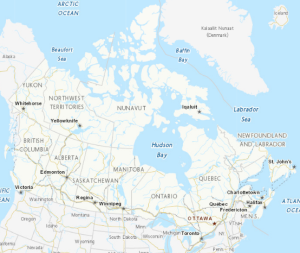
Online Figure – Geographic distribution of FluWatchers participants reporting cough and fever, Canada, week 2019-45
Click on the map to access the link
Influenza Outbreak Surveillance
In week 45, two new outbreaks were reported in a long term care facility and a facility type categorized as ‘other’, which includes facilities such as private personal care homes, correctional facilities, colleges/universities, etc. (Figure 6).
To date this season, a total of 12 laboratory-confirmed influenza outbreaks have been reported; seven in long-term care facilities, one in an acute care facility and four in a facility type categorized as ‘other’. Of the outbreaks where influenza type was reported (11), ten out of eleven were due to influenza A. One ILI outbreak in a school/daycare has also been reported.
Figure 6 – Number of new outbreaks of laboratory-confirmed influenza by report week, Canada, weeks 2019-35 to 2019-45
Number of provinces and territories reporting in week 45: 10 out of 13
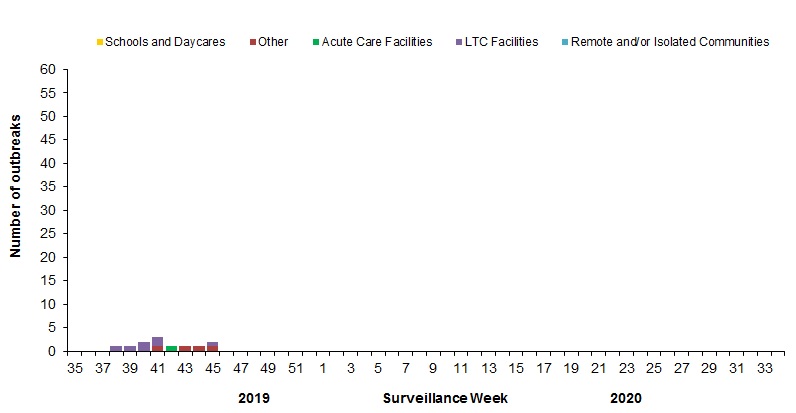
Figure 6 - Text equivalent
| Surveillance Week | Acute Care Facilities | Long Term Care Facilities | Other | Schools and Daycares | Remote and/or Isolated Communities |
|---|---|---|---|---|---|
| 35 | 0 | 0 | 0 | 0 | 0 |
| 36 | 0 | 0 | 0 | 0 | 0 |
| 37 | 0 | 0 | 0 | 0 | 0 |
| 38 | 0 | 1 | 0 | 0 | 0 |
| 39 | 0 | 1 | 0 | 0 | 0 |
| 40 | 0 | 2 | 0 | 0 | 0 |
| 41 | 0 | 2 | 1 | 0 | 0 |
| 42 | 1 | 0 | 0 | 0 | 0 |
| 43 | 0 | 0 | 1 | 0 | 0 |
| 44 | 0 | 0 | 1 | 0 | 0 |
| 45 | 0 | 1 | 1 | 0 | 0 |
Severe Outcomes Influenza Surveillance
Provincial/Territorial Influenza Hospitalizations and Deaths
To date this season. 60 influenza-associated hospitalizations were reported by participating provinces and territoriesFootnote 1.
- 88% of the cases were influenza A.
- Of the cases for which subtype was reported (45), 84% were associated with influenza A(H3N2).
- The greatest proportion of hospitalizations (50%) were amongst adults ≥ 65 years of age.
Six ICU admissions and no deaths have been reported.
Number of provinces and territories reporting in week 45: 8 out of 9- Footnote 1
-
Influenza-associated hospitalizations are reported by N.L., P.E.I. N.S., N.B., Man., Alb., Y.T. and N.W.T. Only hospitalizations that require intensive medical care are reported by Sask. The cumulative rate of hospitalizations is calculated using the population by age-group in participating provinces and territories.
Pediatric Influenza Hospitalizations and Deaths
In week 45, no pediatric (≤16 years of age) laboratory-confirmed influenza-associated hospitalizations were reported by the Immunization Monitoring Program Active (IMPACT) network (Figure 7).
To date this season, 11 pediatric hospitalizations have been reported by the IMPACT network; seven cases associated with influenza A and four with influenza B.
Figure 7 – Number of pediatric (≤16 years of age) hospitalizations reported by the IMPACT network, by week, Canada, weeks 2019-35 to 2019-45
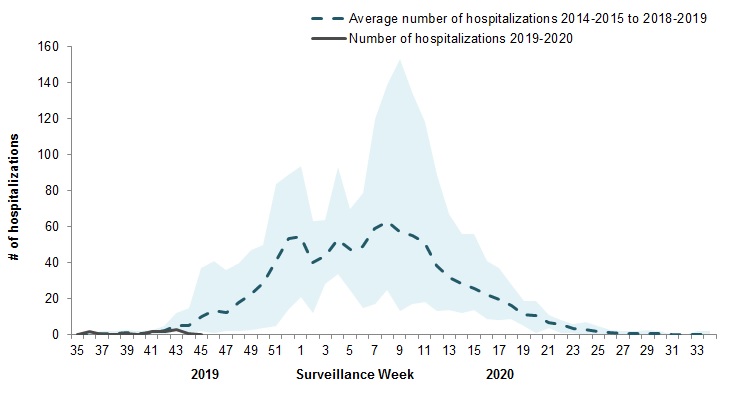
The shaded area represents the maximum and minimum number of cases reported by week from seasons 2014-15 to 2018-19
Figure 7 - Text equivalent
| Surveillance week | 2019-2020 | Average | Min | Max |
|---|---|---|---|---|
| 35 | 0 | 0 | 0 | 1 |
| 36 | 2 | 0 | 0 | 1 |
| 37 | 0 | 1 | 0 | 2 |
| 38 | 0 | 1 | 0 | 2 |
| 39 | 1 | 1 | 0 | 3 |
| 40 | 0 | 1 | 0 | 2 |
| 41 | 2 | 1 | 0 | 3 |
| 42 | 2 | 2 | 0 | 5 |
| 43 | 3 | 5 | 2 | 12 |
| 44 | 1 | 5 | 1 | 15 |
| 45 | 0 | 10 | 2 | 37 |
Adult Influenza Hospitalizations and Deaths
Surveillance of laboratory-confirmed influenza-associated adult (≥16 years of age) hospitalizations by the Canadian Immunization Research Network (CIRN) Serious Outcomes Surveillance (SOS) network began on November 1st for the 2019-20 season. Data will be included in the next FluWatch report (week 46).
Influenza Strain Characterizations
From September 1 to November 14, 2019, the National Microbiology Laboratory (NML) has characterized 39 influenza viruses (25 A(H3N2), 6 A(H1N1) and 8 influenza B) that were received from Canadian laboratories.
Influenza A(H3N2)
Over recent years, circulating strains of A(H3N2) have evolved, and are increasingly difficult to characterize by hemagglutination inhibition (HI) assay. Genetic characterization is established by sequencing the hemagglutinin (HA) gene of the influenza viruses to compare their genetic properties.
Antigenic Characterization:
Among the eight influenza A(H3N2) viruses antigenically characterized to date:
- Seven A(H3N2) viruses showed reduced titer by HI assay to A Kansas/14/2017 using antiserum raised against egg-propagated A Kansas/14/2017.
- One A(H3N2) virus was antigenically similar to A Kansas/14/2017 by HI assay.
Genetic Characterization:
All 25 A(H3N2) viruses this season have been genetically characterized, based on sequence analysis of the HA gene.
- Among the 8 A(H3N2) viruses antigenically characterized:
- Seven viruses belonged to genetic group 3C.2a1b.
- One virus belonged to the genetic group 3C.3a.
- Among the 17 A(H3N2) viruses which did not grow to sufficient hemagglutination titer for antigenic characterization by HI assay:
- All viruses belonged to genetic subclade 3C.2a1b.
A/Kansas/14/2017 belongs to genetic group 3C.3a and is the influenza A(H3N2) component of the 2019-20 Northern Hemisphere influenza vaccine.
Influenza A(H1N1)
- All six A(H1N1) viruses characterized were antigenically similar to A/Brisbane/02/2018 by HI testing using antiserum raised against egg-propagated A/Brisbane/02/2018.
A/Brisbane/02/2018 is the influenza A(H1N1) component of the 2019-20 Northern Hemisphere influenza vaccine.
Influenza B
Of the eight influenza B viruses antigenically characterized this season:
- Six influenza B viruses showed reduced titer by HI assay to B/Colorado/06/2017 using antiserum raised against cell culture-propagated B/Colorado/06/2017. Sequence analysis showed that :
- Five of these viruses had a three amino acid deletion (162-164) in the HA gene.
- Sequence data is pending for the other virus.
- Two influenza B viruses were antigenically similar to B/Colorado/06/2017 by HI assay.
The recommended influenza B components for the 2019-20 Northern Hemisphere influenza vaccine are B/Colorado/06/2017 (Victoria lineage) and B/Phuket/3073/2013 (Yamagata lineage). B/Phuket/3073/2013 is included in the quadrivalent influenza vaccine.
Antiviral Resistance
The National Microbiology Laboratory (NML) also tests influenza viruses received from Canadian laboratories for antiviral resistance.
Oseltamivir:
34 influenza viruses (19 A(H3N2), 6 A(H1N1) and 9 B) were tested for resistance to oseltamivir:
- All influenza viruses tested were sensitive to oseltamivir.
Zanamivir:
34 influenza viruses (19 A(H3N2), 6 A(H1N1) and 9 B) were tested for resistance to zanamivir:
- All influenza viruses tested were sensitive to zanamivir.
Amantadine:
High levels of resistance to amantadine persist among influenza A(H1N1) and influenza A(H3N2) viruses. All viruses tested this season were resistant.
Vaccine Monitoring
Vaccine monitoring refers to activities related to the monitoring of influenza vaccine coverage and effectiveness.
Vaccine Coverage
Influenza vaccine coverage estimates for the 2019-20 season are anticipated to be available in February or March 2020.
Vaccine Effectiveness
Influenza vaccine effectiveness estimates for the 2019-20 season are anticipated to be available in February or March 2020.
Provincial and International Surveillance Links
- British Columbia – Influenza Surveillance; Vaccine Effectiveness Monitoring
- Alberta – Influenza surveillance
- Saskatchewan – Influenza Reports
- Manitoba – Seasonal Influenza Reports
- Ontario – Ontario Respiratory Pathogen Bulletin
- Québec – Système de surveillance de la grippe (available in French only)
- New Brunswick – Influenza Surveillance Reports
- Prince Edward Island – Influenza Summary
- Nova Scotia – Respiratory Watch Report
- Newfoundland and Labrador – Surveillance and Disease Reports
- Yukon – Information on Pandemic, Influenza, Seasonal Flu, Avian Flu and H1N1
- Northwest Territories – Influenza/ Flu Information
- Nunavut – Influenza Information
- World Health Organization – FluNet (Global Influenza Surveillance Network)
- Pan American Health Organization – Influenza situation report
- U.S. Centers for Disease Prevention & Control (CDC) - Weekly Influenza Summary Update
- ECDC – Surveillance reports and disease data on seasonal influenza
- United Kingdom – Weekly Influenza Activity Reports
- Hong Kong Centre for Health Protection - Flu Express
- Australia – Influenza Surveillance Report and Activity Updates
- New Zealand – Influenza Weekly Update
Notes
The data in the FluWatch report represent surveillance data available at the time of writing. All data are preliminary and may change as more reports are received.
To learn more about the FluWatch program, see the Overview of influenza monitoring in Canada page.
For more information on the flu, see our Flu (influenza) web page.
We would like to thank all the Fluwatch surveillance partners participating in this year's influenza surveillance program.
This report is available on the Government of Canada Influenza webpage.
Ce rapport est disponible dans les deux langues officielles.