
FluWatch annual report: 2019-2020 influenza season
Download in PDF format
(812 KB, 15 pages)
Organization: Public Health Agency of Canada
Published: 2021-03-25
ISSN: 2562-9018
Cat.: HP57-9E-PDF
Pub.: 200478
Summary
- The public health measures instituted to reduce the impact of the COVID-19 pandemic also greatly impacted the 2019-2020 influenza season in Canada.
- Nationally, the 2019-2020 influenza season in Canada began on week 47 (November 17 to 23, 2019), peaked in late January (week 5) and ended early and abruptly on week 13 (March 22 to 28, 2020), eight weeks earlier than the average end of season.
- Record low numbers of reported influenza detections, hospitalizations, and outbreaks were observed from mid-March to the end of the season; this pattern was observed for all influenza surveillance indicators presented in this report.
- During the active influenza season (mid-November to mid-March), all seasonal influenza types and subtypes (A(H1N1), A(H3N2) and B/Victoria) circulated concurrently, resulting in higher than average numbers of influenza detections and hospitalizations being reported during that time period.
- Overall, influenza A was the dominant influenza type (59% of detections) and A(H1N1) the dominant sub-type (68% of sub-typed influenza A).
- Influenza A affected all age groups, with influenza A(H3N2) primarily affecting adults 65 years of age and older and influenza A(H1N1) primarily affecting individuals under 65 years of age. Influenza B primarily affected younger people, with detections predominantly reported in individuals 5 years of age and under.
- Overall, influenza vaccine coverage in the 2019-2020 season (42%) was similar to the previous season. Coverage was estimated at 34% for adults aged 18 to 64 years and 70% among seniors (65 and older).
- Vaccine effectiveness (VE) studies in the outpatient setting demonstrated moderate protection for influenza A(H1N1), at 43%, and good protection against influenza A(H3N2) and influenza B, at 50% and 65% respectively. In the adult inpatient setting, moderate protection (42%) was observed for influenza A(H1N1), but low effectiveness was observed against influenza B (20%), with the confidence limits including 0% (no effectiveness).
On this page
- About the FluWatch annual report
- Overview of the 2019-2020 influenza season, based on laboratory-confirmed influenza detections
- Geographic spread of influenza/influenza-like illness (ILI) activity
- Influenza types and subtypes observed during the 2019-2020 influenza season
- Syndromic / influenza-like illness (ILI) surveillance
- Influenza outbreak surveillance
- Severe outcomes influenza surveillance
- Influenza strain characterizations
- Antiviral resistance
- Vaccine monitoring
About the FluWatch annual report
FluWatch is Canada's national surveillance system that monitors the spread of the flu and other flu-like illnesses on an ongoing basis using data supplied to the FluWatch program from its pan-Canadian network of labs, hospitals, doctor's offices, individual Canadians and provincial and territorial (PT) ministries of health.
FluWatch reports are based on weekly data that are published throughout the influenza surveillance season which goes from epidemiological week 35 to 34 of the following year. This annual report is a summary of Canada's 2019-2020 influenza season (August 25, 2019 to August 22, 2020) and provides a comparison of core surveillance indicators to those observed in the previous five seasons.
Overview of the 2019-2020 influenza season, based on laboratory-confirmed influenza detections
Data on laboratory-confirmed influenza detections are provided by all 10 provincial laboratories, as well as six hospital laboratoriesFootnote 1 in Ontario. Laboratory-confirmed influenza detections in the Territories are provided by provincial or hospital laboratories in British Columbia, Alberta and Ontario. During the 2019-2020 season a total of 55,379 influenza detections were reported.
The national influenza season started in mid-November (week 47); the start of the influenza season begins when the percentage of tests positive for influenza crosses above 5%. Influenza activity remained at peak levels (above 25% positive detections) between the end of December and February (weeks 52 to 9) with the highest percentage of tests positive for influenza, 30%, being reported at the end of January (week 5).
The influenza season ended abruptly at the end of March (week 13) when public health measures were implemented to reduce the impact of the COVID-19 pandemic in Canada (Figure 1). The end of the influenza season is marked when the percentage of tests positive for influenza crosses below 5%. In 2019-2020, the end of the influenza season occurred eight weeks earlier than the average end of season based on the previous 5 seasons. A similar abrupt decline in seasonal influenza activity during this period was observed in other countries across the Northern Hemisphere.
The sharp decline in influenza detections at the end of March 2020 was not due to a decrease in influenza testing, which continued at above-average levels throughout the spring and summer 2020 (as shown in Figure 1). Rather, the abrupt end to the influenza season at the end of March 2020 corresponds with the implementation of stringent and coordinated public health measures across the country to limit the spread of COVID-19, which included widespread public health recommendations for hand washing, mandated mask wearing, social distancing, provincial school closures and stay-at-home orders.
Figure 1: The percentage of tests positive (left) and number of influenza tests (right) as compared to previous seasons by week, Canada, season 2019-2020
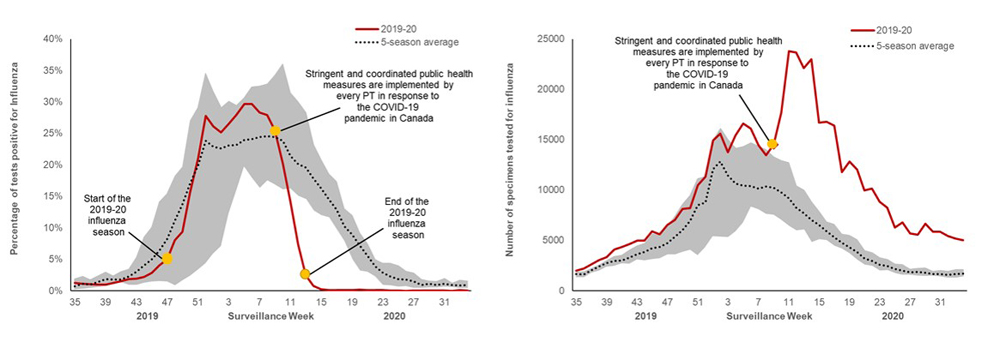
The shaded area represents the maximum and minimum percentage of tests positive (a) or number of influenza tests (b) reported by week from seasons 2014-2015 to 2018-2019. Changes in laboratory testing practices as a result of the public health response to the COVID-19 pandemic may affect the comparability of data to previous weeks during the 2019-2020 season and to previous seasons. During the 2019-2020 season one new laboratory reported compared to previous seasons, but the contribution of this data did not affect national trends.
Text description
| Surveillance Week | Percentage of tests positive, 2019-20 | Maximum Percentage of Tests Positive | Minimum Percentage of Tests Positive | Average Percentage of Tests Positive |
|---|---|---|---|---|
| 35 | 1.26% | 1.87% | 0.11% | 0.73% |
| 36 | 1.09% | 2.28% | 0.30% | 1.14% |
| 37 | 1.03% | 1.78% | 0.40% | 0.98% |
| 38 | 0.95% | 2.35% | 0.55% | 1.37% |
| 39 | 0.98% | 2.95% | 0.67% | 1.85% |
| 40 | 1.23% | 2.33% | 1.08% | 1.79% |
| 41 | 1.54% | 3.02% | 1.32% | 1.76% |
| 42 | 1.87% | 3.40% | 0.87% | 2.24% |
| 43 | 1.94% | 5.32% | 0.84% | 3.01% |
| 44 | 2.17% | 8.55% | 1.20% | 4.01% |
| 45 | 2.86% | 10.10% | 1.39% | 4.99% |
| 46 | 4.06% | 14.11% | 1.51% | 6.45% |
| 47 | 4.98% | 15.36% | 1.44% | 8.25% |
| 48 | 8.05% | 18.20% | 0.84% | 11.12% |
| 49 | 9.40% | 19.71% | 1.64% | 13.73% |
| 50 | 15.64% | 27.02% | 2.36% | 17.06% |
| 51 | 21.06% | 29.09% | 3.30% | 19.92% |
| 52 | 27.77% | 34.54% | 4.28% | 23.82% |
| 1 | 26.08% | 31.66% | 5.85% | 22.87% |
| 2 | 25.15% | 29.10% | 7.06% | 22.58% |
| 3 | 26.48% | 30.07% | 12.24% | 23.06% |
| 4 | 27.90% | 29.45% | 15.89% | 23.17% |
| 5 | 29.68% | 30.62% | 19.60% | 23.94% |
| 6 | 29.68% | 32.39% | 17.89% | 24.07% |
| 7 | 28.33% | 32.51% | 16.28% | 24.40% |
| 8 | 27.92% | 32.87% | 17.45% | 24.58% |
| 9 | 25.51% | 34.28% | 16.80% | 24.41% |
| 10 | 20.16% | 35.99% | 16.05% | 23.83% |
| 11 | 14.05% | 31.41% | 16.19% | 21.41% |
| 12 | 7.35% | 30.03% | 15.03% | 20.10% |
| 13 | 2.48% | 28.25% | 14.50% | 19.56% |
| 14 | 0.76% | 23.16% | 12.66% | 17.86% |
| 15 | 0.25% | 20.73% | 11.95% | 16.27% |
| 16 | 0.09% | 18.52% | 11.64% | 14.48% |
| 17 | 0.12% | 17.30% | 9.76% | 12.83% |
| 18 | 0.11% | 13.02% | 7.88% | 10.26% |
| 19 | 0.09% | 11.95% | 4.96% | 8.98% |
| 20 | 0.14% | 9.13% | 3.19% | 7.22% |
| 21 | 0.11% | 7.45% | 2.97% | 5.60% |
| 22 | 0.09% | 4.96% | 2.19% | 3.86% |
| 23 | 0.08% | 4.39% | 0.87% | 2.86% |
| 24 | 0.04% | 4.36% | 0.81% | 2.25% |
| 25 | 0.06% | 3.95% | 0.63% | 1.88% |
| 26 | 0.00% | 3.08% | 0.69% | 1.81% |
| 27 | 0.04% | 2.83% | 0.42% | 1.48% |
| 28 | 0.04% | 1.84% | 0.41% | 0.91% |
| 29 | 0.06% | 1.55% | 0.47% | 1.09% |
| 30 | 0.03% | 1.46% | 0.46% | 0.90% |
| 31 | 0.02% | 1.93% | 0.58% | 1.11% |
| 32 | 0.00% | 1.19% | 0.52% | 0.92% |
| 33 | 0.12% | 1.69% | 0.40% | 0.85% |
| 34 | 0.02% | 1.57% | 0.42% | 0.92% |
| Surveillance Week | Number of Tests, 2019-20 | Maximum Number of Tests | Minimum Number of Tests | Average Number of Tests |
|---|---|---|---|---|
| 35 | 1979 | 1862 | 1311 | 1650 |
| 36 | 2208 | 1880 | 1323 | 1607 |
| 37 | 2631 | 2235 | 1778 | 2036 |
| 38 | 3039 | 2567 | 1987 | 2395 |
| 39 | 3356 | 2996 | 2365 | 2759 |
| 40 | 4078 | 3384 | 2443 | 2945 |
| 41 | 4339 | 3510 | 2673 | 3020 |
| 42 | 4649 | 4020 | 2648 | 3301 |
| 43 | 4996 | 4470 | 3084 | 3635 |
| 44 | 4966 | 4703 | 2994 | 3830 |
| 45 | 5912 | 5665 | 3117 | 4227 |
| 46 | 5589 | 5449 | 3176 | 4359 |
| 47 | 6541 | 6386 | 3587 | 4713 |
| 48 | 7019 | 7416 | 3569 | 5371 |
| 49 | 8108 | 8559 | 3836 | 6031 |
| 50 | 8229 | 9464 | 4017 | 6940 |
| 51 | 10479 | 11142 | 3487 | 8491 |
| 52 | 11305 | 11338 | 4272 | 8759 |
| 1 | 14932 | 14886 | 5371 | 12076 |
| 2 | 15580 | 16104 | 5315 | 12830 |
| 3 | 13750 | 15001 | 5270 | 11434 |
| 4 | 15414 | 14146 | 5873 | 10647 |
| 5 | 16595 | 14319 | 6739 | 10428 |
| 6 | 16121 | 14687 | 8324 | 10382 |
| 7 | 14443 | 14351 | 8074 | 10122 |
| 8 | 13447 | 14024 | 7606 | 10348 |
| 9 | 14520 | 13316 | 7507 | 10244 |
| 10 | 17681 | 12933 | 7005 | 9764 |
| 11 | 23784 | 12714 | 6435 | 9175 |
| 12 | 23640 | 10431 | 5976 | 8238 |
| 13 | 22112 | 9989 | 6063 | 7699 |
| 14 | 22967 | 8830 | 4773 | 7046 |
| 15 | 16699 | 7836 | 5090 | 6527 |
| 16 | 16783 | 6826 | 5000 | 5890 |
| 17 | 16403 | 6603 | 4440 | 5305 |
| 18 | 11771 | 5640 | 4143 | 4780 |
| 19 | 12825 | 5480 | 3680 | 4311 |
| 20 | 12010 | 5097 | 3046 | 3862 |
| 21 | 9992 | 4001 | 2577 | 3197 |
| 22 | 10122 | 3790 | 2424 | 2944 |
| 23 | 8834 | 3257 | 1969 | 2591 |
| 24 | 8248 | 3120 | 2034 | 2449 |
| 25 | 6291 | 2659 | 1731 | 2148 |
| 26 | 6770 | 2600 | 1573 | 1988 |
| 27 | 5700 | 2163 | 1554 | 1833 |
| 28 | 5551 | 2223 | 1451 | 1857 |
| 29 | 6667 | 2256 | 1436 | 1796 |
| 30 | 5878 | 1950 | 1463 | 1664 |
| 31 | 5858 | 2022 | 1386 | 1671 |
| 32 | 5458 | 1928 | 1269 | 1574 |
| 33 | 5187 | 2089 | 1251 | 1671 |
| 34 | 5027 | 2098 | 1374 | 1698 |
Geographic spread of influenza/influenza-like illness (ILI) activity
All provinces and territories reported activity level data for each week of the 2019-2020 influenza season. Like in previous seasons, flu levels peaked first in Western Canada (mid-December), followed by Central Canada (early January), and lastly in Eastern Canada (early February) (Figure 2).
- Nationally, the number of surveillance regions reporting localized or widespread influenza activity remained within peak levels between mid-December to mid-March (weeks 51 to 12).
- Regionally, the number of surveillance regions reporting localized or widespread influenza activity remained within peak levels in Western Canada between mid-December to early March (weeks 51 to 11) in Central Canada between early January to mid-March (weeks 1 to 12) and in Eastern Canada between early February to early March (weeks 6 to 11).
- Localized or widespread activity was not reported by any surveillance regions in the territories at any time during the 2019-2020 influenza season.
- Maps of the level of influenza activity reported by surveillance regions each week over the course of the season can be viewed on the FluWatch maps page.
Figure 2: Number of regions reporting localized or widespread influenza activity by region and week, Canada, season 2019-2020
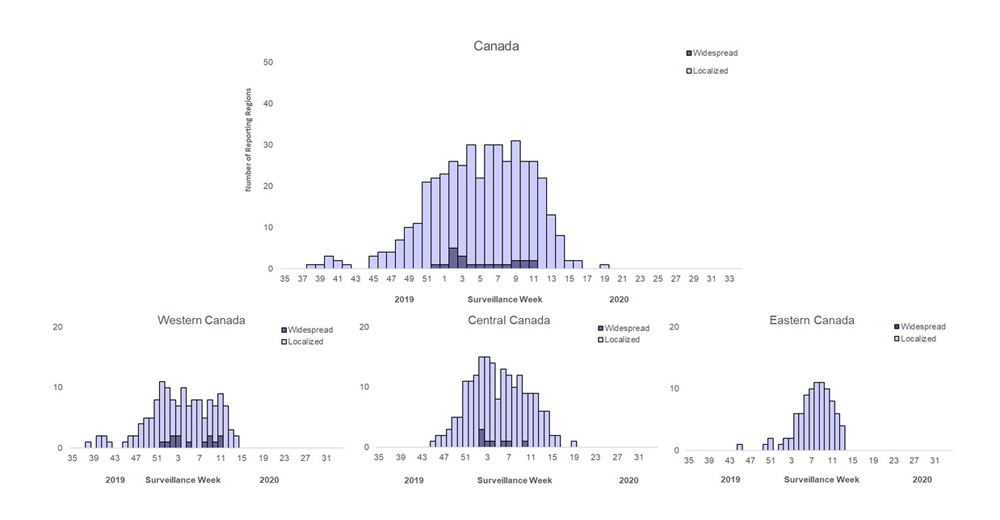
Note: Localized or widespread activity was not reported by any of the territories.
Text description
| Surveillance Week | Overall | Western | Central | East | ||||
|---|---|---|---|---|---|---|---|---|
| Localized | Widespread | Localized | Widespread | Localized | Widespread | Localized | Widespread | |
| 35 | 0 | 0 | 0 | 0 | 0 | 0 | 0 | 0 |
| 36 | 0 | 0 | 0 | 0 | 0 | 0 | 0 | 0 |
| 37 | 0 | 0 | 0 | 0 | 0 | 0 | 0 | 0 |
| 38 | 1 | 0 | 1 | 0 | 0 | 0 | 0 | 0 |
| 39 | 1 | 0 | 0 | 0 | 0 | 0 | 0 | 0 |
| 40 | 3 | 0 | 2 | 0 | 0 | 0 | 0 | 0 |
| 41 | 2 | 0 | 2 | 0 | 0 | 0 | 0 | 0 |
| 42 | 1 | 0 | 1 | 0 | 0 | 0 | 0 | 0 |
| 43 | 0 | 0 | 0 | 0 | 0 | 0 | 0 | 0 |
| 44 | 0 | 0 | 0 | 0 | 0 | 0 | 0 | 0 |
| 45 | 3 | 0 | 1 | 0 | 1 | 0 | 1 | 0 |
| 46 | 4 | 0 | 2 | 0 | 2 | 0 | 0 | 0 |
| 47 | 4 | 0 | 2 | 0 | 2 | 0 | 0 | 0 |
| 48 | 7 | 0 | 4 | 0 | 3 | 0 | 0 | 0 |
| 49 | 10 | 0 | 5 | 0 | 5 | 0 | 0 | 0 |
| 50 | 11 | 0 | 5 | 0 | 5 | 0 | 1 | 0 |
| 51 | 21 | 0 | 8 | 0 | 11 | 0 | 2 | 0 |
| 52 | 21 | 1 | 10 | 1 | 11 | 0 | 0 | 0 |
| 1 | 22 | 1 | 9 | 1 | 12 | 0 | 1 | 0 |
| 2 | 21 | 5 | 6 | 2 | 12 | 3 | 2 | 0 |
| 3 | 22 | 3 | 5 | 2 | 14 | 1 | 2 | 0 |
| 4 | 29 | 1 | 10 | 0 | 13 | 1 | 6 | 0 |
| 5 | 21 | 1 | 6 | 1 | 8 | 0 | 6 | 0 |
| 6 | 29 | 1 | 8 | 0 | 12 | 1 | 9 | 0 |
| 7 | 29 | 1 | 8 | 0 | 11 | 1 | 10 | 0 |
| 8 | 25 | 1 | 4 | 1 | 10 | 0 | 11 | 0 |
| 9 | 29 | 2 | 6 | 2 | 12 | 0 | 11 | 0 |
| 10 | 24 | 2 | 6 | 1 | 8 | 1 | 10 | 0 |
| 11 | 24 | 2 | 7 | 2 | 9 | 0 | 8 | 0 |
| 12 | 22 | 0 | 7 | 0 | 9 | 0 | 6 | 0 |
| 13 | 13 | 0 | 3 | 0 | 6 | 0 | 4 | 0 |
| 14 | 8 | 0 | 2 | 0 | 6 | 0 | 0 | 0 |
| 15 | 2 | 0 | 0 | 0 | 2 | 0 | 0 | 0 |
| 16 | 2 | 0 | 0 | 0 | 2 | 0 | 0 | 0 |
| 17 | 0 | 0 | 0 | 0 | 0 | 0 | 0 | 0 |
| 18 | 0 | 0 | 0 | 0 | 0 | 0 | 0 | 0 |
| 19 | 1 | 0 | 0 | 0 | 1 | 0 | 0 | 0 |
| 20 | 0 | 0 | 0 | 0 | 0 | 0 | 0 | 0 |
| 21 | 0 | 0 | 0 | 0 | 0 | 0 | 0 | 0 |
| 22 | 0 | 0 | 0 | 0 | 0 | 0 | 0 | 0 |
| 23 | 0 | 0 | 0 | 0 | 0 | 0 | 0 | 0 |
| 24 | 0 | 0 | 0 | 0 | 0 | 0 | 0 | 0 |
| 25 | 0 | 0 | 0 | 0 | 0 | 0 | 0 | 0 |
| 26 | 0 | 0 | 0 | 0 | 0 | 0 | 0 | 0 |
| 27 | 0 | 0 | 0 | 0 | 0 | 0 | 0 | 0 |
| 28 | 0 | 0 | 0 | 0 | 0 | 0 | 0 | 0 |
| 29 | 0 | 0 | 0 | 0 | 0 | 0 | 0 | 0 |
| 30 | 0 | 0 | 0 | 0 | 0 | 0 | 0 | 0 |
| 31 | 0 | 0 | 0 | 0 | 0 | 0 | 0 | 0 |
| 32 | 0 | 0 | 0 | 0 | 0 | 0 | 0 | 0 |
| 33 | 0 | 0 | 0 | 0 | 0 | 0 | 0 | 0 |
| 34 | 0 | 0 | 0 | 0 | 0 | 0 | 0 | 0 |
Influenza types and subtypes observed during the 2019-2020 influenza season
During the 2019-2020 season, all seasonal influenza types and subtypes circulated (Figure 3). Among the 55,379 laboratory detections of influenza reported, 95% were reported between end of August and early March (weeks 35 to 11).
- Influenza A circulated predominantly compared to influenza B, however, more influenza B was reported compared to previous seasons. In 2019-2020, 59% (32,690) of detections were influenza A.
- Influenza B also circulated earlier in the season compared to previous years and co-circulated with influenza A throughout the season.
- Among subtyped influenza A detections (7,332), A(H1N1) was the overall predominant subtype during the 2019-2020 season (68%).
- Influenza A (H1N1) and A(H3N2) co-circulated throughout the 2019-2020 season; A(H3N2) was predominant earlier in the season, followed by A(H1N1).
Figure 3: Number of positive influenza tests and percentage of positive tests by type, subtype and week, Canada, season 2019-2020
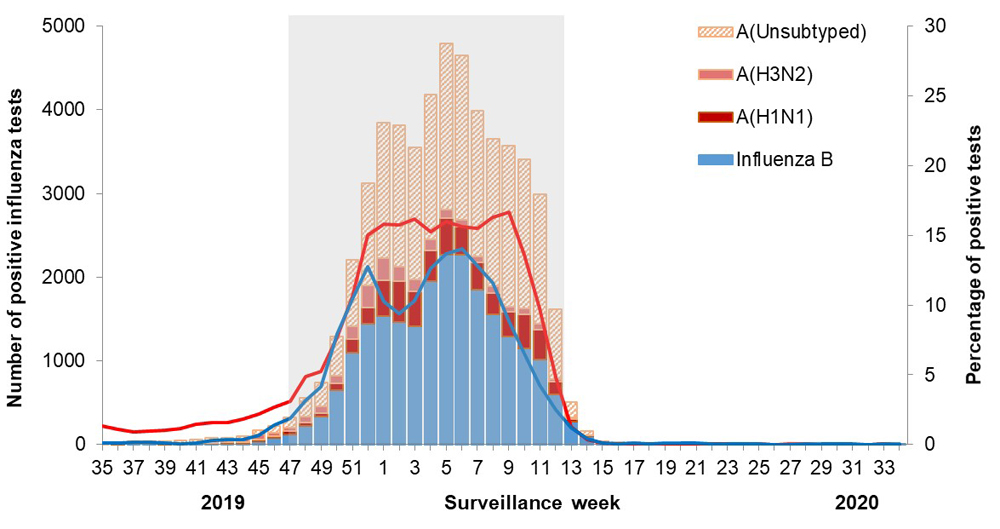
The shaded area indicates weeks where the positivity rate was at least 5% and a minimum of 15 positive tests were observed, signaling the period of seasonal influenza activity.
Text description
| Surveillance Week | A(Unsubtyped) | A(H3N2) | A(H1N1) | Influenza B | Percent Positive A | Percent Positive B |
|---|---|---|---|---|---|---|
| 35 | 10 | 16 | 0 | 2 | 1.3 | 0.1 |
| 36 | 11 | 13 | 2 | 2 | 1.1 | 0.1 |
| 37 | 5 | 17 | 2 | 5 | 0.9 | 0.2 |
| 38 | 11 | 15 | 3 | 6 | 1.0 | 0.2 |
| 39 | 11 | 21 | 2 | 3 | 1.0 | 0.1 |
| 40 | 34 | 9 | 1 | 2 | 1.2 | 0.1 |
| 41 | 34 | 18 | 0 | 5 | 1.4 | 0.1 |
| 42 | 54 | 12 | 1 | 14 | 1.6 | 0.3 |
| 43 | 44 | 13 | 7 | 17 | 1.6 | 0.3 |
| 44 | 43 | 23 | 16 | 17 | 1.8 | 0.3 |
| 45 | 57 | 57 | 20 | 39 | 2.2 | 0.7 |
| 46 | 82 | 43 | 23 | 77 | 2.7 | 1.4 |
| 47 | 118 | 49 | 33 | 124 | 3.1 | 1.9 |
| 48 | 225 | 67 | 42 | 223 | 4.9 | 3.2 |
| 49 | 281 | 79 | 41 | 336 | 5.3 | 4.1 |
| 50 | 463 | 100 | 73 | 654 | 7.7 | 8.0 |
| 51 | 794 | 149 | 169 | 1094 | 10.6 | 10.4 |
| 52 | 1223 | 267 | 197 | 1439 | 15.0 | 12.7 |
| 1 | 1620 | 261 | 431 | 1533 | 15.8 | 10.3 |
| 2 | 1690 | 165 | 493 | 1463 | 15.8 | 9.4 |
| 3 | 1575 | 139 | 417 | 1418 | 16.2 | 10.3 |
| 4 | 1727 | 133 | 370 | 1952 | 15.2 | 12.7 |
| 5 | 1983 | 97 | 440 | 2269 | 16.0 | 13.7 |
| 6 | 1970 | 75 | 344 | 2265 | 15.6 | 14.1 |
| 7 | 1741 | 76 | 321 | 1851 | 15.5 | 12.8 |
| 8 | 1768 | 74 | 255 | 1559 | 16.3 | 11.6 |
| 9 | 1928 | 58 | 303 | 1287 | 16.7 | 8.9 |
| 10 | 1772 | 81 | 399 | 1152 | 13.6 | 6.5 |
| 11 | 1552 | 70 | 354 | 1015 | 9.8 | 4.3 |
| 12 | 832 | 38 | 154 | 595 | 4.8 | 2.5 |
| 13 | 185 | 19 | 39 | 269 | 1.3 | 1.2 |
| 14 | 48 | 5 | 11 | 97 | 0.3 | 0.4 |
| 15 | 14 | 1 | 7 | 19 | 0.1 | 0.1 |
| 16 | 1 | 0 | 3 | 11 | 0.0 | 0.1 |
| 17 | 5 | 1 | 0 | 14 | 0.0 | 0.1 |
| 18 | 4 | 0 | 0 | 9 | 0.0 | 0.1 |
| 19 | 0 | 0 | 0 | 12 | 0.0 | 0.1 |
| 20 | 6 | 0 | 0 | 11 | 0.1 | 0.1 |
| 21 | 1 | 0 | 1 | 9 | 0.0 | 0.1 |
| 22 | 5 | 0 | 0 | 4 | 0.1 | 0.0 |
| 23 | 2 | 0 | 3 | 2 | 0.1 | 0.0 |
| 24 | 1 | 0 | 0 | 2 | 0.0 | 0.0 |
| 25 | 3 | 0 | 0 | 1 | 0.1 | 0.0 |
| 26 | 0 | 0 | 0 | 0 | 0.0 | 0.0 |
| 27 | 1 | 0 | 1 | 0 | 0.0 | 0.0 |
| 28 | 1 | 0 | 0 | 1 | 0.0 | 0.0 |
| 29 | 1 | 0 | 0 | 3 | 0.0 | 0.0 |
| 30 | 0 | 0 | 0 | 2 | 0.0 | 0.0 |
| 31 | 0 | 0 | 0 | 1 | 0.0 | 0.0 |
| 32 | 0 | 0 | 0 | 0 | 0.0 | 0.0 |
| 33 | 2 | 0 | 1 | 3 | 0.1 | 0.1 |
| 34 | 0 | 0 | 0 | 1 | 0.0 | 0.0 |
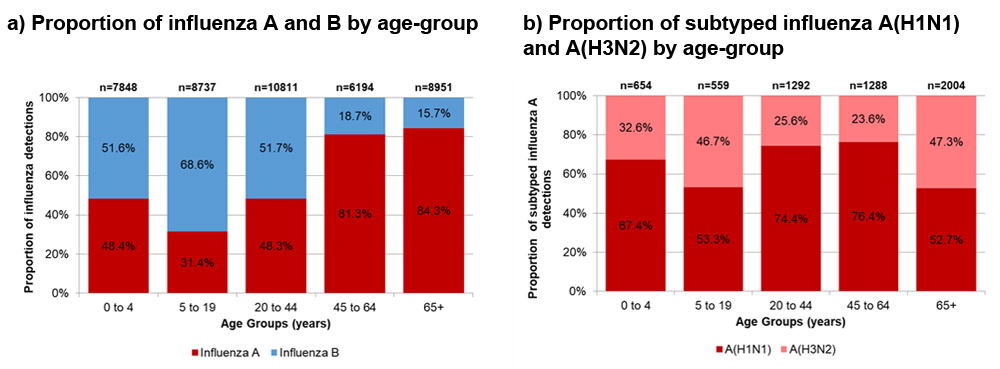
Detailed information on age and influenza type/subtype was received for 42,541 laboratory-confirmed influenza cases; 24,347 influenza A and 18,194 influenza B. Among all influenza detections, the proportion of influenza A and B varied by age group. Similarly, among influenza A detections where subtype was identified (5,797), subtype distribution varied by age group.
- Influenza B comprised the majority (57%) of cases among those 0 to 45 years of age. Influenza A was predominant among adults 45 years of age and older (83%) (Figure 4a).
- Sub-typed influenza A cases were predominantly influenza A(H1N1), although among children ages 5-19 years and older adults 65 years of age and older, subtyped influenza A detections were more evenly distributed between A(H1N1) and A(H3N2) (Figure 4b).
Figure 4: Proportion of positive influenza specimens by age group and type/subtype reported through case-based laboratory reporting, Canada, season 2019-2020
Text description
| Age Group | Proportion of Influenza A | Proportion of Influenza B | Total Number Influenza Detections |
|---|---|---|---|
| 0 to 4 | 48.4% | 51.6% | 7848 |
| 5 to 19 | 31.4% | 68.6% | 8737 |
| 20 to 44 | 48.3% | 51.7% | 10811 |
| 45 to 64 | 81.3% | 18.7% | 6194 |
| 65+ | 84.3% | 15.7% | 8951 |
| Age Group | Proportion of A(H1N1) | Proportion of A(H3N2) | Total Number of Subtyped Influenza Detections |
|---|---|---|---|
| 0 to 4 | 67.4% | 32.6% | 654 |
| 5 to 19 | 53.3% | 46.7% | 559 |
| 20 to 44 | 74.4% | 25.6% | 1292 |
| 45 to 64 | 76.4% | 23.6% | 1288 |
| 65+ | 52.7% | 47.3% | 2004 |
Syndromic / influenza-like illness (ILI) surveillance
Healthcare practitioners sentinel syndromic surveillance
During the 2019-2020 season, an average of 89 healthcare practitioners/centres across the country participated each week in influenza-like illness (ILI) surveillance for the FluWatch program (Figure 5). On a weekly basis, these sentinel healthcare practitioners report the proportion of patients in their practice who had ILI based on the FluWatch definition:
Sudden onset of flu symptoms with fever and cough and with one or more of the following: sore throat, joint pain, muscle aches, or fatigue which is likely due to the flu.
- Children younger than 5 years old might also have symptoms like nausea, vomiting and diarrhea.
- Patients younger than 5 years old or 65 and older might not have a fever.
Beginning in mid-March (week 11), lower than usual percent of visits for ILI were reported to the FluWatch program through the spring and summer months, due to changes in healthcare seeking behavior of individuals, the implementation of non-pharmaceutical public health measures to reduce COVID-19, and a decreasing number of sentinel healthcare practitioners reporting to FluWatch. From weeks 35 to 10, an average of 9,751 patients were seen by an average of 98 sentinels; from weeks 11 onwards, an average of 6,268 patients were seen by an average of 76 sentinels. Although a decrease in reporting is expected during the summer months, the decrease was greater this season compared to the previous season. In the 2018-2019 season, from weeks 35 to 10, an average of 9,164 patients were seen by an average of 113 sentinels; from week 11 onwards, average of 7,919 patients were seen from an average of 97 sentinels.
- Overall, ILI activity was below the five-year average for the majority of weeks this influenza season.
- During active influenza season (mid-November to end-March: weeks 47 to 13), 1.4% of all patient visits reported by sentinels were due to ILI.
- The percentage of visits for ILI reported by sentinels peaked at the start of January (week 1) at 2.9%.
- For the majority of the season, the highest percentage of visits for ILI was reported among those less than 20 years of age. The lowest percentage of visits for ILI was reported among adults 65 years of age and older.
Figure 5: Percentage of visits for ILI reported by sentinels by week, Canada, season 2019-2020
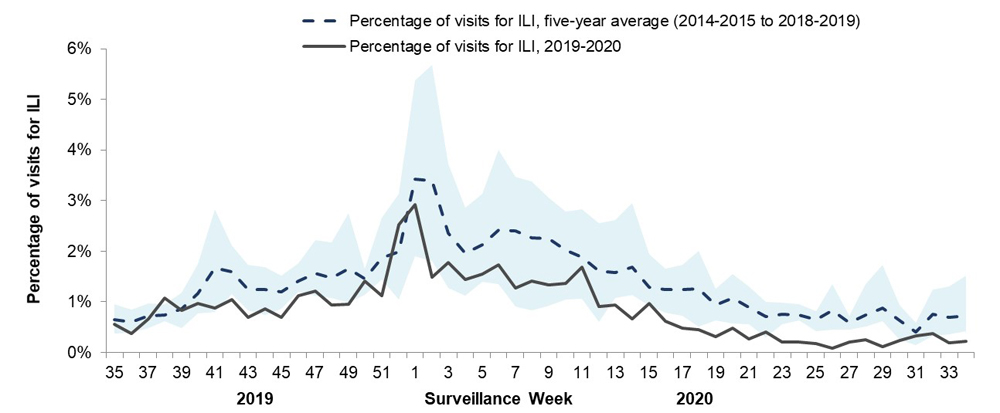
The shaded area represents the maximum and minimum percentage of visits for ILI reported by week from seasons 2013-2014 to 2018-2019
Text description
| Surveillance Week | 2019-2020 | Average | Min | Max |
|---|---|---|---|---|
| 35 | 0.6% | 0.6% | 0.4% | 0.9% |
| 36 | 0.4% | 0.6% | 0.4% | 0.9% |
| 37 | 0.7% | 0.7% | 0.5% | 1.0% |
| 38 | 1.1% | 0.7% | 0.6% | 1.0% |
| 39 | 0.8% | 0.9% | 0.5% | 1.2% |
| 40 | 1.0% | 1.2% | 0.8% | 1.7% |
| 41 | 0.9% | 1.7% | 0.8% | 2.8% |
| 42 | 1.1% | 1.6% | 1.2% | 2.1% |
| 43 | 0.7% | 1.2% | 0.8% | 1.7% |
| 44 | 0.9% | 1.2% | 0.7% | 1.7% |
| 45 | 0.7% | 1.2% | 0.9% | 1.5% |
| 46 | 1.1% | 1.4% | 1.2% | 1.8% |
| 47 | 1.2% | 1.6% | 1.1% | 2.2% |
| 48 | 0.9% | 1.5% | 1.1% | 2.2% |
| 49 | 1.0% | 1.7% | 1.0% | 2.8% |
| 50 | 1.4% | 1.5% | 1.1% | 1.7% |
| 51 | 1.1% | 1.9% | 1.4% | 2.7% |
| 52 | 2.5% | 2.0% | 1.0% | 3.1% |
| 1 | 2.9% | 3.4% | 1.9% | 5.4% |
| 2 | 1.5% | 3.4% | 1.8% | 5.7% |
| 3 | 1.8% | 2.3% | 1.3% | 3.7% |
| 4 | 1.4% | 2.0% | 1.1% | 2.9% |
| 5 | 1.5% | 2.1% | 1.4% | 3.1% |
| 6 | 1.7% | 2.4% | 1.4% | 4.0% |
| 7 | 1.3% | 2.4% | 0.9% | 3.5% |
| 8 | 1.4% | 2.3% | 0.8% | 3.4% |
| 9 | 1.3% | 2.3% | 0.9% | 3.1% |
| 10 | 1.4% | 2.0% | 1.0% | 2.8% |
| 11 | 1.7% | 1.9% | 1.1% | 2.8% |
| 12 | 0.9% | 1.6% | 0.6% | 2.6% |
| 13 | 0.9% | 1.6% | 1.1% | 2.6% |
| 14 | 0.7% | 1.7% | 1.1% | 3.0% |
| 15 | 1.0% | 1.3% | 0.9% | 1.9% |
| 16 | 0.6% | 1.2% | 0.8% | 1.7% |
| 17 | 0.5% | 1.2% | 0.7% | 1.7% |
| 18 | 0.5% | 1.3% | 0.5% | 2.0% |
| 19 | 0.3% | 0.9% | 0.6% | 1.3% |
| 20 | 0.5% | 1.1% | 0.6% | 1.5% |
| 21 | 0.3% | 0.9% | 0.5% | 1.3% |
| 22 | 0.4% | 0.7% | 0.3% | 1.0% |
| 23 | 0.2% | 0.8% | 0.6% | 1.0% |
| 24 | 0.2% | 0.7% | 0.6% | 1.0% |
| 25 | 0.2% | 0.6% | 0.4% | 0.8% |
| 26 | 0.1% | 0.8% | 0.5% | 1.4% |
| 27 | 0.2% | 0.6% | 0.5% | 0.7% |
| 28 | 0.3% | 0.7% | 0.5% | 1.3% |
| 29 | 0.1% | 0.9% | 0.6% | 1.7% |
| 30 | 0.2% | 0.6% | 0.2% | 0.9% |
| 31 | 0.3% | 0.4% | 0.2% | 0.6% |
| 32 | 0.4% | 0.8% | 0.3% | 1.2% |
| 33 | 0.2% | 0.7% | 0.4% | 1.3% |
| 34 | 0.2% | 0.7% | 0.4% | 1.5% |
FluWatchers
FluWatchers are volunteers across Canada who report whether they have had symptoms of ILI in the preceding week, via a weekly online questionnaire. FluWatchers surveillance for the 2019-2020 season started in October (week 40) and due to the COVID-19 pandemic, continued to the end of the season in August (week 34) instead of ceasing in week 18, as was done in the previous three seasons.
Between weeks 40 and 13 (September 29 to October 5 and March 22 to March 28), an average of 3,139 participants reported each week. The average number of weekly participants increased to 10,280 between weeks 14 and 34, due to FluWatchers spring recruitment activities in response to the COVID-19 pandemic. Overall, a total of 16,681 participants reported at least once this season, resulting in 297,520 completed questionnaires.
The percentage of FluWatchers reporting ILI, as defined by fever and cough, peaked at the start of January (week 1) at 4.3% (Figure 6). Peak ILI activity within the FluWatchers program coincided with laboratory influenza activity which remained at peak levels (above 25% positive detections) between weeks 52 to 9. A downward trend of ILI among FluWatchers was observed starting in week 11 onwards, despite the influx of new participants.
Non-pharmaceutical public health measures were widely implemented across Canada during mid-March (week 11), after which, reports of cough and fever among FluWatchers markedly decreased and remained at low levels (<0.30%) through the spring and summer months. This trend was consistent with other influenza indicators.
- There are FluWatchers participants reporting from each province and territory. The majority of participants reside in Ontario (45%).
- The majority (75%) of FluWatchers participants were adults 20 to 64 years of age, which is overrepresented compared to the same age group in the Canadian population (54%). The age distribution of all FluWatchers participants this season was as follows:
- 2%: 0 to 4 years of age
- 11%: 5 to19 years of age
- 40%: 20 to 44 years of age
- 35%: 45 to 64 years of age
- 10%: 65 years of age and older
- Between weeks 40 and 10 (prior to the implementation of physical/social distancing measures):
- 24% (1,148) of FluWatchers reported experiencing cough and fever at least once. This is lower than the previous season (31%).
- There were a total of 1,770 reports of cough and fever, of which 75% (1,324) reported at least 24 hours off work or school, which is comparable to the previous season (73%).
- Among those reporting ILI, 23% (403) reported a visit to a health care practitioner, which is higher than the previous season (19%).
- Between weeks 11 and 34, after the implementation of non-pharmaceutical public health measures and given the few influenza laboratory detections, the majority of reports of cough and fever were likely related to other respiratory illnesses, including COVID-19.
- Approximately 3.0% (365) of FluWatchers reported experiencing cough and fever at least once. This is lower than what was reported during the active 2019-2020 influenza season, however, not unexpected given the seasonal pattern of influenza and impact of the public health measures to prevent the spread of Covid-19.
- There were a total of 522 reports of cough and fever, of which 60% (307) reported at least 24 hours off work or school, which is lower than what was reported during flu season. Among those reporting ILI, 43% (227) reported a visit to a health care practitioner, which is higher than during the active flu season, but not unexpected due to the changes in health guidance and/or health seeking behaviour of individuals with symptoms compatible with COVID-19.
Figure 6: Percentage of participants reporting fever and cough by week, Canada, season 2019-2020
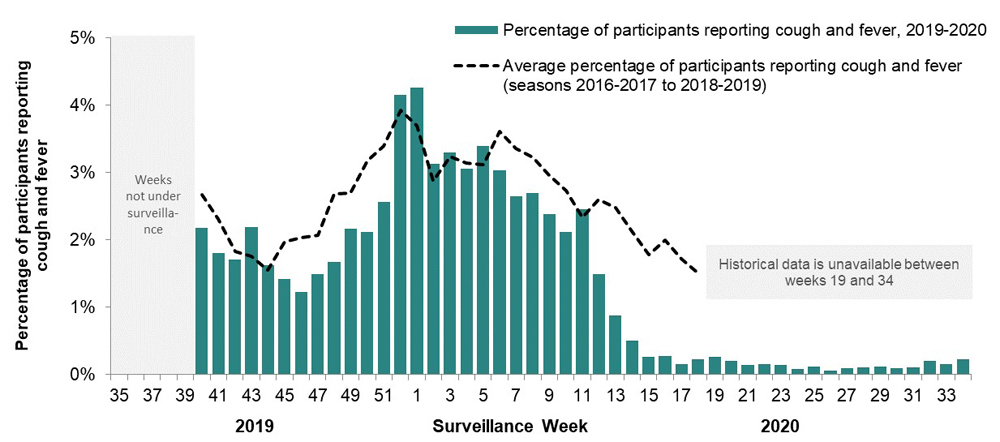
FluWatchers surveillance is active from weeks 40 to 18 during a typical season. Historical data is unavailable between weeks 19 and 34.
Text description
| Surveillance Week | 2019-2020 | Average | Min | Max |
|---|---|---|---|---|
| 35 | N/A | N/A | N/A | N/A |
| 36 | N/A | N/A | N/A | N/A |
| 37 | N/A | N/A | N/A | N/A |
| 38 | N/A | N/A | N/A | N/A |
| 39 | N/A | N/A | N/A | N/A |
| 40 | 2.18% | 2.68% | 2.18% | 2.71% |
| 41 | 1.81% | 2.31% | 1.81% | 2.57% |
| 42 | 1.71% | 1.83% | 1.61% | 2.03% |
| 43 | 2.18% | 1.76% | 1.49% | 2.18% |
| 44 | 1.63% | 1.55% | 1.39% | 1.78% |
| 45 | 1.42% | 1.97% | 1.42% | 2.32% |
| 46 | 1.22% | 2.04% | 1.22% | 2.15% |
| 47 | 1.50% | 2.07% | 1.44% | 2.39% |
| 48 | 1.67% | 2.69% | 1.67% | 3.35% |
| 49 | 2.17% | 2.69% | 1.97% | 3.16% |
| 50 | 2.12% | 3.17% | 2.12% | 3.79% |
| 51 | 2.56% | 3.39% | 2.53% | 3.95% |
| 52 | 4.15% | 3.93% | 2.81% | 5.38% |
| 1 | 4.26% | 3.70% | 2.85% | 4.76% |
| 2 | 3.13% | 2.88% | 1.90% | 3.93% |
| 3 | 3.30% | 3.24% | 2.35% | 4.84% |
| 4 | 3.06% | 3.14% | 2.13% | 4.23% |
| 5 | 3.39% | 3.12% | 2.62% | 3.59% |
| 6 | 3.03% | 3.61% | 2.76% | 4.28% |
| 7 | 2.65% | 3.36% | 2.58% | 3.79% |
| 8 | 2.70% | 3.22% | 2.54% | 3.65% |
| 9 | 2.38% | 2.96% | 2.38% | 3.53% |
| 10 | 2.12% | 2.73% | 2.12% | 3.11% |
| 11 | 2.46% | 2.33% | 1.89% | 2.63% |
| 12 | 1.50% | 2.60% | 2.46% | 2.82% |
| 13 | 0.87% | 2.48% | 1.99% | 3.06% |
| 14 | 0.50% | 2.13% | 1.35% | 2.58% |
| 15 | 0.27% | 1.78% | 1.60% | 1.93% |
| 16 | 0.28% | 2.00% | 1.47% | 2.44% |
| 17 | 0.16% | 1.73% | 1.40% | 2.31% |
| 18 | 0.23% | 1.50% | 1.19% | 2.09% |
| 19 | 0.26% | N/A | N/A | N/A |
| 20 | 0.20% | N/A | N/A | N/A |
| 21 | 0.15% | N/A | N/A | N/A |
| 22 | 0.16% | N/A | N/A | N/A |
| 23 | 0.15% | N/A | N/A | N/A |
| 24 | 0.09% | N/A | N/A | N/A |
| 25 | 0.12% | N/A | N/A | N/A |
| 26 | 0.06% | N/A | N/A | N/A |
| 27 | 0.09% | N/A | N/A | N/A |
| 28 | 0.11% | N/A | N/A | N/A |
| 29 | 0.12% | N/A | N/A | N/A |
| 30 | 0.10% | N/A | N/A | N/A |
| 31 | 0.11% | N/A | N/A | N/A |
| 32 | 0.20% | N/A | N/A | N/A |
| 33 | 0.16% | N/A | N/A | N/A |
| 34 | 0.23% | N/A | N/A | N/A |
Influenza outbreak surveillance
Influenza and ILI outbreak activity reports were provided by all provinces and territories each week this season, in the following settings: long term care facilities (LTCF), acute care facilities, school and/or daycares, and settings categorized as “other” (i.e. retirement homes, correctional facilities, personal care homes, work camps and workplaces). Settings under surveillance vary by province and territory.
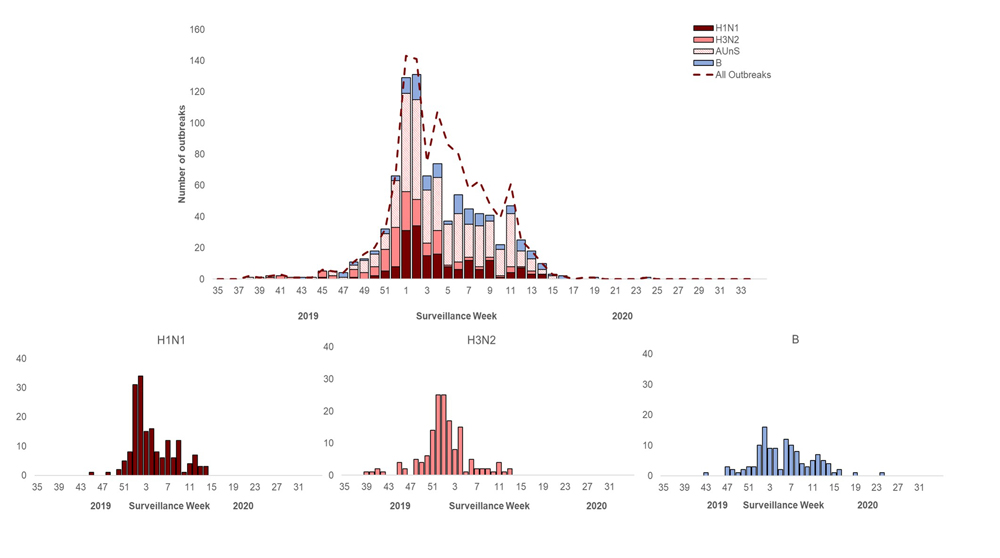
A total of 978 laboratory-confirmed influenza outbreaks were reported (Figure 7).
- Outbreaks caused by all circulating seasonal influenza types occurred throughout the influenza season, in a temporal pattern similar to that observed in laboratory detections. Overall, the number of influenza and ILI outbreaks peaked in early January (week 1) with smaller peaks observed in late January and early March (weeks 4 to 11).
- Among the outbreaks for which influenza type was available (939), 84% (793) were associated with influenza A, 13% (124) were associated with influenza B, and 3% (22) were a combination of influenza A and B.
- Among the outbreaks for which influenza subtype was available (331), 53% were associated with H1N1, 45% were associated with H3N2 and 2% were a combination of H1N1 and H3N2.
- 64% (630) of reported lab confirmed outbreaks were in LTCF, 9% (89) were in acute care facilities, 2% (15) in schools and/or daycares and 25% (244) were in other settings.
In addition to the laboratory-confirmed influenza outbreaks, a total of 175 outbreaks of ILI were reported; 172 occurred in schools and/or daycares and three occurred in settings categorized as “other”.
Figure 7: Number of influenza outbreaks by type, subtype and week, Canada, season 2019-2020
Text description
| Surveillance Week | H1N1 | H3N2 | AUnS | B | All Outbreaks |
|---|---|---|---|---|---|
| 35 | 0 | 0 | 0 | 0 | 0 |
| 36 | 0 | 0 | 0 | 0 | 0 |
| 37 | 0 | 0 | 0 | 0 | 0 |
| 38 | 0 | 0 | 1 | 0 | 2 |
| 39 | 0 | 1 | 0 | 0 | 1 |
| 40 | 0 | 1 | 1 | 0 | 2 |
| 41 | 0 | 2 | 0 | 0 | 3 |
| 42 | 0 | 1 | 0 | 0 | 1 |
| 43 | 0 | 0 | 0 | 1 | 1 |
| 44 | 0 | 0 | 1 | 0 | 1 |
| 45 | 1 | 4 | 0 | 0 | 6 |
| 46 | 0 | 2 | 3 | 0 | 5 |
| 47 | 0 | 0 | 1 | 3 | 4 |
| 48 | 1 | 5 | 3 | 2 | 11 |
| 49 | 0 | 4 | 8 | 1 | 16 |
| 50 | 2 | 6 | 8 | 2 | 20 |
| 51 | 5 | 14 | 10 | 3 | 32 |
| 52 | 8 | 25 | 30 | 3 | 67 |
| 1 | 31 | 25 | 63 | 10 | 143 |
| 2 | 34 | 17 | 64 | 16 | 141 |
| 3 | 15 | 8 | 34 | 9 | 75 |
| 4 | 16 | 15 | 34 | 9 | 107 |
| 5 | 8 | 1 | 26 | 2 | 86 |
| 6 | 6 | 5 | 31 | 12 | 80 |
| 7 | 12 | 2 | 21 | 10 | 58 |
| 8 | 6 | 2 | 26 | 8 | 63 |
| 9 | 12 | 2 | 23 | 4 | 48 |
| 10 | 1 | 1 | 17 | 3 | 39 |
| 11 | 4 | 4 | 34 | 5 | 61 |
| 12 | 7 | 1 | 10 | 7 | 25 |
| 13 | 3 | 2 | 8 | 5 | 18 |
| 14 | 3 | 0 | 3 | 4 | 10 |
| 15 | 0 | 0 | 2 | 1 | 3 |
| 16 | 0 | 0 | 0 | 2 | 2 |
| 17 | 0 | 0 | 0 | 0 | 0 |
| 18 | 0 | 0 | 0 | 0 | 1 |
| 19 | 0 | 0 | 0 | 1 | 1 |
| 20 | 0 | 0 | 0 | 0 | 0 |
| 21 | 0 | 0 | 0 | 0 | 0 |
| 22 | 0 | 0 | 0 | 0 | 0 |
| 23 | 0 | 0 | 0 | 0 | 0 |
| 24 | 0 | 0 | 0 | 1 | 1 |
| 25 | 0 | 0 | 0 | 0 | 0 |
| 26 | 0 | 0 | 0 | 0 | 0 |
| 27 | 0 | 0 | 0 | 0 | 0 |
| 28 | 0 | 0 | 0 | 0 | 0 |
| 29 | 0 | 0 | 0 | 0 | 0 |
| 30 | 0 | 0 | 0 | 0 | 0 |
| 31 | 0 | 0 | 0 | 0 | 0 |
| 32 | 0 | 0 | 0 | 0 | 0 |
| 33 | 0 | 0 | 0 | 0 | 0 |
| 34 | 0 | 0 | 0 | 0 | 0 |
Severe outcomes influenza surveillance
Data on severe outcomes associated with influenza in Canada are reported by participating provincial and territorial ministries of health (PT-SOS) as well as two sentinel hospital networks: the Immunization Monitoring Program Active (IMPACT) network and the Canadian Immunization Research Network's Serious Outcome Surveillance Network (CIRN-SOS).
PT-SOS comprises of both pediatric and adult influenza hospitalizations from acute care hospitals in nine province and territoriesFootnote 2. CIRN-SOS reports adult (16 years of age and older) influenza hospitalizations and deaths while IMPACT reports pediatric (16 years of age and under) influenza hospitalizations. CIRN-SOS network consist of nine hospitals across four provincesFootnote 3 and the IMPACT network consists of 12 pediatric hospitals across eight provincesFootnote 4.
Hospitalizations
During the 2019-2020 influenza season, 2,493 influenza-associated hospitalizations were reported by participating provinces and territories, which corresponds to an annual seasonal hospitalization incidence of 31 hospitalizations per 100,000 population in the 2019-2020 season (Table 1a).
- The majority of hospitalizations, 69% (1,709), were associated with influenza A.
- Among the 1,103 hospitalized cases for which the influenza subtype was available, an equal proportion of cases was associated with influenza A(H1N1) and A(H3N2).
- The hospitalization rate associated with influenza A was two times higher than the rate associated with influenza B (Table 1b).
- The hospitalization rate in the 2019-2020 season (30 per 100,000 population) was below average compared to the previous five seasons (42 per 100,000 population), and was lower than the previous five annual seasonal hospitalization rates (range: 34 to 64 per 100,000 population). The lower hospitalization rate relative to previous five seasons is likely due to the truncated influenza season owing to the public health measures put in place to mitigate the spread of COVID-19. This pattern was also observed in the CIRN-SOS and IMPACT data (Figure 8):
- CIRN-SOS adult hospitalizations declined dramatically beginning in week 14, as only 11 hospitalizations were reported from week 14 to the end of the season. In contrast, in the 2018-2019 season, 151 hospitalizations were reported from week 14 onwards.
- IMPACT pediatric hospitalizations started to decline dramatically in week 13 with only 10 cases observed from week 13 to the end of the season. In the previous five seasons, an average of 191 cases was observed for this same time period.
- Overall, influenza A associated hospitalization rates were highest in adults ≥ 20 years of age while influenza B associated hospitalization rates were highest in children and adolescents < 20 years of age (Table 1b). These observations were also seen in the CIRN-SOS and IMPACT data:
- The majority 79% (623) of adult influenza hospitalizations reported by CIRN-SOS were associated with influenza A (Figure 9).
- IMPACT reported similar proportions of pediatric hospitalized cases associated with influenza A and B. The percentage of hospitalizations associated with influenza B (49%) was the highest proportion of influenza B observed in the last five years (the previous highest proportion (38%) was observed in the 2017-2018 influenza season).
- Overall adults 65 years of age and older and children 0 to 4 years of age had the highest rates of hospitalization (Table 1b).
| Age groups (years) | Influenza season (predominant influenza A subtype) | |||||
|---|---|---|---|---|---|---|
| 2014-15 (H3N2) |
2015-16 (H1N1) |
2016-17 (H3N2) |
2017-18 (H3N2) |
2018-19 (H1N1) |
2019-20 (H1N1) |
|
| 0 to 4 | 46 | 96 | 42 | 69 | 97 | 75 |
| 5 to 19 | 16 | 16 | 10 | 17 | 22 | 16 |
| 20 to 44 | 13 | 16 | 6 | 12 | 14 | 14 |
| 45 to 64 | 16 | 37 | 22 | 41 | 40 | 23 |
| ≥65 | 207 | 68 | 143 | 268 | 132 | 79 |
| Overall | 45 | 34 | 34 | 64 | 45 | 30 |
| Age groups (years) | Influenza type and subtype | ||||
|---|---|---|---|---|---|
| H1N1 | H3N2 | A | B | Overall | |
| 0 to 4 | 17 | 9 | 41 | 34 | 75 |
| 5 to 19 | 2 | 2 | 5 | 11 | 16 |
| 20 to 44 | 3 | 2 | 8 | 6 | 14 |
| 45 to 64 | 7 | 4 | 18 | 4 | 23 |
| ≥65 | 16 | 27 | 64 | 15 | 79 |
| Overall | 7 | 7 | 21 | 10 | 30 |
Influenza-associated hospitalizations are reported by N.L., P.E.I, N.S., N.B., Man., Alta., Y.T. and N.W.T. Data provided by Saskatchewan is not included in these rates as only hospitalizations that require intensive medical care are reported by Sask. The annual seasonal hospitalization rate for a given season is calculated using the population by age group in participating province and territories. Bolded values indicate the age group with the highest rate during the season. |
|||||
Figure 8: Number of influenza-associated hospitalizations reported by CIRN-SOS (left) and IMPACT (right) networks by week of admission, Canada, season 2019-2020
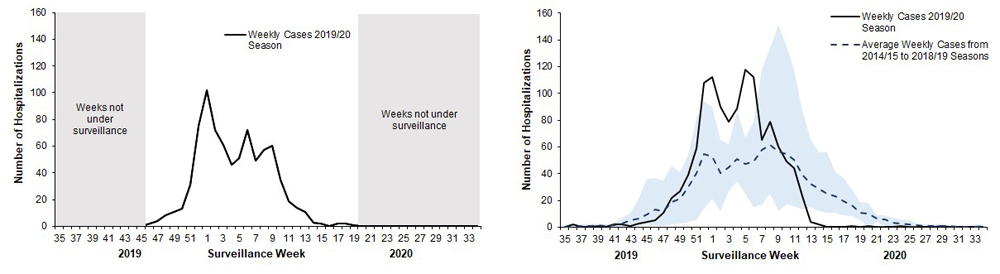
Text description
| Surveillance Week | Total Influenza |
|---|---|
| 35 | N/A |
| 36 | N/A |
| 37 | N/A |
| 38 | N/A |
| 39 | N/A |
| 40 | N/A |
| 41 | N/A |
| 42 | 0 |
| 43 | 0 |
| 44 | 0 |
| 45 | 0 |
| 46 | 2 |
| 47 | 4 |
| 48 | 8 |
| 49 | 11 |
| 50 | 13 |
| 51 | 31 |
| 52 | 75 |
| 1 | 102 |
| 2 | 72 |
| 3 | 61 |
| 4 | 46 |
| 5 | 51 |
| 6 | 72 |
| 7 | 49 |
| 8 | 57 |
| 9 | 60 |
| 10 | 35 |
| 11 | 19 |
| 12 | 14 |
| 13 | 11 |
| 14 | 3 |
| 15 | 2 |
| 16 | 0 |
| 17 | 2 |
| 18 | 2 |
| 19 | 1 |
| 20 | 0 |
| 21 | 0 |
| 22 | 0 |
| 23 | 0 |
| 24 | 0 |
| 25 | N/A |
| 26 | N/A |
| 27 | N/A |
| 28 | N/A |
| 29 | N/A |
| 30 | N/A |
| 31 | N/A |
| 32 | N/A |
| 33 | N/A |
| 34 | N/A |
| Surveillance Week | 2019-2020 | Average | Min | Max |
|---|---|---|---|---|
| 35 | 0 | 0.4 | 0 | 1 |
| 36 | 2 | 0.2 | 0 | 1 |
| 37 | 0 | 0.6 | 0 | 2 |
| 38 | 0 | 0.8 | 0 | 2 |
| 39 | 1 | 1.2 | 0 | 3 |
| 40 | 0 | 0.6 | 0 | 2 |
| 41 | 2 | 1.4 | 0 | 3 |
| 42 | 2 | 2.8 | 0 | 7 |
| 43 | 1 | 5 | 2 | 11 |
| 44 | 3 | 6.4 | 1 | 21 |
| 45 | 4 | 9.8 | 2 | 36 |
| 46 | 5 | 13 | 1 | 37 |
| 47 | 11 | 12 | 1 | 35 |
| 48 | 22 | 18.6 | 2 | 46 |
| 49 | 27 | 21 | 3 | 41 |
| 50 | 39 | 30 | 4 | 54 |
| 51 | 59 | 40.6 | 5 | 82 |
| 52 | 108 | 55 | 14 | 94 |
| 1 | 112 | 53 | 21 | 90 |
| 2 | 90 | 40.2 | 12 | 65 |
| 3 | 79 | 44.6 | 27 | 62 |
| 4 | 89 | 51.2 | 34 | 87 |
| 5 | 118 | 47 | 25 | 67 |
| 6 | 112 | 49.4 | 15 | 79 |
| 7 | 65 | 57.8 | 17 | 118 |
| 8 | 79 | 61.6 | 25 | 134 |
| 9 | 60 | 56.6 | 12 | 151 |
| 10 | 49 | 55 | 17 | 135 |
| 11 | 44 | 50.6 | 16 | 118 |
| 12 | 23 | 39.2 | 13 | 87 |
| 13 | 4 | 32.2 | 15 | 66 |
| 14 | 2 | 28.6 | 12 | 56 |
| 15 | 0 | 25 | 11 | 56 |
| 16 | 0 | 23 | 11 | 41 |
| 17 | 0 | 19.2 | 9 | 37 |
| 18 | 1 | 16.2 | 8 | 28 |
| 19 | 0 | 11 | 5 | 19 |
| 20 | 1 | 10 | 0 | 18 |
| 21 | 0 | 6.4 | 4 | 9 |
| 22 | 0 | 6 | 1 | 9 |
| 23 | 0 | 3.2 | 1 | 7 |
| 24 | 1 | 2.8 | 1 | 6 |
| 25 | 0 | 1.8 | 0 | 5 |
| 26 | 0 | 1.4 | 0 | 3 |
| 27 | 0 | 1 | 0 | 2 |
| 28 | 0 | 1 | 0 | 2 |
| 29 | 1 | 0.6 | 0 | 3 |
| 30 | 0 | 0.6 | 0 | 1 |
| 31 | 0 | 0 | 0 | 0 |
| 32 | 0 | 0 | 0 | 0 |
| 33 | 0 | 0.4 | 0 | 2 |
| 34 | 0 | 0.6 | 0 | 2 |
Figure 9: Number and percentage of hospitalizations reported by CIRN-SOS (left) and IMPACT (right) network by age group and type, Canada, season 2019-2020
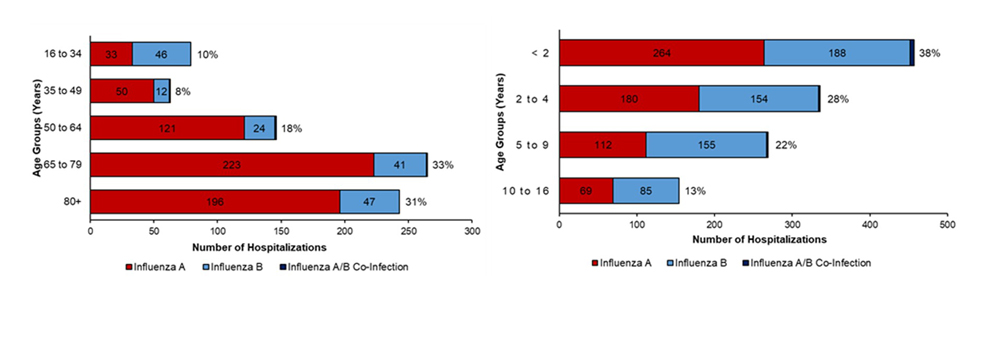
Proportions may not add correctly due to rounding.
Text description
| Age Group (Years) | Influenza A | Influenza B | Influenza A/B Co-Infection | All Influenza | % by Age Group |
|---|---|---|---|---|---|
| 16 to 34 | 33 | 46 | 0 | 79 | 10% |
| 35 to 49 | 50 | 12 | 1 | 53 | 8% |
| 50 to 64 | 121 | 24 | 1 | 146 | 18% |
| 65 to 79 | 223 | 41 | 1 | 265 | 33% |
| 80 + | 196 | 47 | 0 | 243 | 31% |
| Age Group (Years) | Influenza A | Influenza B | Influenza A/B Co-Infection | All Influenza | % by Age Group |
|---|---|---|---|---|---|
| < 2 | 264 | 188 | 5 | 457 | 38% |
| 2 to 4 | 180 | 154 | 2 | 336 | 28% |
| 5 to 9 | 112 | 155 | 2 | 269 | 22% |
| 10 to 16 | 69 | 85 | 0 | 154 | 13% |
ICU admissions and deaths
A total of 306 ICU admissions and 120 deaths were reported this season by participating province and territories.
- Approximately, 71% (216) of reported ICU admissions and 73% (116) of reported deaths were associated with influenza A.
- Overall, the highest percentage of ICU admissions was reported among adults 45 to 64 (32%) and ≥ 65 years of age (32%). The highest proportion of deaths was reported among adults ≥ 65 years of age (70%).
The CIRN-SOS and IMPACT data offer additional surveillance indicators on the severity of influenza in hospitalized patients.
CIRN-SOS
- A total of 94 ICU admissions and 48 deaths were reported this season by CIRN-SOS sites.
- Overall, 12% of hospitalized patients were admitted to the ICU.
- 12% of influenza A associated hospitalizations resulted in admission to the ICU while 12% of influenza B associated hospitalizations resulted in admission to the ICU.
- Among the hospitalized patients, patients 35 to 49 years of age had the highest proportion of ICU admissions (19%), while patients 80 years of age and older had the lowest proportion (7%).
- Overall, 6% of hospitalized patients died.
- 5% of adult influenza A associated hospitalizations resulted in death while 7% of influenza B hospitalizations resulted in death.
- The proportion of deaths among hospitalized patients ranged from 0% (patients <35 years of age) to 10% (patients 80 years of age and older). This latter age group accounted for 50% of deaths.
- 90% of hospitalizations and 92% of the deaths had at least one comorbid condition reported. Vascular disorders, including hypertension, were the most common comorbidities (64% of all cases, 69% of all deaths), followed by cardiac disorders (39% of all cases, 48% of all deaths).
IMPACT
- A total of 225 ICU admissions and 7 deaths were reported this season by IMPACT sites.
- Overall, 18% of hospitalized patients were admitted to ICU (225)
- 20% of influenza A and 17% of influenza B associated pediatric hospitalizations resulted in an ICU admission.
- The highest proportion of ICU admissions was reported among hospitalized patients 10 to 16 years of age (26%).
- The number of pediatric influenza associated deaths (7) is insufficient to present the proportion of hospitalized cases who died by age group or by influenza type.
- 48% of hospitalizations and 58% of ICU admissions had at least one comorbid health condition reported. Among all patients with health conditions, a median of two conditions were reported.
Influenza strain characterizations
From September 1, 2019 to August 31, 2020, the National Microbiology Laboratory (NML) characterized 2,021 influenza viruses received from Canadian laboratories: 760 A(H1N1), 368 A(H3N2), 893 influenza B.
Antigenic characterization is established by hemagglutination inhibition (HI) assay using egg-passaged vaccine reference viruses for A(H1N1) and A(H3N2), and cell-passaged vaccine reference virus for influenza B. Over recent years, circulating strains of A(H3N2) have evolved, and are increasingly difficult to characterize by HI assay. Genetic characterization is established by sequencing the hemagglutinin gene of the influenza viruses to compare their genetic properties.
Influenza A(H3N2)
The influenza A(H3N2) component of the 2019-2020 Northern Hemisphere influenza vaccine was an A/Kansas/14/2017 -like virus which belongs to the genetic group 3C.3a.
Antigenic characterization
Among the 109 influenza A(H3N2) viruses antigenically characterized during the 2019-2020 season, the majority (n=86, 79%) showed reduced titer by HI assay to A Kansas/14/2017 using antiserum raised against egg-propagated A Kansas/14/2017. Twenty-three viruses were characterized as A Kansas/14/2017-like (Figure 12a).
Genetic characterization
Nearly all (n=353, 96%) of the 368 A(H3N2) viruses genetically characterized during the 2019-2020 season belonged to genetic group 3C.2a1b based on sequence analysis of the HA gene. Fifteen viruses belonged to the genetic group 3C.3a (Figure 13).
Group 3C.2a1b viruses analysed represent:
- 86% (94 out of 109) viruses that were also antigenically characterized.
- 100% (259 out of 259) viruses which did not grow to sufficient hemagglutination titer for antigenic characterization by HI assay.
| Genetic clade | Genetic characterization only | Antigenic characterization: | Total A(H3N2) | |
|---|---|---|---|---|
| Similar to A Kansas/14/2017-like |
Reduced titer to A Kansas/14/2017-like |
|||
| Subclade 3C.2a1 | 259 | 9 | 85 | 353 |
| Clade 3C.3a | 0 | 14 | 1 | 15 |
| Total | 259 | 23 | 86 | 368 |
Influenza A(H1N1)
The influenza A(H1N1) component of the 2019-2020 Northern Hemisphere influenza vaccine was an A/Brisbane/02/2018-like virus.
Among the 760 A(H1N1) viruses characterized during the 2019-2020 season, 50% (n=382) were antigenically similar to A/Brisbane/02/2018 by HI testing using antiserum raised against egg-propagated A/Brisbane/02/2018 (Figure 12b).
Influenza B
Antigenic characterization
Among the 184 influenza B viruses antigenically characterized during the 2019-2020 season, the vast majority (181) belonged to the B/Victoria lineage. Three viruses were antigenically characterized as similar to B/Phuket/3073/2013 (B/Yamagata lineage).
The majority (90%, 162) of B/Victoria lineage viruses showed reduced titer by HI assay to B/Colorado/06/2017 using antiserum raised against cell culture-propagated B/Colorado/06/2017 (Figure 12c).
Sequence analysis of B/Victoria lineage viruses with reduced titre to B/Colorado/06/2017 showed that 100% (n=162) had a three amino acid deletion (162-164) in the HA gene and belong to the genetic subclade V1A.3.
Genetic characterization
During the 2019-2020 season, 100% (709) of influenza B/Victoria viruses genetically characterized had a three amino acid deletion (162 to 164) in the HA gene and belong to the genetic subclade V1A.3. (Figure 13b). Viruses in this genetic subclade are antigenically distinct from the vaccine strain B/Colorado/06/2017, which belongs to genetic subclade V1A.1 that has a two amino acid deletion (162 to 163) in the HA gene. No circulating viruses were identified during the 2019-2020 season which belonged to the same subclade as the vaccine virus (V1A.1).
Figure 10: Distribution of antigenic phenotypes among characterized influenza viruses, Canada, season 2019-2020
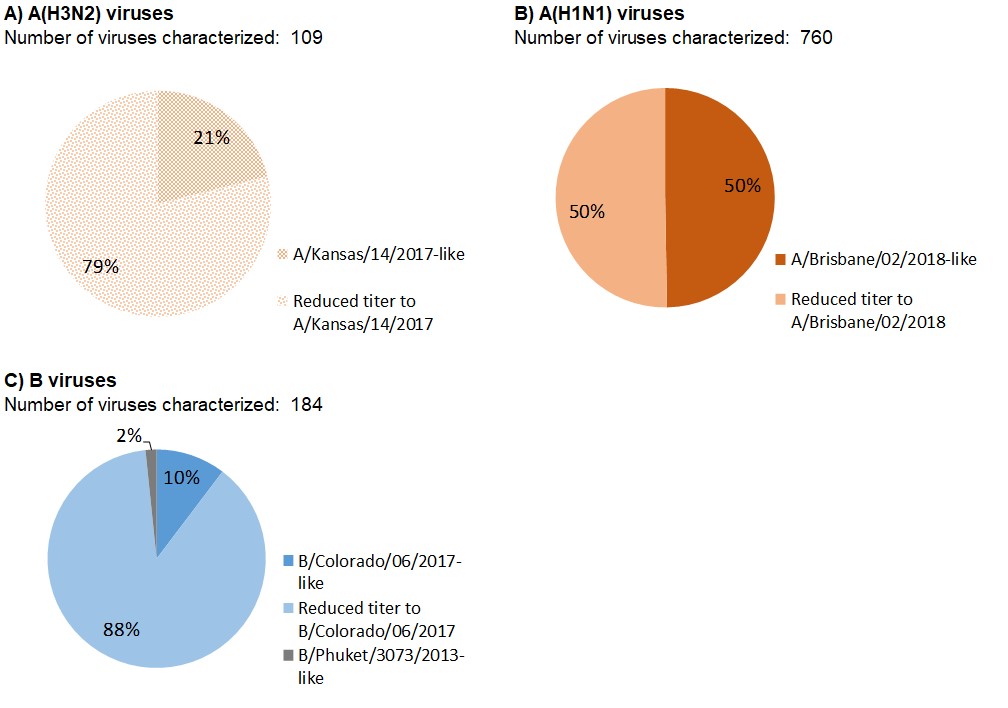
Text description
| Number of viruses characterized: 109 | ||
| Antigenic phenotype of A(H3N2) virus | Number of viruses | Percentage |
|---|---|---|
| A/Kansas/14/2017-like | 23 | 21% |
| Reduced titer to A/Kansas/14/2017 | 86 | 79% |
| Number of viruses characterized: 760 | ||
| Antigenic phenotype of A(H1N1) virus | Number of viruses | Percentage |
|---|---|---|
| A/Brisbane/02/2018-like | 378 | 50% |
| Reduced titer to A/Brisbane/02/2018 | 382 | 50% |
| Number of viruses characterized: 184 | ||
| Antigenic phenotype of influenza B virus | Number of viruses | Percentage |
|---|---|---|
| B/Colorado/06/2017-like | 19 | 10% |
| Reduced titer to B/Colorado/06/2017 | 162 | 88% |
| B/Phuket/3073/2013-like | 3 | 2% |
Figure 11: Distribution of genetic clades among characterized influenza viruses, Canada, season 2019-2020
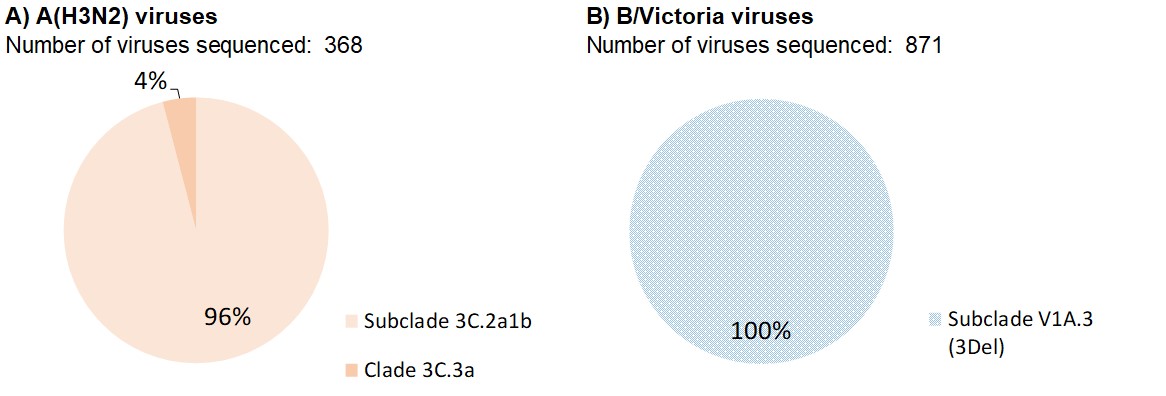
Text description
| Number of viruses sequenced: 368 | ||
| Genetic Clade of A(H3N2) virus | Number of viruses | Percentage |
|---|---|---|
| Subclade 3C.2a1b | 353 | 96% |
| Clade 3C.3a | 15 | 4% |
| Number of viruses sequenced: 871 | ||
| Genetic Clade of influenza B/Victoria virus | Number of viruses | Percentage |
|---|---|---|
| Subclade V1A.3 (3Del) | 871 | 100% |
| Subclade V1A.1 (2Del) | 0 | 0% |
Antiviral resistance
The National Microbiology Laboratory (NML) also tests influenza viruses received from Canadian laboratories for antiviral resistance. From September 1, 2019 to August 31, 2020:
- Among the 733 influenza viruses tested for resistance to oseltamivir, all 164 influenza A(H3N2) and all 286 B viruses were sensitive to oseltamivir. Among the 283 A(H1N1) viruses tested, 282 (99.6%) were sensitive to oseltamivir and one virus was resistant to oseltamivir with the H275Y mutation in the neuraminidase gene.
- All 733 influenza viruses (164 A(H3N2), 283 A(H1N1) and 286 B) tested were sensitive to zanamivir. Since the 2009 pandemic, nearly all circulating strains of influenza have been sensitive to oseltamivir and zanamivir.
- High levels of resistance to amantadine continued to persist among influenza A(H1N1) and influenza A(H3N2) viruses. All viruses characterized at the NML in the 2019-2020 season were resistant to amantadine. Widespread resistance to amantadine among influenza A viruses has been observed for more than 10 years.
Vaccine monitoring
Vaccine monitoring refers to activities related to the monitoring of influenza vaccine coverage and effectiveness. The quadrivalent vaccines used in the 2019-2020 northern hemisphere influenza season contained:
- an A/Brisbane/02/2018 (H1N1)pdm09-like virus;
- an A/Kansas/14/2017 (H3N2)-like virus;
- a B/Colorado/06/2017-like virus (B/Victoria/2/87 lineage); and
- a B/Phuket/3073/2013-like virus (B/Yamagata/16/88 lineage).
The B/Colorado/06/2017-like virus was included in both the trivalent and quadrivalent vaccines.
Vaccine monitoring refers to activities related to the monitoring of influenza vaccine coverage and effectiveness.
Vaccine coverage
The Seasonal Influenza Immunization Coverage Survey is an annual telephone survey conducted between January and February that collects information from Canadians on whether they received the annual seasonal influenza vaccine that season. Vaccine coverage is measured as the percentage of people who received the influenza vaccine in a specific influenza season.
In the 2019-2020 influenza season, coverage was similar to the 2018-19 season, at:
- 34% among adults aged 18 to 64 years.
- 30% among adults aged 18 to 64 without chronic diseases.
- 44% among adults aged 18 to 64 years with chronic diseases.
- 70% among seniors (aged 65 years and older).
| Age group (years) | All | Male | Female | ||||
|---|---|---|---|---|---|---|---|
| N | Vaccine coverage % (95% CI) | N | Vaccine coverage % (95% CI) | N | Vaccine coverage % (95% CI) | ||
| All adults (≥18) | 3023 | 41.8 (39.7-43.9) | 1320 | 37.2 (34.1-40.2) | 1691 | 46.1 (43.2-49.0) | |
| 18 to 64 | Total | 2234 | 34.1 (31.8-36.5) | 1005 | 29.8 (26.5-33.1) | 1218 | 38.4 (35.1-41.7) |
| 18 to 64 with chronic diseases | 668 | 43.6 (39.0-48.1) | 268 | 38.3 (31.5-45.2) | 397 | 47.9 (41.7-54.0) | |
| 18 to 64 without chronic diseases | 1558 | 30.0 (27.3-32.7) | 732 | 26.7 (22.9-30.5) | 818 | 33.5 (29.6-37.3) | |
| ≥65 | 789 | 70.3 (66.7-73.8) | 315 | 67.2 (61.5-72.9) | 473 | 72.7 (68.3-77.1) | |
| Totals by subgroups do not add up to 3026 because missing gender or chronic medical condition status information. | |||||||
Vaccine effectiveness
The Canadian Sentinel Practitioner Surveillance Network (SPSN) provides estimates of the effectiveness of the seasonal influenza vaccine in preventing medically-attended illness due to laboratory-confirmed influenza among Canadians.
Based on data collected between November 1, 2019 and March 28, 2020, vaccine effectiveness was estimated to be 53% for any influenza, 43% for influenza A(H1N1), 50% for influenza A(H3N2), and 65% for influenza B. The SPSN mid-season estimates were published and are available in Eurosurveillance; the updated end-of-season estimates are available online on British Columbia's Centre for Disease Control website.
The Serious Outcomes Surveillance (SOS) Network of the Canadian Immunization Research Network (CIRN-SOS) provides estimates of the effectiveness of the seasonal influenza vaccine in preventing hospitalization for laboratory-confirmed influenza in adults.
Based on data collected between November 3, 2019 and February 15, 2020, among adult (16 years of age and older) hospitalized cases of influenza, vaccine effectiveness was estimated to be 29.6% for any influenza, 42.4% for influenza A(H1N1) and 19.6% for influenza B. Vaccine effectiveness estimates for H3N2 were not presented in the CIRN-SOS network interim vaccine effectiveness report.
More information on the CIRN-SOS Network including study methodology and available publications can be viewed on their webpage.
| SPSN (primary care visits)Table 4 Footnote a | CIRN-SOS (adult hospitalizations) | ||||
|---|---|---|---|---|---|
| VE(%) (CI)Table 4 Footnote b | N | VE(%) (CI)Table 4 Footnote c | N | ||
| All influenza | 53 (45-60) | 4633 | 29.6 (-0.1-50.4) | 593 | |
| Influenza A | Total | 44 (32-54) | 3587 | 33.4 (3.9-53.9) | 536 |
| Influenza A H1N1 | 43 (30-54) | 3333 | 42.4 (-3.5-67.9) | 348 | |
| Influenza A H3N2 | 50 (26-66) | 2634 | n/a | n/a | |
| Influenza B | 65 (56-73) | 3453 | 19.6 (-66.2-61.1) | 331 | |
| |||||
Notes
To learn more about the FluWatch program, see the Overview of influenza monitoring in Canada page. For more information on the flu, see our Flu (influenza) web page.
Thank you to our Fluwatch surveillance partners who participate in the influenza surveillance program!
- Footnote 1
-
Children's Hospital of Eastern Ontario (CHEO), Ottawa; Mount Sinai Hospital, Toronto; Sick Kids Hospital, Toronto; St. Joseph's Health Care, London; St. Joseph's Health Care; Hamilton; Sunnybrook Health Sciences Centre, Toronto.
- Footnote 2
-
Influenza-associated hospitalizations are reported by N.L., P.E.I, N.S., N.B., Man., Alta., Y.T. and N.W.T. Sask. only reports hospitalizations that require intensive medical care are reported by Sask.
- Footnote 3
-
B.C:Surrey Memorial Hospital; Ont: Mount Sinai Hospital, Hamilton Health Sceinces, Ottawa General, North York General, Health Sciences North; Que:CHUQ/CHUL, CHUS; NS: Dartmouth General, Queen Elizabeth II Health Sciences Centre
- Footnote 4
-
B.C: B.C. Children's Hospital; Alta: Alberta Children's Hospital, Stollery Children's Hospital; Sask: Royal University Hospital; Ont: CHEO, Sick Kids; Que: Le Centre Mère-Enfant de Québec City, CHU-Sainte-Justine, The Montreal Children's Hospital; NS: IWK Health Centre, Halifax; NL: Eastern Health Janeway Child Health and Rehabilitation Centre