
FluWatch annual report: 2018-19 influenza season
Overall Summary
- During the influenza season, the FluWatch report is based on weekly data. This report is a summary of all of the data received for the 2018-19 influenza season and a comparison of these data to the previous five seasons.
- The 2018-19 influenza season in Canada was longer than the previous five seasons and was characterized by two waves of influenza A activity and very little influenza B circulation. The national season started in week 43 (October 21-27, 2018), peaked in week 52 (December 23-29, 2018) and ended in week 21 (May 19-25, 2019).
- A(H1N1) was predominant in the earlier part of the season (October to February) followed by a smaller wave of A(H3N2) circulation (March to April). Overall, A(H1N1) was the predominant strain nationally this season.
- Two waves of activity were observed in the number of reported outbreaks. The predominant subtype for typed outbreaks was A(H1N1) in the early part of the season (October to January), and A(H3N2) in the latter part of the season (Feburary onward).
- The annual seasonal hospitalization rate was above average compared to the previous five seasons. Adults 65 years of age and older had the highest overall hospitalization rate; however, the highest cumulative hospitalization rate shifted during the season from children 0-4 years of age (November to March) to adults 65 years of age and older (March onward), likely due to the second wave of A(H3N2).
- Overall, influenza vaccine coverage in the 2018-19 season (42%) was significantly higher than in the previous two seasons. Coverage was estimated at 34% for adults aged 18 to 64 years and 70% among seniors.
- Vaccine effectiveness studies in both the outpatient setting and adult inpatient setting observed good protection against A(H1N1) and little to no protection against A(H3N2) viruses relative to what is expected for influenza vaccine effectiveness.
Download the alternative format
(PDF format, 1.25 MB, 16 pages)
Organization: Public Health Agency of Canada
Published: 2020-01-07
On this page
- Influenza/Influenza-like Illness (ILI) Activity (geographic spread)
- Laboratory-Confirmed Influenza Detections
- Syndromic / Influenza-like Illness Surveillance
- Influenza Outbreak Surveillance
- Severe Outcomes Influenza Surveillance
- Influenza Strain Characterizations
- Antiviral Resistance
- Vaccine Monitoring
Influenza/Influenza-like Illness (ILI) Activity (geographic spread)
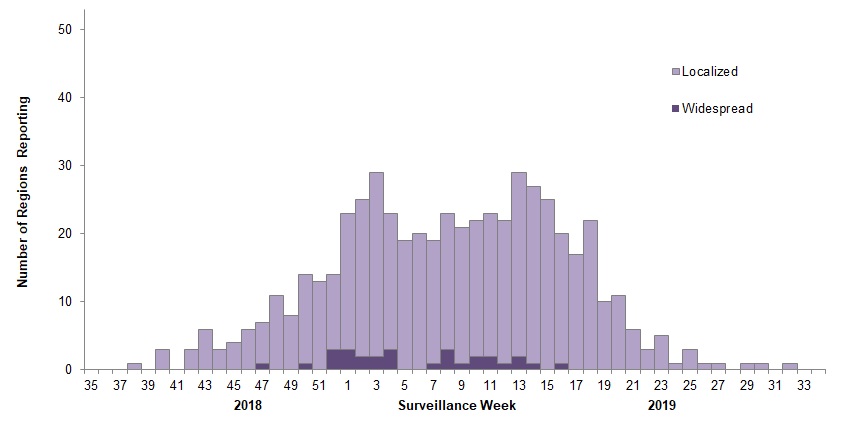
Data on the geographic spread of influenza and influenza-like illness (ILI) are provided by all provinces and territories. All provinces and territories reported activity level data for each week of the 2018-19 influenza season.
- The number of surveillance regions reporting localized and widespread influenza activity peaked in week three and again in week 13 (Figure 1).
- Maps of the level of influenza activity reported by surveillance regions each week over the course of the season can be viewed here.
Figure 1 – Number of regions reporting widespread and localized influenza activity, Canada, weeks 2018-35 to 2019-34
Text description
| Surveillance Week | Localized | Widespread |
|---|---|---|
| 35 | 0 | 0 |
| 36 | 0 | 0 |
| 37 | 0 | 0 |
| 38 | 1 | 0 |
| 39 | 0 | 0 |
| 40 | 3 | 0 |
| 41 | 0 | 0 |
| 42 | 3 | 0 |
| 43 | 6 | 0 |
| 44 | 3 | 0 |
| 45 | 4 | 0 |
| 46 | 6 | 0 |
| 47 | 6 | 1 |
| 48 | 11 | 0 |
| 49 | 8 | 0 |
| 50 | 13 | 1 |
| 51 | 13 | 0 |
| 52 | 11 | 3 |
| 1 | 20 | 3 |
| 2 | 23 | 2 |
| 3 | 27 | 2 |
| 4 | 20 | 3 |
| 5 | 19 | 0 |
| 6 | 20 | 0 |
| 7 | 18 | 1 |
| 8 | 20 | 3 |
| 9 | 20 | 1 |
| 10 | 20 | 2 |
| 11 | 21 | 2 |
| 12 | 21 | 1 |
| 13 | 27 | 2 |
| 14 | 26 | 1 |
| 15 | 25 | 0 |
| 16 | 19 | 1 |
| 17 | 17 | 0 |
| 18 | 22 | 0 |
| 19 | 10 | 0 |
| 20 | 11 | 0 |
| 21 | 6 | 0 |
| 22 | 3 | 0 |
| 23 | 5 | 0 |
| 24 | 1 | 0 |
| 25 | 3 | 0 |
| 26 | 1 | 0 |
| 27 | 1 | 0 |
| 28 | 0 | 0 |
| 29 | 1 | 0 |
| 30 | 1 | 0 |
| 31 | 0 | 0 |
| 32 | 1 | 0 |
| 33 | 0 | 0 |
| 34 | 0 | 0 |
Laboratory-Confirmed Influenza Detections
Data on laboratory-confirmed influenza detections are provided by 32 provincial, regional and some hospital laboratories. On average 99.6% of labs reported each week. During the 2018-19 season a total of 48,818 influenza detections were reported. Based on the seasonal thresholds for start and end of season (i.e. when the percentage of tests positive for influenza crossed 5%), the national influenza season started in week 43, peaked in week 52 and ended in week 21 (Figure 2).
- Nearly all (95%) of influenza detections this season were influenza A. A(H1N1) was the predominant influenza strain and was the driver of the peak in percent positive detections in week 52. Among the 16,602 influenza A viruses that were subtyped this season, 69% were A(H1N1).
- The proportion of subtyped influenza A detections that were A(H3N2) began to increased markedly in mid-January (week three) and A(H3N2) became the predominant strain by week eight. This second more moderate wave of influenza A detections peaked in week nine and persisted near peak levels through to week 15.
- In the early part of the season (the A(H1N1) wave), influenza A activity was within the expected range; however, due to circulation of A(H3N2) in the latter part of the season, the overall proportion of detections of influenza A was higher compared to previous seasons.
- Compared to the last five seasons, the 2018-19 season started five weeks earlier than average; the number of weeks from the start of the season to the peak (10 weeks) was slightly longer than the average (nine weeks); and the length of the season (31 weeks) was six weeks longer than average (25 weeks).
- Canada observed the lowest cumulative total influenza B detections (5%) since the 2009 pandemic. Influenza B activity began to increase in week nine and peaked in week 17 but remained below previous seasonal values for the entire season.
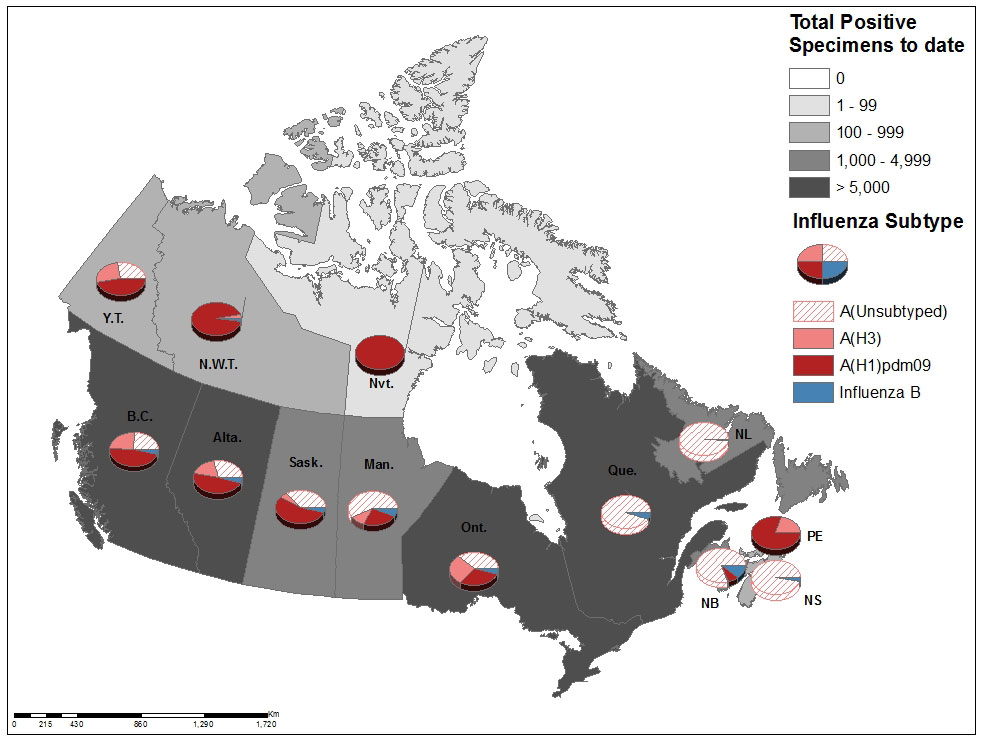
- The distribution of influenza detections by type and subtype in provinces and territories was similar to the national distribution. The proportion of detections of influenza B was between zero and 5%. Among jurisdictions from which influenza A subtype information was provided, the proportion of A(H1N1) ranged from 62 to 100% of subtyped influenza A detections (Figure 3).
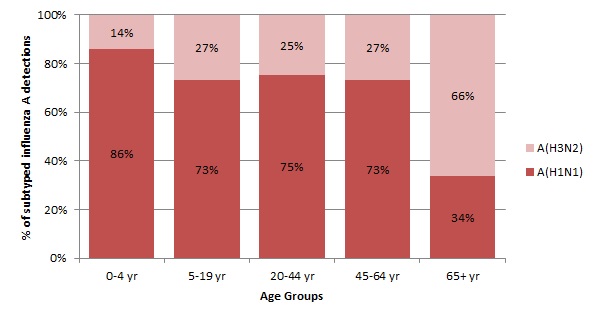
Detailed information on age and influenza type/subtype was received for 39,192 of laboratory-confirmed influenza cases. Among influenza A detections where subtype was identified (13,718), subtype distribution varied by age-group (Figure 4). A(H1N1) was the predominant subtype in all age groups except those 65 years of age and older, among whom A(H3N2) was the predominant subtype (66%). Children less than five years of age had the highest proportion of A(H1N1) among subtyped influenza A detections (86%).
For more detailed weekly and cumulative influenza data, see the text descriptions for Figures 2 and 3 or the Respiratory Virus Detections in Canada Report.
Figure 2 – Number of positive influenza tests and percentage of positive tests, by type, subtype and report week, Canada, weeks 2018-35 to 2019-34
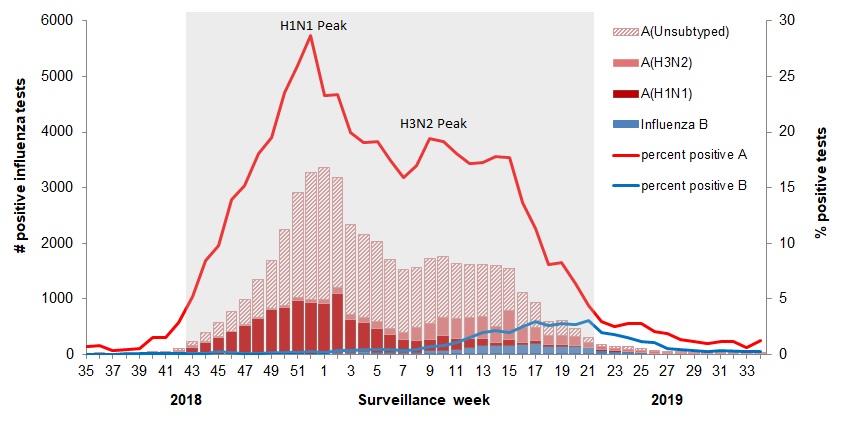
The shaded area indicates weeks where the positivity rate was at least 5% and a minimum of 15 positive tests were observed, signalling the period of seasonal influenza activity.
Data for week 14 excludes subtyping results from one jurisdiction due to batch reporting of subtype information. The results for week 14 should be interpreted with caution.
Text description
| Surveillance Week | A(Unsubtyped) | A(H3N2) | A(H1N1) | Influenza B |
|---|---|---|---|---|
| 35 | 3 | 2 | 7 | 0 |
| 36 | 4 | 7 | 4 | 0 |
| 37 | 3 | 2 | 3 | 1 |
| 38 | 6 | 3 | 2 | 3 |
| 39 | 11 | 5 | 1 | 3 |
| 40 | 16 | 7 | 29 | 3 |
| 41 | 27 | 6 | 21 | 3 |
| 42 | 40 | 19 | 55 | 2 |
| 43 | 83 | 23 | 128 | 4 |
| 44 | 169 | 13 | 214 | 6 |
| 45 | 244 | 18 | 295 | 15 |
| 46 | 346 | 10 | 404 | 9 |
| 47 | 449 | 17 | 507 | 8 |
| 48 | 679 | 29 | 632 | 10 |
| 49 | 851 | 35 | 785 | 16 |
| 50 | 1368 | 35 | 828 | 14 |
| 51 | 1890 | 54 | 953 | 21 |
| 52 | 2292 | 55 | 903 | 26 |
| 1 | 2387 | 58 | 893 | 31 |
| 2 | 1985 | 93 | 1061 | 43 |
| 3 | 1613 | 101 | 585 | 40 |
| 4 | 1483 | 93 | 532 | 48 |
| 5 | 1449 | 112 | 433 | 43 |
| 6 | 1234 | 118 | 315 | 42 |
| 7 | 1116 | 128 | 244 | 33 |
| 8 | 1066 | 236 | 216 | 40 |
| 9 | 1172 | 285 | 213 | 64 |
| 10 | 1085 | 335 | 268 | 71 |
| 11 | 990 | 357 | 197 | 90 |
| 12 | 959 | 380 | 155 | 131 |
| 13 | 939 | 387 | 128 | 167 |
| 14 | 1091 | 292 | 41 | 169 |
| 15 | 756 | 514 | 121 | 157 |
| 16 | 614 | 277 | 42 | 175 |
| 17 | 448 | 244 | 55 | 194 |
| 18 | 265 | 160 | 29 | 148 |
| 19 | 266 | 154 | 33 | 151 |
| 20 | 137 | 163 | 27 | 136 |
| 21 | 89 | 79 | 8 | 122 |
| 22 | 43 | 53 | 17 | 75 |
| 23 | 33 | 42 | 8 | 60 |
| 24 | 39 | 44 | 5 | 48 |
| 25 | 29 | 41 | 4 | 31 |
| 26 | 23 | 30 | 0 | 27 |
| 27 | 15 | 23 | 3 | 12 |
| 28 | 10 | 18 | 2 | 11 |
| 29 | 8 | 17 | 1 | 9 |
| 30 | 5 | 13 | 1 | 6 |
| 31 | 3 | 15 | 6 | 7 |
| 32 | 8 | 13 | 2 | 0 |
| 33 | 9 | 4 | 0 | 5 |
| 34 | 8 | 12 | 7 | 6 |
Figure 3 – Cumulative numbers of positive influenza specimens by type/subtype and province/territory, Canada, weeks 2018-35 to 2019-34
Text description
| Provinces and TerritoriesFigure 3 Footnote 1 | Cumulative (August 26, 2018 to August 24, 2019) | |||||
|---|---|---|---|---|---|---|
| Influenza A | B | A & B | ||||
| A Total | A(H1N1)pdm09 | A(H3N2) | A(UnS)Figure 3 Footnote 3 | B Total | Total | |
| B.C. | 6480 | 3165 | 1689 | 1626 | 244 | 6724 |
| Alta. | 7266 | 3649 | 1392 | 2225 | 370 | 7636 |
| Sask. | 2458 | 1389 | 142 | 927 | 109 | 2567 |
| Man. | 1194 | 335 | 131 | 728 | 77 | 1271 |
| Ont. | 6422 | 2112 | 1733 | 2577 | 311 | 6733 |
| Que. | 17167 | 0 | 0 | 17167 | 988 | 18155 |
| N.B. | 2884 | 246 | 39 | 2599 | 366 | 3250 |
| N.S. | 786 | 0 | 0 | 786 | 22 | 808 |
| P.E.I | 279 | 221 | 56 | 2 | 2 | 281 |
| N.L. | 1036 | 1 | 0 | 1035 | 13 | 1049 |
| Y.T. | 140 | 66 | 35 | 39 | 0 | 140 |
| N.W.T | 181 | 175 | 6 | 0 | 3 | 184 |
| Nvt. | 20 | 20 | 0 | 0 | 0 | 20 |
| Canada | 46313 | 11379 | 5223 | 29711 | 2505 | 48818 |
| PercentageFigure 3 Footnote 2 | 95% | 25% | 11% | 64% | 5% | 100% |
|
||||||
Figure 4 – Proportion of positive influenza A specimens by subtype and age-group reported through case-based laboratory reporting, Canada, weeks 2018-35 to 2019-34
Text description
| Age group | A(H1N1) | A(H3N2) |
|---|---|---|
| 0-4 yr | 86% | 14% |
| 5-19 yr | 73% | 27% |
| 20-44 yr | 75% | 25% |
| 45-64 yr | 73% | 27% |
| 65+ yr | 34% | 66% |
Syndromic / Influenza-like Illness Surveillance
Healthcare Practitioners Sentinel Syndromic Surveillance
On average, during the 2018-19 season, 106 healthcare practitioners across the country participated in influenza-like illness (ILI) surveillance for the FluWatch program. Each week these sentinel healthcare practioners report the proportion of patients in their practice who had ILI.
- Overall, ILI activity was below the five-year average for the majority of weeks this influenza season (range: 0.1% to 3.2%).
- 1.1% of all patient visits reported by sentinels were due to ILI this season (i.e. week 43 to week 21).
- The percentage of visitis for ILI reported by sentinels peaked in week 52 at 3.2%, consistent with the peak week of laboratory detections (Figure 5).
- For the majority of the season, the highest percentage of visits for ILI was reported among those less than 20 years of age. The lowest percentage of visits for ILI was reported among the 65+ year age group.
Figure 5 – Percentage of visits for ILI reported by sentinels by report week, Canada, weeks 2018-35 to 2019-34
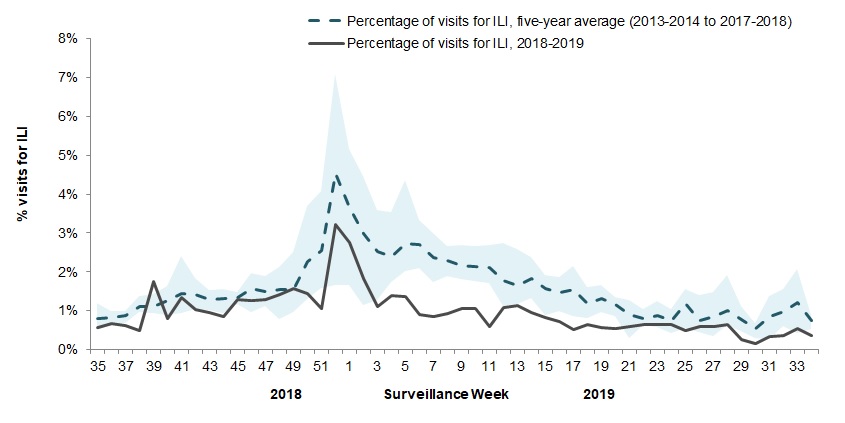
The shaded area represents the maximum and minimum percentage of visits for ILI reported by week from seasons 2013-2014 to 2017-2018
Text description
| Surveillance Week | 2018-19 | Average | Min | Max |
|---|---|---|---|---|
| 35 | 0,6% | 0,8% | 0,5% | 1,2% |
| 36 | 0,7% | 0,8% | 0,7% | 1,0% |
| 37 | 0,6% | 0,9% | 0,7% | 1,0% |
| 38 | 0,5% | 1,1% | 1,0% | 1,4% |
| 39 | 1,7% | 1,1% | 0,9% | 1,4% |
| 40 | 0,8% | 1,3% | 0,9% | 1,6% |
| 41 | 1,3% | 1,4% | 0,9% | 2,4% |
| 42 | 1,0% | 1,4% | 1,0% | 1,9% |
| 43 | 0,9% | 1,3% | 1,0% | 1,5% |
| 44 | 0,9% | 1,3% | 0,9% | 1,6% |
| 45 | 1,3% | 1,3% | 1,2% | 1,5% |
| 46 | 1,3% | 1,6% | 1,0% | 2,0% |
| 47 | 1,3% | 1,5% | 1,1% | 1,9% |
| 48 | 1,4% | 1,6% | 0,8% | 2,1% |
| 49 | 1,6% | 1,5% | 1,0% | 2,5% |
| 50 | 1,4% | 2,3% | 1,3% | 3,7% |
| 51 | 1,0% | 2,5% | 1,6% | 4,1% |
| 52 | 3,2% | 4,5% | 1,7% | 7,1% |
| 1 | 2,8% | 3,7% | 1,7% | 5,2% |
| 2 | 1,8% | 3,0% | 1,1% | 4,5% |
| 3 | 1,1% | 2,5% | 1,3% | 3,6% |
| 4 | 1,4% | 2,4% | 1,7% | 3,5% |
| 5 | 1,4% | 2,7% | 2,0% | 4,4% |
| 6 | 0,9% | 2,7% | 2,1% | 3,3% |
| 7 | 0,8% | 2,4% | 1,7% | 3,0% |
| 8 | 0,9% | 2,3% | 1,9% | 2,7% |
| 9 | 1,0% | 2,2% | 1,8% | 2,7% |
| 10 | 1,1% | 2,1% | 1,8% | 2,7% |
| 11 | 0,6% | 2,1% | 1,7% | 2,7% |
| 12 | 1,1% | 1,8% | 1,1% | 2,7% |
| 13 | 1,1% | 1,7% | 1,2% | 2,6% |
| 14 | 1,0% | 1,8% | 1,3% | 2,4% |
| 15 | 0,8% | 1,6% | 0,9% | 1,9% |
| 16 | 0,7% | 1,5% | 1,0% | 1,9% |
| 17 | 0,5% | 1,5% | 0,9% | 2,2% |
| 18 | 0,6% | 1,2% | 0,8% | 1,6% |
| 19 | 0,6% | 1,3% | 1,0% | 1,7% |
| 20 | 0,5% | 1,2% | 0,9% | 1,4% |
| 21 | 0,6% | 0,9% | 0,3% | 1,3% |
| 22 | 0,6% | 0,8% | 0,6% | 1,0% |
| 23 | 0,6% | 0,9% | 0,6% | 1,2% |
| 24 | 0,6% | 0,7% | 0,4% | 1,0% |
| 25 | 0,5% | 1,2% | 0,5% | 1,6% |
| 26 | 0,6% | 0,8% | 0,4% | 1,4% |
| 27 | 0,6% | 0,8% | 0,4% | 1,5% |
| 28 | 0,7% | 1,0% | 0,6% | 1,9% |
| 29 | 0,2% | 0,8% | 0,5% | 1,1% |
| 30 | 0,2% | 0,5% | 0,3% | 0,7% |
| 31 | 0,3% | 0,9% | 0,3% | 1,4% |
| 32 | 0,4% | 1,0% | 0,6% | 1,6% |
| 33 | 0,5% | 1,2% | 0,4% | 2,1% |
| 34 | 0,4% | 0,7% | 0,5% | 0,9% |
Participatory Syndromic Surveillance
FluWatchers are Canadians who report via a weekly online questionnaire if they have had symptoms of ILI in the preceding week. FluWatchers surveillance for the 2018-19 started in week 40 (October) and ended in week 18 (May). A total of 3,205 participants reported at least once this season, resulting in 64,728 completed questionnaires.
- The majority (75%) of FluWatchers particpants were adults 20-64 years of age. The age distribution of all FluWatchers participants this season was as follows:
- 4% - 0 to 4 years of age
- 15% - 5-19 years of age
- 43% - 20 to 44 years of age
- 33% - 45 to 64 years of age
- 5% - 65 years of age and older
- 31% of FluWatchers reported experiencing cough and fever at least once this season.
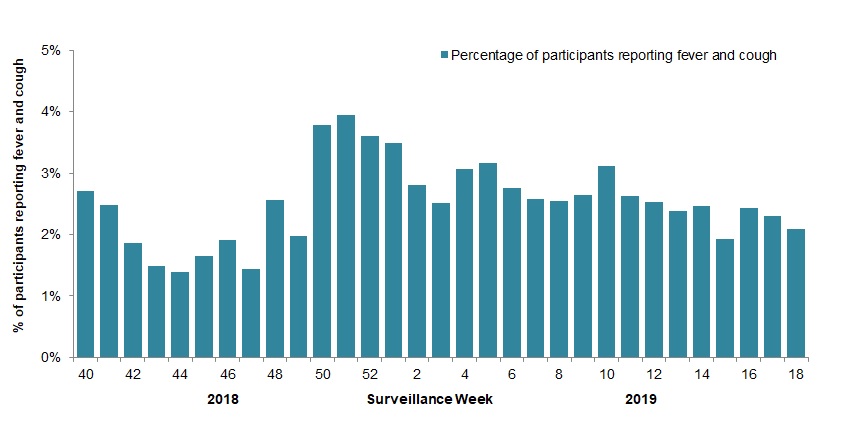
- The percentage of FluWatchers reporting fever and cough peaked in week 51 with 3.9% of participants reporting cough and fever, consistent with the peak week of laboratory detections (Figure 6).
- A total of 1599 reports of cough and fever were reported by FluWatchers, of which 73% (1175) reported at least 24 hours off work or school, and 19% (306) reported a visit to a health care practitioner.
- A total of 46 tests for influenza and 15 positive tests were reported by FluWatchers.
Figure 6 – Percentage of FluWatchers participants reporting fever and cough, Canada, weeks 2018-40 to 2019-18
Text description
| Surveillance Week | % fever and cough |
|---|---|
| 40 | 2,7% |
| 41 | 2,5% |
| 42 | 1,9% |
| 43 | 1,5% |
| 44 | 1,4% |
| 45 | 1,6% |
| 46 | 1,9% |
| 47 | 1,4% |
| 48 | 2,6% |
| 49 | 2,0% |
| 50 | 3,8% |
| 51 | 3,9% |
| 52 | 3,6% |
| 1 | 3,5% |
| 2 | 2,8% |
| 3 | 2,5% |
| 4 | 3,1% |
| 5 | 3,2% |
| 6 | 2,8% |
| 7 | 2,6% |
| 8 | 2,5% |
| 9 | 2,6% |
| 10 | 3,1% |
| 11 | 2,6% |
| 12 | 2,5% |
| 13 | 2,4% |
| 14 | 2,5% |
| 15 | 1,9% |
| 16 | 2,4% |
| 17 | 2,3% |
| 18 | 2,1% |
Influenza Outbreak Surveillance
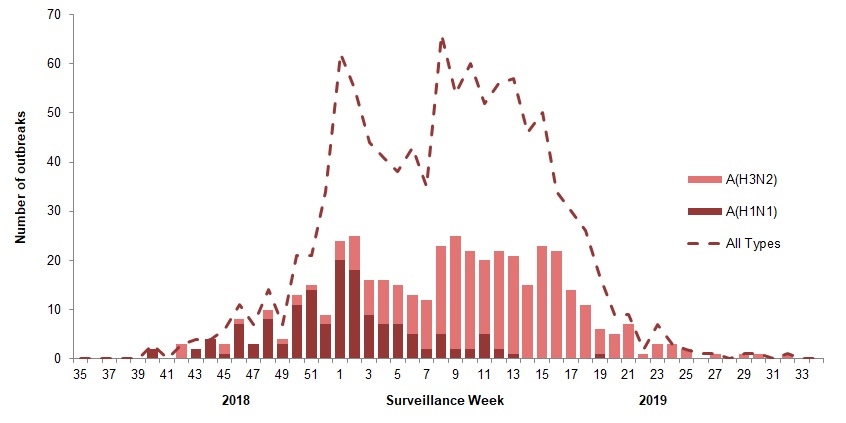
Outbreak activity reports were provided by all provinces and territories each week this season. Not all provinces/territories conduct influenza outbreak surveillance in all the noted facilities. A total of 1038 laboratory-confirmed influenza outbreaks were reported (Figure 7).
- Two waves of activity were observed in the number of reported outbreaks.
- 62% (639) of reported outbreaks were in long-term care facilities (LTCF), 13% (138) were in acute care facilities, 3% (32) in schools and daycares and 22% (229) were in other settings (e.g. retirement homes, correctional facilities, etc.).
- Among the outbreaks for which influenza type (951) and subtype (446) were available, 98% (929) were associated with influenza A and 67% (298) were associated with influenza A(H3N2) respectively.
- Among the 220 outbreaks for which facility type was known and influenza A subtype was available:
- 67% (173) of LTCF outbreaks were associated with influenza A(H3N2)
- 65% (30) of acute care facility outbreaks were associated with influenza A(H3N2)
- 85% (17) of school outbreaks were associatd with influenza A(H1N1).
- The predominant subtype for typed outbreaks was A(H1N1) from weeks 43 to two and A(H3N2) from weeks six to 29; between weeks three to five the number of A(H1N1) and A(H3N2) outbreaks was approximately equal.
In addition, a total of 180 outbreaks of influenza-like illness were reported; 112 occurred in LTCF, 62 in schools, five in acute care facilities, and one in a setting categorized as “other” (e.g. retirement homes, correctional facilities, etc.)
Figure 7 – Number of influenza outbreaks by report week (all types) and number of subtyped influenza A outbreaks by subtype and report week, Canada, weeks 2018-35 to 2019-34
Text description
| Surveillance Week | A(H1N1) | A(H3N2) | All Types |
|---|---|---|---|
| 35 | 0 | 0 | 0 |
| 36 | 0 | 0 | 0 |
| 37 | 0 | 0 | 0 |
| 38 | 0 | 0 | 0 |
| 39 | 0 | 0 | 0 |
| 40 | 2 | 0 | 3 |
| 41 | 0 | 0 | 0 |
| 42 | 0 | 3 | 3 |
| 43 | 2 | 0 | 4 |
| 44 | 4 | 0 | 4 |
| 45 | 1 | 2 | 6 |
| 46 | 7 | 1 | 11 |
| 47 | 3 | 0 | 7 |
| 48 | 8 | 2 | 14 |
| 49 | 3 | 1 | 7 |
| 50 | 11 | 2 | 21 |
| 51 | 14 | 1 | 21 |
| 52 | 7 | 2 | 34 |
| 1 | 20 | 4 | 62 |
| 2 | 18 | 7 | 55 |
| 3 | 9 | 7 | 44 |
| 4 | 7 | 9 | 41 |
| 5 | 7 | 8 | 38 |
| 6 | 5 | 8 | 43 |
| 7 | 2 | 10 | 35 |
| 8 | 5 | 18 | 66 |
| 9 | 2 | 23 | 54 |
| 10 | 2 | 20 | 60 |
| 11 | 5 | 15 | 52 |
| 12 | 2 | 20 | 56 |
| 13 | 1 | 20 | 57 |
| 14 | 0 | 15 | 46 |
| 15 | 0 | 23 | 50 |
| 16 | 0 | 22 | 34 |
| 17 | 0 | 14 | 30 |
| 18 | 0 | 11 | 26 |
| 19 | 1 | 5 | 17 |
| 20 | 0 | 5 | 9 |
| 21 | 0 | 7 | 9 |
| 22 | 0 | 1 | 2 |
| 23 | 0 | 3 | 7 |
| 24 | 0 | 3 | 3 |
| 25 | 0 | 2 | 2 |
| 26 | 0 | 0 | 1 |
| 27 | 0 | 1 | 1 |
| 28 | 0 | 0 | 0 |
| 29 | 0 | 1 | 1 |
| 30 | 0 | 1 | 1 |
| 31 | 0 | 0 | 0 |
| 32 | 0 | 1 | 1 |
| 33 | 0 | 0 | 0 |
| 34 | 0 | 0 | 0 |
Severe Outcomes Influenza Surveillance
Provincial/Territorial Influenza Hospitalizations and Deaths
Nine provinces and territories report influenza associated hospitalizations and deaths for all ages to FluWatch each week – Alberta, Manitoba, Saskatchewan, Newfoundland, Prince Edward Island, Nova Scotia, New Brunswick, Yukon and the Northwest Territories. The number of reporting provinces/territories varied over the course of the season. On average, seven provinces/territories reported each week.
A total of 3,657 influenza-associated hospitalizations were reported which corresponds to an annual seasonal hospitalization incidence of 45 hospitalizations per 100,000 population in the 2018-19 season (Table 1).
- 96% (3,525) were associated with influenza A.
- Among the 2,149 hospitalized cases for which the influenza subtype was available, the majority were associated with A(H1N1) (68%).
- Similar to the temporal pattern observed in laboratory detections, in the earlier part of the season (October to February) the majority (93%) of hospitalizations for which the influenza subtype was available were A(H1N1). In the latter part of the season (March to April) the majority (87%) of hospitalizations were A(H3N2).
- Overall, adults ≥ 65 years of age had the highest rate of hospitalizations (132 hospitalizations per 100,000 population); however, children 0-4 years of age had the highest cumulative hospitalization rate in the first part of the season from weeks 45 to 10, while adults ≥ 65 years of age had the highest cumulative rates in the second part of the season from weeks 10 to 29 which is likely due to the change in predominant subtype over time.
- This season's hospitalization rate (45 per 100,000 population) was slightly above the average compared to the previous five seasons (40 per 100,000 population), and notably higher than the annual seasonal hospitalization rates of the previous two A(H1N1) predominant seasons (25 and 34 per 100,000 population). The higher observed hospitalization rate relative to previous A(H1N1)-predominant seasons is likely due to the circulation of A(H3N2) in the latter part of the season.
| Age Groups (Years) | Influenza Season (Predominant Influenza A Subtype) | |||||
|---|---|---|---|---|---|---|
| 2013-14Table 1 Footnote 2 (H1N1) |
2014-15 (H3N2) |
2015-16 (H1N1) |
2016-17 (H3N2) |
2017-18 (H3N2) |
2018-19 (H1N1) |
|
| 0-4 | 51 | 46 | 96 | 42 | 69 | 97 |
| 5-19 | 7 | 16 | 16 | 10 | 17 | 22 |
| 20-44 | 13 | 13 | 16 | 6 | 12 | 14 |
| 45-64 | 29 | 16 | 37 | 22 | 41 | 40 |
| 65+ | 41 | 207 | 68 | 143 | 268 | 132 |
| Overall | 25 | 45 | 34 | 34 | 64 | 45 |
Highlighted boxes indicate the age group with the highest rate during the season. |
||||||
A total of 613 ICU admissions and 224 deaths were reported this season.
- 97% (595) of reported ICU admissions and 98% (220) of reported deaths were associated with influenza A.
- Similar to the previous two A(H1N1)-predominant seasons, the highest proportion of ICU admissions was reported among adults 45-64 years of age (39%).
- The highest proportion of deaths was reported among adults ≥ 65 years of age (66%). This was approximately 20% higher than the number reported in the previous two A(H1N1)-predominant seasons and approximately 20% lower than the number reported in the previous three A(H3N2)-predominant seasons, likely as a result of the mixed A(H1N1) and A(H3N2) season.
Pediatric Influenza Hospitalizations and Deaths
Pediatric hospitalization data are provided by the Canadian Immunization Monitoring Program Active (IMPACT). IMPACT actively monitors pediatric influenza hospitalizations from 12 hospital sites in British Columbia, Alberta, Saskatchewan, Manitoba, Ontario, Quebec, Nova Scotia and Newfoundland.
A total of 1,352 pediatric hospitalized cases were reported this season. While the total number of hospitalized cases was above the five-year average (mean: 888; range: 593 to 1350) and the average of the last two A(H1N1)-predominant seasons (mean:1,032; range:714 to 1350), the number of hospitalized cases each week was within the expected range based on the minimum and maximum number of weekly cases observed in the previous five seasons.
- Nationally, reports began earlier than previous seasons and peaked in week 52 consistent with the peak week of laboratory detections; however peaks varied by region, with an earlier peak in activity in sites in western Canada and a later peak of activity in sites in eastern Canada (Figure 8).
- More subtle peaks in activity can also be observed in western and central sites between weeks nine and 20 and in weeks 17 to 21 in eastern sites which may have resulted from the second wave of A(H3N2) activity and, along with this season's longer duration, may have contributed to the higher than average hospitalization counts.
- 91% (1,227) of pediatric hospitalized cases were associated with influenza A.
- Among the 402 pediatric hospitalized cases for which the influenza subtype was available, 80% (323) were associated with A(H1N1).
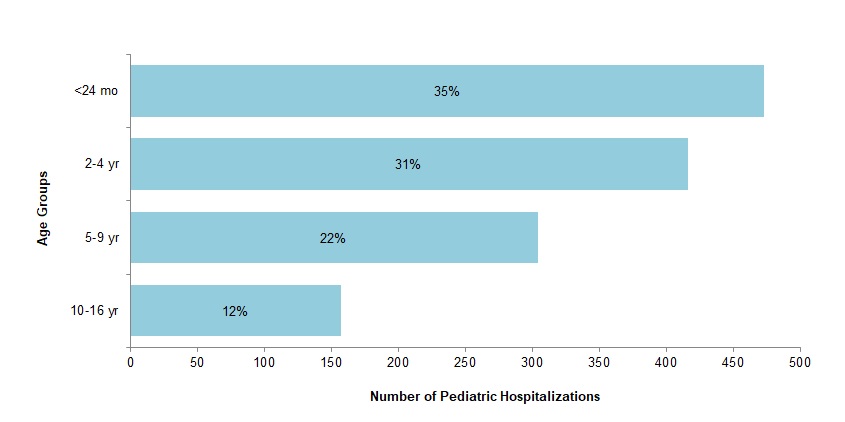
- 66% of pediatric hospitalized cases were among children under five years of age (Figure 9). This is consistent with the average proportion of hospitalized cases under five in the past five seasons (65%) and slightly less than the average of the two post-pandemic A(H1N1)-predominant seasons (71%) which were in 2013-14 and 2015-16.
Among the 1,352 pediatric hospitalized cases, a total of 271 (20%) ICU admissions and 10 (0.7%) deaths were reported. The proportion of hospitalized cases resulting in ICU admission was slightly above the average from the past five seasons (17%) and the last two A(H1N1)-predominant seasons (17%). The proportion of hospitalized cases resulting in death was consistent with the average from the past five seasons (0.6%) and slightly above the average of the last two A(H1N1)-predominant seasons (0.4%).
- 59% (161) of ICU admissions were among children under five years of age.
- 92% (248) of ICU admissions were associated with influenza A; 83% of the 111 cases for which the influenza A subtype was available were associated with A(H1N1).
- 80% (8) of deaths occurred in children two to four years of age.
- All deaths were associated with influenza A.
Figure 8 – Number of pediatric (≤16 years of age) hospitalizations reported by the IMPACT network, by region and by week of admission, Canada, weeks 2018-35 to 2019-34
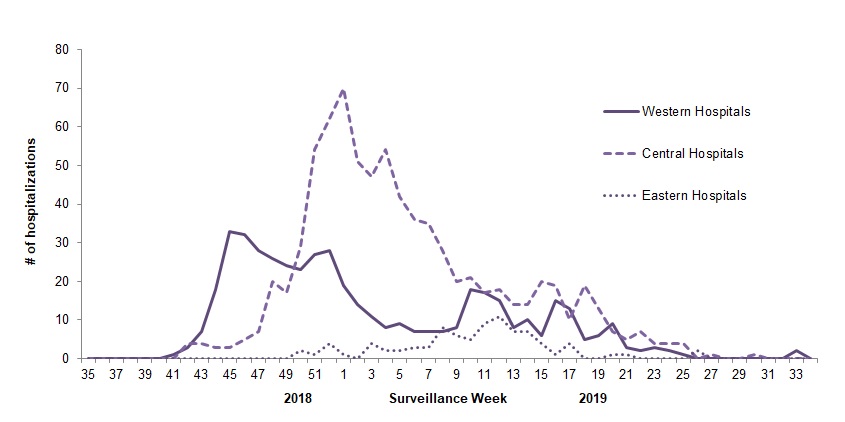
Western hospitals consist of four sites in Vancouver, Calgary, Edmonton and Saskatoon. Central hospitals consist of 6 sites in Winnipeg, Toronto, Ottawa, Montreal and Quebec City. Eastern hospitals consist of 2 sites in Halifax & St. John's.
Text description
| Surveillance Week | Western Hospitals | Central Hospitals | Eastern Hospitals |
|---|---|---|---|
| 35 | 0 | 0 | 0 |
| 36 | 0 | 0 | 0 |
| 37 | 0 | 0 | 0 |
| 38 | 0 | 0 | 0 |
| 39 | 0 | 0 | 0 |
| 40 | 0 | 0 | 0 |
| 41 | <5 | 0 | 0 |
| 42 | <5 | <5 | 0 |
| 43 | 7 | <5 | 0 |
| 44 | 18 | <5 | 0 |
| 45 | 33 | <5 | 0 |
| 46 | 32 | 5 | 0 |
| 47 | 28 | 7 | 0 |
| 48 | 26 | 20 | 0 |
| 49 | 24 | 17 | 0 |
| 50 | 23 | 29 | <5 |
| 51 | 27 | 54 | <5 |
| 52 | 28 | 62 | <5 |
| <5 | 19 | 70 | <5 |
| <5 | 14 | 51 | 0 |
| <5 | 11 | 47 | <5 |
| <5 | 8 | 54 | <5 |
| 5 | 9 | 42 | <5 |
| 6 | 7 | 36 | <5 |
| 7 | 7 | 35 | <5 |
| 8 | 7 | 28 | 8 |
| 9 | 8 | 20 | 6 |
| 10 | 18 | 21 | 5 |
| 11 | 17 | 17 | 9 |
| 12 | 15 | 18 | 11 |
| 13 | 8 | 14 | 7 |
| 14 | 10 | 14 | 7 |
| 15 | 6 | 20 | <5 |
| 16 | 15 | 19 | <5 |
| 17 | 13 | 10 | <5 |
| 18 | 5 | 19 | 0 |
| 19 | 6 | 13 | 0 |
| 20 | 9 | 7 | <5 |
| 21 | <5 | 5 | <5 |
| 22 | <5 | 7 | 0 |
| 23 | <5 | <5 | 0 |
| 24 | <5 | <5 | 0 |
| 25 | <5 | <5 | 0 |
| 26 | 0 | 0 | <5 |
| 27 | 0 | <5 | 0 |
| 28 | 0 | 0 | 0 |
| 29 | 0 | 0 | 0 |
| 30 | 0 | <5 | 0 |
| 31 | 0 | 0 | 0 |
| 32 | 0 | 0 | 0 |
| 33 | <5 | 0 | 0 |
| 34 | 0 | 0 | 0 |
Figure 9 – Number and percentage of pediatric hospitalizations (≤16 years of age) with influenza by age-group reported by the IMPACT network, Canada, weeks 2018-35 to 2019-34
Text description
| Age Groups | Total Number | Percent Total |
|---|---|---|
| < 24 mo | 475 | 35% |
| 2-4 yr | 414 | 31% |
| 5-9 yr | 304 | 22% |
| 10-16 yr | 159 | 12% |
Adult Influenza Hospitalizations and Deaths
Surveillance of laboratory-confirmed influenza-associated adult (≥16 years of age) hospitalizations by the Canadian Immunization Research Network (CIRN) Serious Outcomes Surveillance (SOS) network began on November 1st (week 44) for the 2018-19 season and ended on June 1st (week 22). CIRN-SOS collects influenza hospitalization data from eight hospital sites in Ontario, Quebec, and Nova Scotia.
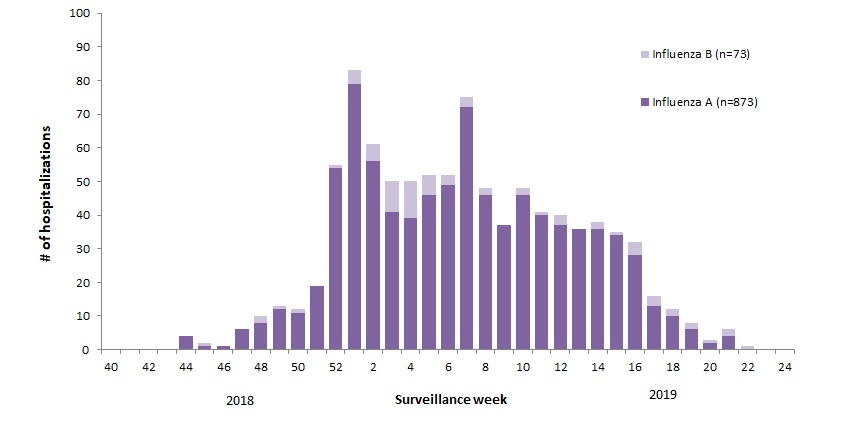
Figure 10 – Number of adult hospitalizations (≥16 years of age) with influenza reported by CIRN-SOS by surveillance week and influenza type, Canada, weeks 2018-44 to 2019-22
Text description
| Surveillance week | Influenza A | Influenza B |
|---|---|---|
| 40 | 0 | 0 |
| 41 | 0 | 0 |
| 42 | 0 | 0 |
| 43 | 0 | 0 |
| 44 | 4 | 0 |
| 45 | 1 | 1 |
| 46 | 1 | 0 |
| 47 | 6 | 0 |
| 48 | 8 | 2 |
| 49 | 12 | 1 |
| 50 | 11 | 1 |
| 51 | 19 | 0 |
| 52 | 54 | 1 |
| 1 | 79 | 4 |
| 2 | 56 | 5 |
| 3 | 41 | 9 |
| 4 | 39 | 11 |
| 5 | 46 | 6 |
| 6 | 49 | 3 |
| 7 | 72 | 3 |
| 8 | 46 | 2 |
| 9 | 37 | 0 |
| 10 | 46 | 2 |
| 11 | 40 | 1 |
| 12 | 37 | 3 |
| 13 | 36 | 0 |
| 14 | 36 | 2 |
| 15 | 34 | 1 |
| 16 | 28 | 4 |
| 17 | 13 | 3 |
| 18 | 10 | 2 |
| 19 | 6 | 2 |
| 20 | 2 | 1 |
| 21 | 4 | 2 |
| 22 | - | 1 |
| 23 | 0 | 0 |
| 24 | 0 | 0 |
A total of 946 hospitalizations were reported by CIRN-SOS sentinels this season (age ≥16) (Figure 10):
- 92% (873) of hospitalizations were associated with influenza A.
- Among the 838 hospitalized cases for which the influenza subtype was available, 52% (439) were associated with A(H1N1).
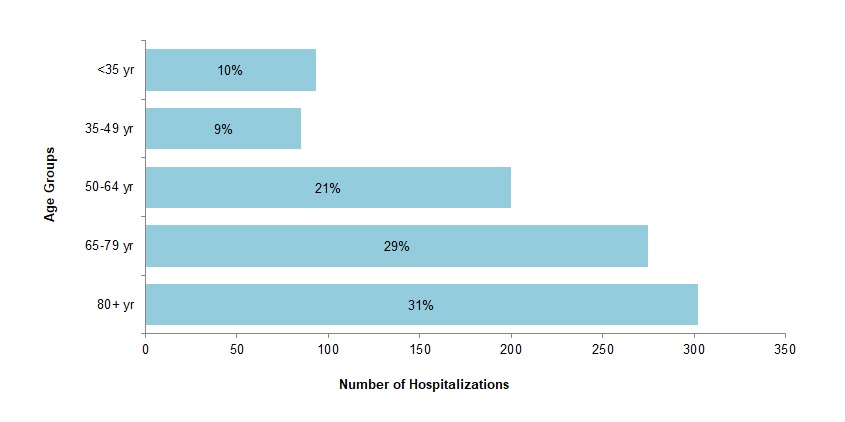
- The highest proportion of hospitalized cases (31%) was among adults aged 80 years and over, followed by adults aged 65-79 years (29%) (Figure 11). The mean age of hospitalized cases was 67 years (range: 16 to 100).
- 89% of hospitalized cases reported at least one comorbid condition; vascular disorders were the most common comorbity (70% of all patients reporting a comorbidity) followed by cardiac disorders (43%).
A total of 137 (14%) ICU admissions and 65 (7%) deaths were reported.
- 95% (131) of ICU admissions were associated with influenza A.
- The majority of ICU admissions were among adults under the age of 65 (63%).
- The majority of deaths occurred among adults over the age of 65 (75%) with a mean age of 77 years.
Figure 11 – Number and percentage of adult hospitalizations (≥16 years of age) with influenza by age group reported by CIRN-SOS, Canada, 2018-19, weeks 2018-44 to 2019-22
Text description
| Age Group | Total Number | Percentage |
|---|---|---|
| 80+ yr | 297 | 31% |
| 65-79 yr | 270 | 29% |
| 50-64 yr | 203 | 21% |
| 35-49 yr | 85 | 9% |
| <35 yr | 91 | 10% |
Influenza Strain Characterizations
During the 2018-19 season, the National Microbiology Laboratory (NML) characterized 2,545 influenza viruses received from Canadian laboratories: 1,656 A(H1N1), 649 A(H3N2), 240 influenza B. Antigenic characterization is established by hemagglutination inhibition (HI) assay using cell-passaged vaccine reference viruses for A(H1N1) and influenza B, and the egg-passaged vaccine reference virus for A(H3N2). Over recent years, circulating strains of A(H3N2) have evolved, and are increasingly difficult to characterize by HI assay. Genetic characterization is established by sequencing the hemagglutinin gene of the influenza viruses to compare their genetic properties.
Influenza A(H3N2)
The influenza A(H3N2) component of the 2018-19 Northern Hemisphere influenza vaccine was an A/Singapore/INFIMH-16-0019/2016-like virus which belongs to the genetic group 3C.2a1.
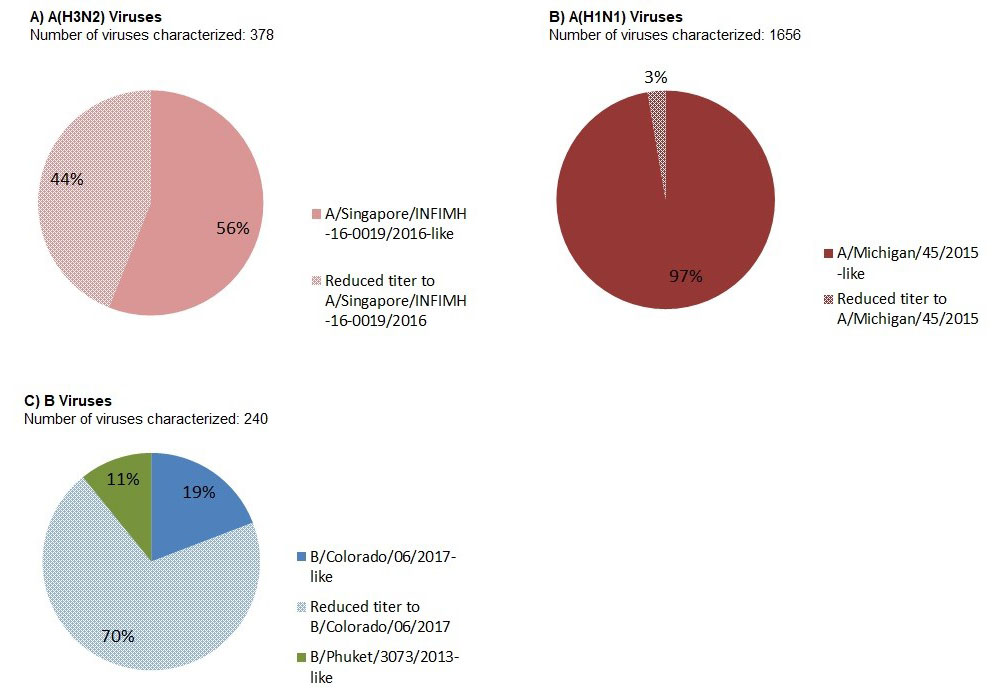
All of the A(H3N2) viruses (649) were genetically characterized and 42% (378) of A(H3N2) viruses also grew to sufficient hemagglutination titer for antigenic characterization by HI assay (Table 2). Among all influenza A(H3N2) viruses genetically characterized, the most common subclade observed this season was 3C.2a1 (Figure 12). Of the A(H3N2) viruses characterized antigenically by HI assay (Figure 13-A):
- 56% (212) were characterized as A/Singapore/INFIMH-16-0019/2016-like by HI testing using antiserum raised against egg-propagated A/Singapore/INFIMH-16-0019/2016.
- 44% (166) of viruses showed reduced titer with ferret antisera raised against egg-propagated A/Singapore/INFIMH-16-0019/2016
- Among A(H3N2) viruses that showed reduced titer to A/Singapore/INFIMH-16-0019/2016, a greater proportion belonged to the genetic subclade 3C.3a. This is consistent with the genetic differences between subclades 3C.3a and 3C.2a1.
| Genetic clade | Genetic charaterization only | Antigenic characterization: | Total A(H3N2) | |
|---|---|---|---|---|
| Similar to A/Singapore/INFIMH-16-0019/2016 |
Reduced titer to A/Singapore/INFIMH-16-0019/2016 |
|||
| Clade 3C.2a | 20 | 17 | 3 | 40 |
| Subclade 3C.2a1 | 242 | 132 | 16 | 390 |
| Clade 3C.3a | 8 | 63 | 147 | 218 |
| Total | 270 | 212 | 166 | 648 |
Influenza A(H1N1)
The influenza A(H1N1) component of the 2018-19 Northern Hemisphere influenza vaccine was an A/Michigan/45/2015-like virus.
Approximately 97% (1612) of the A(H1N1) viruses characterized were antigenically similar to A/Michigan/45/2015, while only 3% (44) of viruses showed reduced titer with ferret antisera raised against cell culture-propagated A/Michigan/45/2015 (Figure 13-B).
Influenza B
The recommended influenza B components for the 2018-19 Northern Hemisphere influenza vaccine were an B/Colorado/06/2017-like virus (Victoria lineage) and a B/Phuket/3073/2013-like virus (Yamagata lineage). The B/Colorado/06/2017-like virus was included in both the trivalent and quadrivalent vaccines. The B/Phuket/3073/2013-like virus was included in the quadrivalent influenza vaccine.
The majority of B viruses characterized, 70% (168), showed reduced titer with ferret antisera raised against cell culture-propagated B/Colorado/06/2017 (Figure 13-C). Sequence analysis showed that 96% (162) of viruses that showed reduced titer had a three amino acid deletion (162-164) in the hemagglutinin gene. Of the remaining B viruses characterized, 19% (46) were characterized as B/Colorado/06/2017-like (Victoria lineage) and 11% (26) were characterized as B/Phuket/3073/2013-like (Yamagata lineage).
Figure 12 – Distribution of genetic clades among characterized influenza A(H3N2) viruses, Canada, weeks 2018-35 to 2019-34

Text description
| Genetic Clade of A(H3N2) virus | Number of viruses | Percentage |
|---|---|---|
| Clade 3C.2a | 40 | 6% |
| Subclade 3C.2a1 | 390 | 60% |
| Clade 3C.3a | 218 | 34% |
Figure 13 – Distribution of antigenic phenotypes among characterized influenza viruses, Canada, weeks 2018-35 to 2019-34
Text description
| Number of viruses | Percentage | |
|---|---|---|
| A/Singapore/INFIMH-16-0019/2016-like | 212 | 56,1% |
| Reduced titer to A/Singapore/INFIMH-16-0019/2016 | 166 | 43,9% |
| Total | 378 | 100% |
| Number of viruses | Percentage | |
|---|---|---|
| A/Michigan/45/2015-like | 1612 | 97,3% |
| Reduced titer to A/Michigan/45/2015 | 44 | 2,7% |
| Total | 1656 | 100% |
| Number of viruses | Percentage | |
|---|---|---|
| B/Colorado/06/2017-like | 46 | 19,2% |
| Reduced titer to B/Colorado/06/2017 | 168 | 70,0% |
| B/Phuket/3073/2013-like | 26 | 10,8% |
| Total | 240 | 100% |
Antiviral Resistance
All influenza viruses characterized at the NML in the 2018-19 season were resistant to amantadine and sensitive to zanamivir. All influenza A(H3N2), all influenza B viruses, and all but four A(H1N1) viruses were sensitive to oseltamivir. The four A(H1N1) viruses resistant to oseltamivir had a H275Y mutation in the viral neuraminidase. The proportion of influenza viruses resistant to oseltamivir in 2018-19 is similar to recent seasons. Since the 2009 pandemic, nearly all circulating strains of influenza have been sensitive to oseltamivir and zanamivir. Widespread resistance to amantadine among influenza A viruses has been observed for more than 10 years.
| Virus type and subtype | Oseltamivir | Zanamivir | Amantadine | |||
|---|---|---|---|---|---|---|
| # tested | # resistant (%) | # tested | # resistant (%) | # tested | # resistant (%) | |
| A (H3N2) | 222 | 0 (0%) | 222 | 0 (0%) | 135 | 135 (100%) |
| A (H1N1) | 1084 | 4 (0.4%) | 1082 | 0 (0%) | 391 | 391 (100%) |
| B | 142 | 0 (0%) | 142 | 0 (0%) | NATable 3 Footnote 1 | NATable 3 Footnote 1 |
| TOTAL | 1448 | 4 (0.3%) | 1446 | 0 (0%) | 526 | 526 (100%) |
|
||||||
Vaccine Monitoring
Vaccine monitoring refers to activities related to the monitoring of influenza vaccine coverage and effectiveness.
The quadrivalent vaccines used in the 2018-19 northern hemisphere influenza season contained:
- an A/Michigan/45/2015 (H1N1)pdm09-like virus;
- an A/Singapore/INFIMH-16-0019/2016 (H3N2)-like virus;
- a B/Colorado/06/2017-like virus (B/Victoria/2/87 lineage); and
- a B/Phuket/3073/2013-like virus (B/Yamagata/16/88 lineage).
The B/Colorado/06/2017-like virus was included in both the trivalent and quadrivalent vaccines.
Vaccine Coverage
The Seasonal Influenza Immunization Coverage Survey is an annual telephone survey conducted between January and February that collects information from Canadians on whether they received the annual seasonal influenza vaccine that season. Vaccine coverage is measured as the percentage of people who received the influenza vaccine in a specific influenza season. More detail on the methodology used for the coverage survey can be viewed here.
Overall, influenza vaccination coverage in the 2018-2019 season (42%) was significantly higher than the 2017-2018 season (38%) and the 2016-2017 season (36%). The vaccination rate was lowest among adults 18-64 years of age without any chronic medical condition (31%); however, coverage increased mostly among this subgroup when compared to the previous two seasons. Among high-risk groups, vaccination coverage rates for adults 18-64 years of age with a chronic medical condition (43%) and seniors 65 years of age and older (70%) remained steady over the past three seasons.
| Age group (years) | Male | Female | Combined | ||||
|---|---|---|---|---|---|---|---|
| Total | Vaccine Coverage (%) |
Total | Vaccine Coverage (%) |
Total | Vaccine Coverage (%) |
||
| All adults (≥18) | 1568 | 36.6 | 2150 | 46.8 | 3726 | 41.8 | |
| 18-64 | All | 1252 | 28.6 | 1640 | 39.9 | 2898 | 34.3 |
| without chronic diseases | 948 | 25.8 | 1171 | 36.1 | 2124 | 30.8 | |
| with chronic diseases | 304 | 36.3 | 465 | 48.5 | 770 | 42.8 | |
| ≥65 | 316 | 69.0 | 510 | 70.9 | 828 | 69.9 | |
|
|||||||
Vaccine Effectiveness
The Canadian Sentinel Practitioner Surveillance Network (SPSN) provides estimates of the effectiveness of the seasonal influenza vaccine in preventing primary care visits for laboratory confirmed influenza among Canadians of all ages but primarily those from 20-64 years of age.
Based on data collected between November 1, 2018 and April 30, 2019, VE against any influenza, foremost driven by A(H1N1) viruses, was 56% (95% CI: 47 to 64%), and for A(H1N1) alone was 67% (95% CI: 58 to 75%) (Table 5). This substantial protection against A(H1N1) was observed in all age groups. Conversely, the SPSN reported little or no vaccine protection against A(H3N2) viruses, with an overall VE against medically-attended outpatient A(H3N2) illness of 17% (95% CI: -13 to 39). Overall, the A(H3N2) VE estimate for 2018-19 was lower than expected generally for A(H3N2) vaccines (~30%), and similar to that observed by SPSN in the 2017-18 A(H3N2)-dominant season where VE was estimated at 14% (95% CI: -8 to 31).
More information on the SPSN including study methodology and available publications can be viewed here.
The Serious Outcomes Surveillance (SOS) Network of the Canadian Immunization Research Network (CIRN-SOS) provides estimates of the effectiveness of the seasonal influenza vaccine in preventing hospitalization for laboratory-confirmed influenza in adults.
Based on data collected between November 1, 2018 and June 1, 2019 among adult (≥16 years of age) hospitalized cases of influenza, VE against any influenza was 43% (95% CI: 28 to 55%), and for A(H1N1) alone was 68% (95% CI: 52 to 79%). CIRN-SOS also reported little or no vaccine protection against A(H3N2) viruses, with an overall VE against hospitalized cases of influenza A(H3N2) of 19% (95% CI: -35 to 51). The number of influenza B hospitalized cases was too low to calculate an adjusted VE estimate.
More information on the CIRN-SOS Network including study methodology and available publications can be viewed here.
| SPSN (Primay Care Visits)Table 5 Footnote † | CIRN-SOS (Adult Hospitalizations) | ||||
|---|---|---|---|---|---|
| VE(%) (CI)Table 5 Footnote a | N | VE(%) (CI)Table 5 Footnote b | N | ||
| All Influenza | 56 (47, 64) | 3034 | 43 (28, 55) | 1350 | |
| Influenza A | All | 55 (46, 63) | 2992 | 58 (43, 69) | 1105 |
| Influenza A H1N1 | 67 (58, 75) | 2630 | 68 (52, 79) | 562 | |
| Influenza A H3N2 | 17 (-13, 39) | 1993 | 19 (-35, 51) | 409 | |
| Influenza B | 72 (27, 89) | 1703 | n/aTable 5 Footnote c | 140 | |
|
|||||
Provincial and International Surveillance Links
- British Columbia – Influenza Surveillance; Vaccine Effectiveness Monitoring
- Alberta – Respiratory Virus Surveillance
- Saskatchewan – Influenza Reports
- Manitoba – Seasonal Influenza Reports
- Ontario – Ontario Respiratory Pathogen Bulletin
- Québec – Système de surveillance de la grippe (available in French only)
- New Brunswick – Influenza Surveillance Reports
- Prince Edward Island – Influenza Summary
- Nova Scotia – Respiratory Watch Report
- Newfoundland and Labrador – Surveillance and Disease Reports
- Yukon – Information on Pandemic, Influenza, Seasonal Flu, Avian Flu and H1N1
- Northwest Territories – Influenza/ Flu Information
- Nunavut – Influenza Information
- World Health Organization – FluNet (Global Influenza Surveillance Network)
- Pan American Health Organization – Influenza situation report
- U.S. Centers for Disease Prevention & Control (CDC) - Weekly Influenza Summary Update
- ECDC – Surveillance reports and disease data on seasonal influenza
- United Kingdom – Weekly Influenza Activity Reports
- Hong Kong Centre for Health Protection - Flu Express
- Australia – Influenza Surveillance Report and Activity Updates
- New Zealand – Influenza Weekly Update
Notes
The data in the FluWatch report represent surveillance data available at the time of writing. All data are preliminary and may change as more reports are received.
To learn more about the FluWatch program, see the Overview of influenza monitoring in Canada page.
For more information on the flu, see our Flu (influenza) web page.
We would like to thank all the Fluwatch surveillance partners participating in this year's influenza surveillance program.
This report is available on the Government of Canada Influenza webpage.
Ce rapport est disponible dans les deux langues officielles.