
Pressures behind the rising costs in Canadian private drug plans pre- and post- COVID-19 pandemic: 2018–2023
Presented at ISPOR 2025, May 13–16, 2025, at CAHSPR 2025, May 26–29, 2025, and at the 29th Annual CAPT conference, September 22-23, 2025
Yvonne Zhang
Objective
Private drug plans play an important role in the Canadian healthcare system, and costs are a major concern for plan sponsors. This study explores the key cost pressures for private drug plans, differentiating between short-term and long-term effects, and highlighting the impact of the COVID-19 pandemic.
Approach
The study focuses on 2023, with a retrospective look at trends since 2018. It highlights the impact of the pandemic on private drug plan spending. An expanded Laspeyres cost-driver model analysisFootnote 1 isolates the key factors contributing to the growth in drug expenditures (see Definitions).
Data
The main data source for this report is the IQVIA™ Private Pay Direct Drug Plan Database, which provides claim-level data from private pay-direct drug plans across all Canadian provinces. The capture rate ranged from 79.9% to 85.7% of the private pay-direct market, varying by year.
Definitions
Demographic effect: Changes in the beneficiary population.
Volume effect: Changes in the amount of drugs dispensed (e.g., number/size of claims).
Drug-mix effect: Shifts between lower- and higher-priced drugs.
Price effect: Changes in drug prices.
Substitution effect: Shifts from brand-name to generic or biosimilar options.
Results
1. Drug cost drivers
Drug costs jumped by 14.1% in 2023 in private plans, rebounding from the slower (4–5%) annual increases during the pandemic
- The primary driver was the increased use of higher-cost medicines (drug-mix effect), averaging 6.3% over the six years from 2018 to 2023 and peaking at 9.2% in 2023 (Figure 1).
- Cost-mitigating measures, including generic and biosimilar substitutions and price reductions, decreased costs by 1% to 4% annually. In 2023, the substitution effect gained traction, pulling costs down (-2.0%), while price change had a minimal impact (0.5%).
- The impact of demographics and associated claim changes fluctuated between -3% and 7%. In 2023, a significant rebound in the number of claimants resulted in an 8.9% demographic push effect, while a slower growth in drug use per claimant led to a -1.9% pull-down effect.
Figure 1. Drug cost drivers, private drug plans, 2018 to 2023
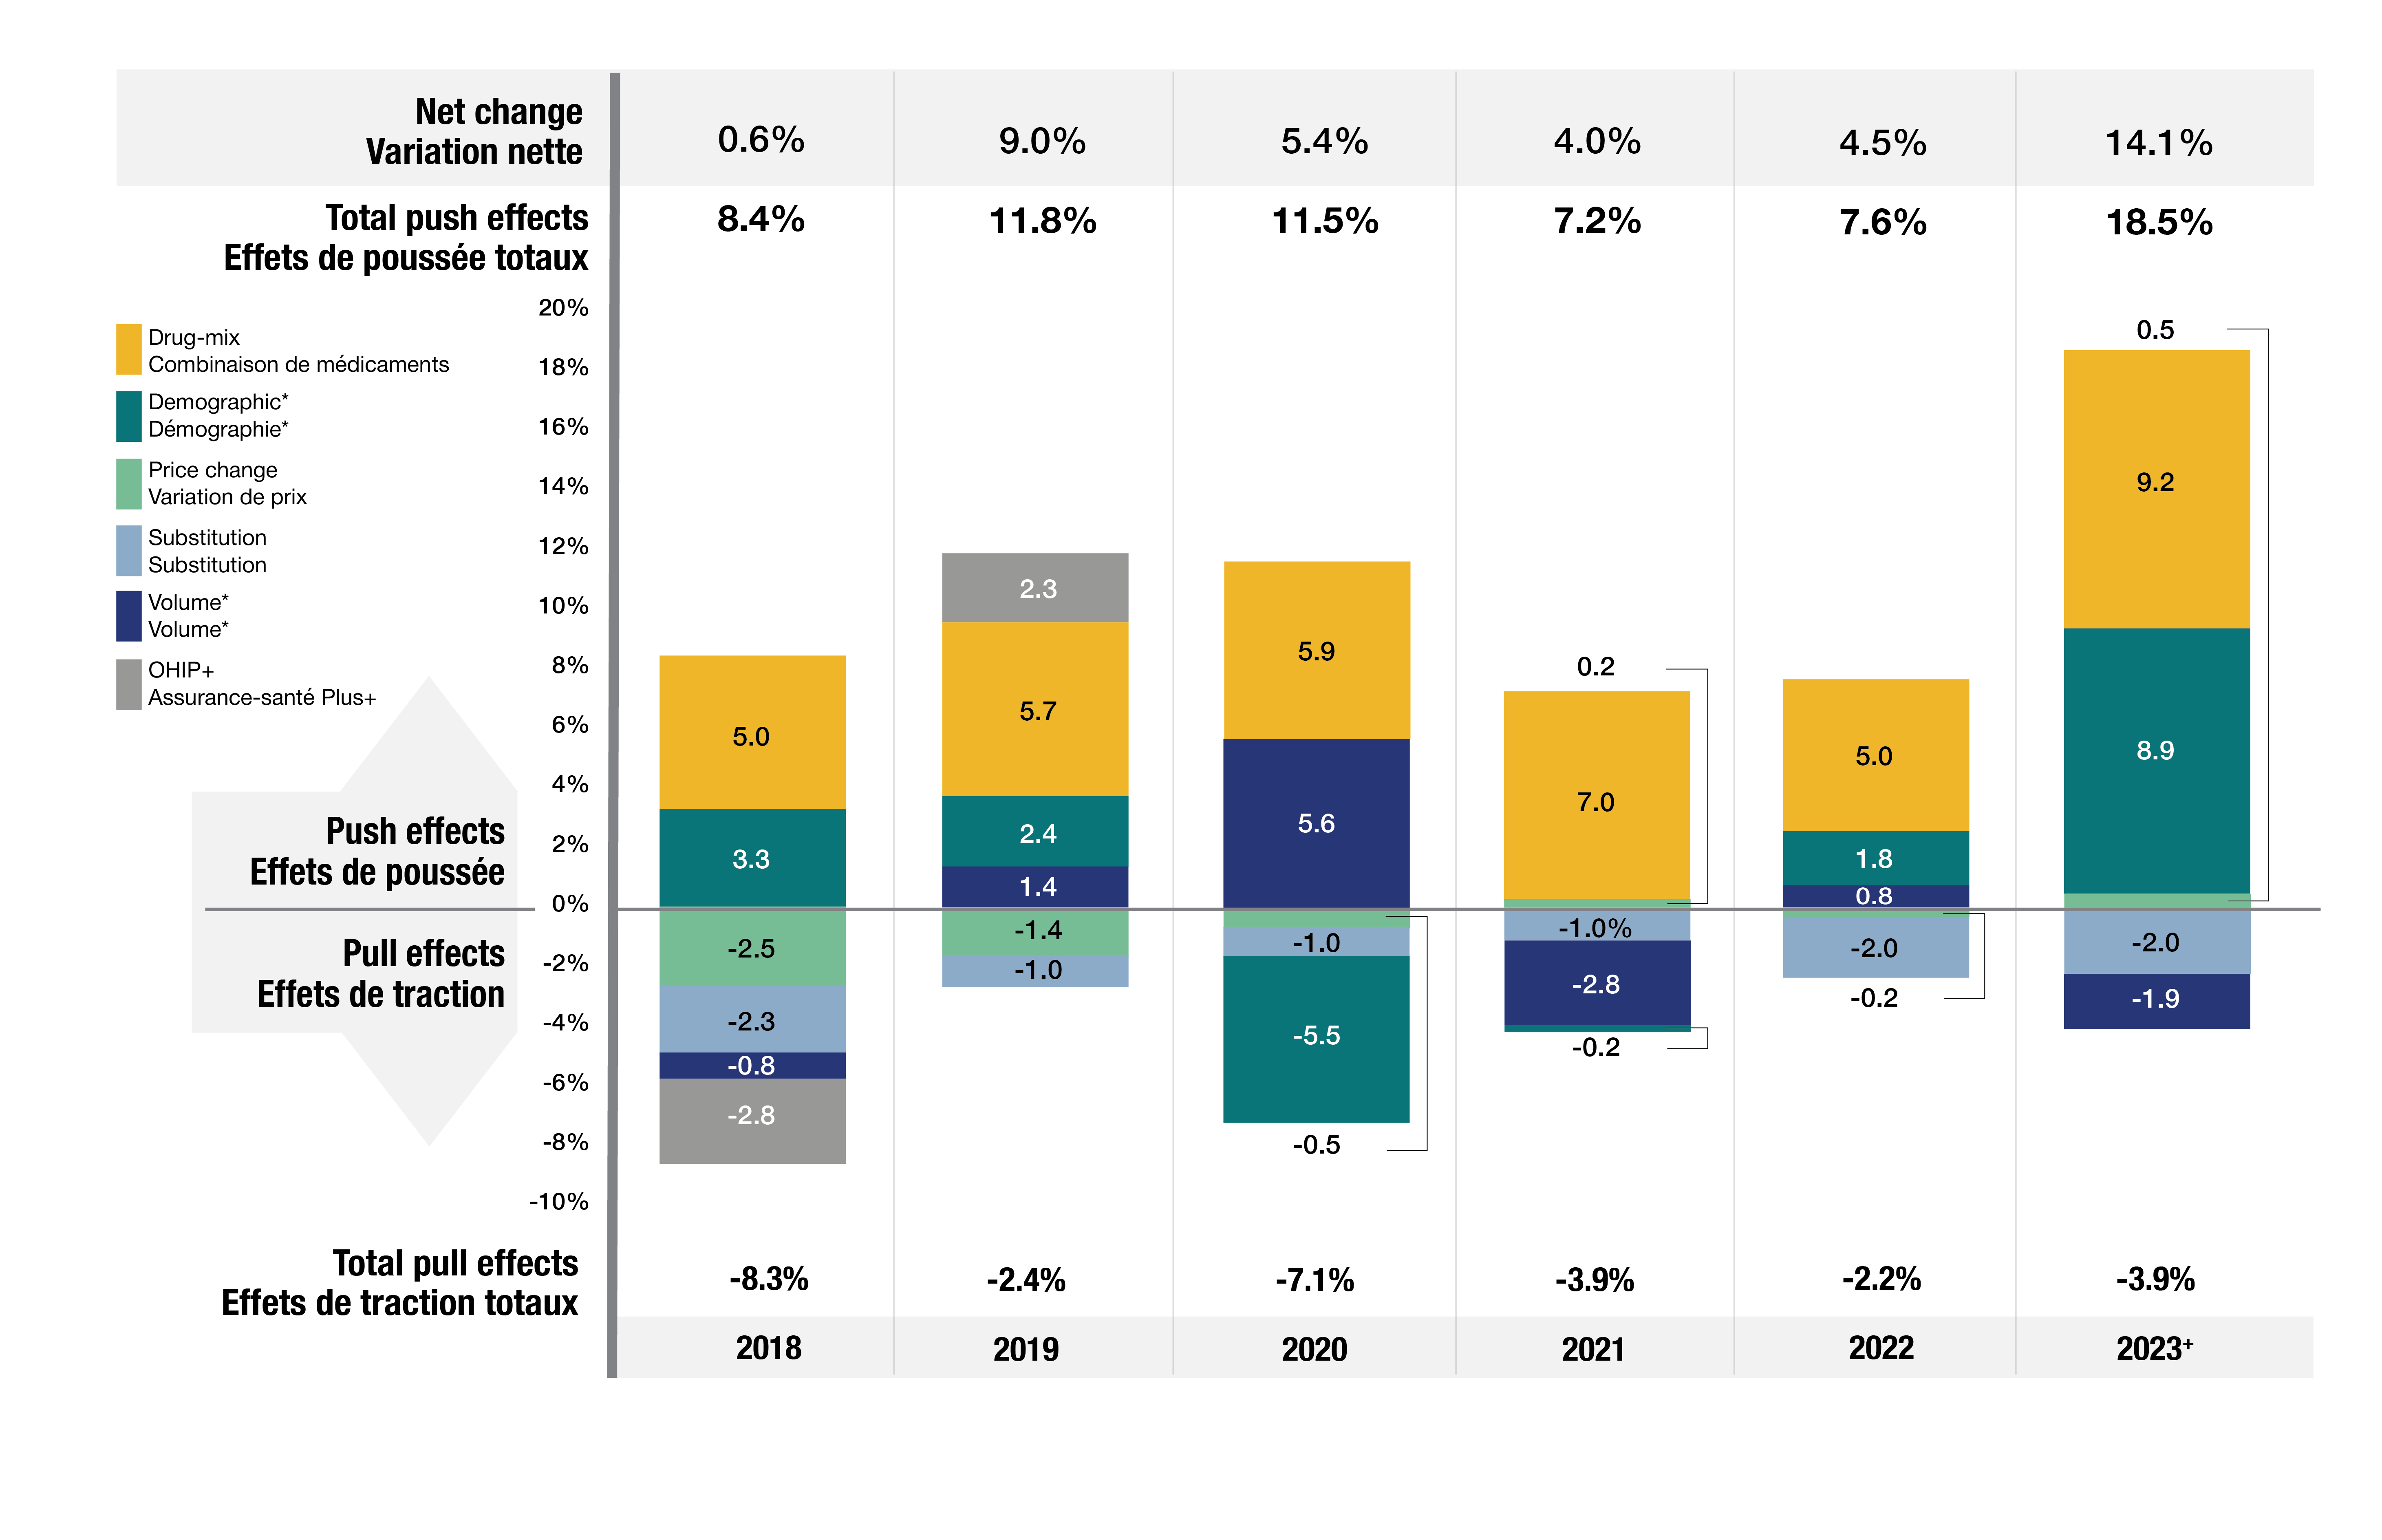
Figure - Text version
| 2018 | 2019 | 2020 | 2021 | 2022 | 2023† | |
|---|---|---|---|---|---|---|
Drug-mix |
5.0% |
5.7% |
5.9% |
7.0% |
5.0% |
9.2% |
Demographic* |
3.3% |
2.4% |
-5.5% |
-0.2% |
1.8% |
8.9% |
Price change |
-2.5% |
-1.4% |
-0.5% |
0.2% |
-0.2% |
0.5% |
Substitution |
-2.3% |
-1.0% |
-1.0% |
-1.0% |
-2.0% |
-2.0% |
Volume* |
-0.8% |
1.4% |
5.6% |
-2.8% |
0.8% |
-1.9% |
OHIP+ |
-2.8% |
2.3% |
- |
- |
- |
- |
| Total push effects | 8.4% | 11.8% | 11.5% | 7.2% | 7.6% | 18.5% |
| Total pull effects | -8.3% | -2.4% | -7.1% | -3.9% | -2.2% | -3.9% |
| Net change | 0.6% | 9.0% | 5.4% | 4.0% | 4.5% | 14.1% |
Note: When multiple factors change simultaneously, they create a residual or cross effect, which is not reported separately in this analysis, but is accounted for in the net change.
*Partial data discontinuity from the private drug plan data supplier in 2021 and 2022 influenced the results for the demographic and volume effects.
† The 2023 demographic effect is based on projected claimant data.
2. Drug-mix effect
The increased use of higher-cost medicines was the primary driver of drug cost growth, consistently pushing costs up by 5%–9% annually
- From 2018 to 2023, the number of medicines costing over $10k per patient annually increased from 190 to 279. The number of drugs costing over $25k annually surged from 122 to 181 (Figure 2).
- By 2023, medicines costing over $10k and $25k annually represented 1/3 and 1/6 of total drug costs, respectively. These high-cost drugs were used by only 1.5% and 0.4% of claimants, respectively
- The steepest rise from 2018 to 2023 was for drugs in the highest cost band (>$100k). Their number increased from 28 to 46, and their cost share more than doubled from 1.5% to 3.5%.
Figure 2. Trends in the number and cost share of high-cost drugs, private drug plans, 2018 to 2023
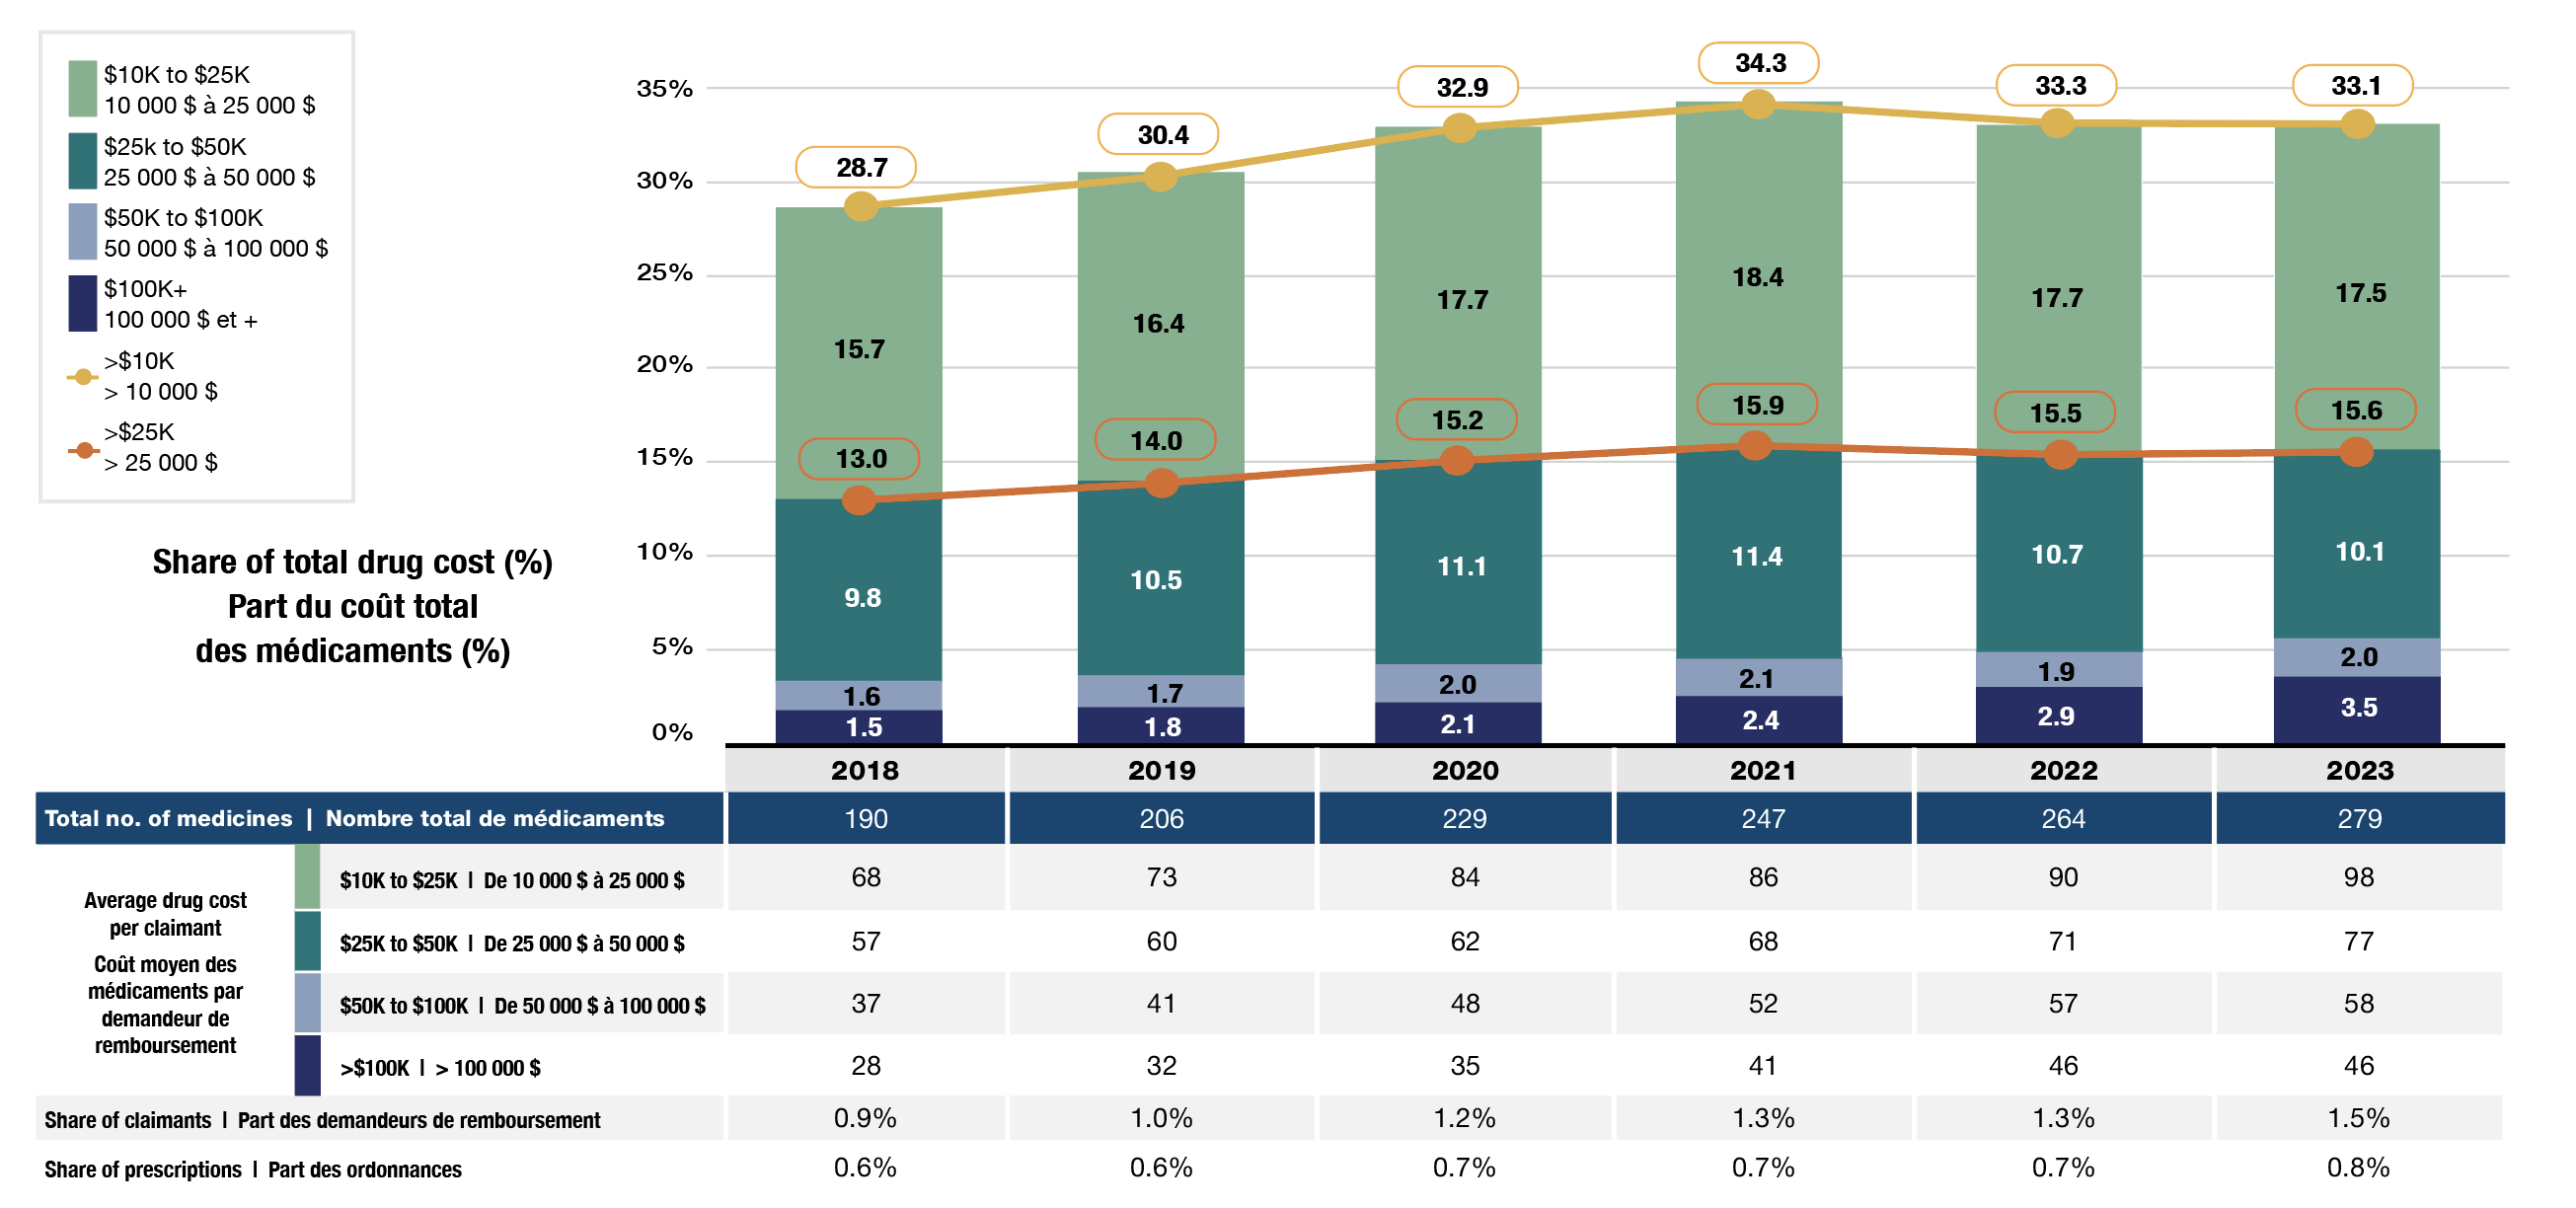
Figure - Text version
| Cost share of high-cost drugs, by cost category | Over $100,000 | $50,000 to $100,000 | $25,000 to $50,000 | $10,000 to $25,000 | Over $25,000 | Over $10,000 |
|---|---|---|---|---|---|---|
2018 |
1.5% |
1.6% |
9.8% |
15.7% |
13.0% |
28.7% |
2019 |
1.8% |
1.7% |
10.5% |
16.4% |
14.0% |
30.4% |
2020 |
2.1% |
2.0% |
11.1% |
17.7% |
15.2% |
32.9% |
2021 |
2.4% |
2.1% |
11.4% |
18.4% |
15.9% |
34.3% |
2022 |
2.9% |
1.9% |
10.7% |
17.7% |
15.5% |
33.3% |
2023 |
3.5% |
2.0% |
10.1% |
17.5% |
15.6% |
33.1% |
| 2018 | 2019 | 2020 | 2021 | 2022 | 2023 | ||
|---|---|---|---|---|---|---|---|
Total number of medicines |
190 |
206 |
229 |
247 |
264 |
279 |
|
Average drug cost per claimant |
$10,000 to $25,000 |
68 |
73 |
84 |
86 |
90 |
98 |
$25,000 to $50,000 |
57 |
60 |
62 |
68 |
71 |
77 |
|
$50,000 to $100,000 |
37 |
41 |
48 |
52 |
57 |
58 |
|
Over $100,000 |
28 |
32 |
35 |
41 |
46 |
46 |
|
Share of claimants |
0.90% |
1.00% |
1.20% |
1.30% |
1.30% |
1.50% |
|
Share of prescriptions |
0.60% |
0.60% |
0.70% |
0.70% |
0.70% |
0.80% |
|
3. Price and substitution effects
Cost-mitigating measures such as generic and biosimilar substitutions and price reductions had downward effects ranging between -1% and -4%
- Shifts from brand-name to generic or biosimilar drugs pulled costs down by -2.0%, while price changes contributed minimally (0.5%) (Figure 1).
- Biosimilars offered nearly 1/3 of the savings from substitution in 2023 (0.6% of 2.0%).
- By 2023, private drug plans covered 14 biologics with available biosimilars. The cost share for biosimilars within this group increased to 35% (Figure 3).
- As biosimilar uptake increases, greater savings can be expected in the coming years.
Figure 3. Drug cost share of biologics with available biosimilars*, private drug plans, 2018 to 2023

Figure - Text version
Biologic medicines: adalimumab, bevacizumab, enoxaparin, etanercept, filgrastim, infliximab, insulin aspart, insulin glargine, insulin lispro, pegfilgrastim, ranibizumab, rituximab, teriparatide, trastuzumab.
| Drug cost share by year | Originator biologics | Biosimilars |
|---|---|---|
2018 |
97% |
3% |
2019 |
94% |
6% |
2020 |
92% |
8% |
2021 |
90% |
10% |
2022 |
76% |
24% |
2023 |
65% |
35% |
| 2018 | 2019 | 2020 | 2021 | 2022 | 2023 | |
|---|---|---|---|---|---|---|
Share of total drug costs |
13.5% |
13.4% |
13.3% |
12.9% |
11.1% |
9.7% |
Number of biologic medicines with biosimilars available |
4 |
6 |
11 |
13 |
13 |
14 |
*Includes the same set of 14 biologics that had at least one biosimilar available in private drug plans by 2023. Biosimilars may have entered at different times in the study period.
4. Demographic and volume effects
The impact of demographics and associated claim changes fluctuated between -3% and 9%
- A notable rebound in claimants post-pandemic drove an 8.9% demographic push effect in 2023, while a slower growth in drug use per claimant led to a -1.9% pull-down effect (Figure 1).
- From 2018 to 2023, the average annual drug cost per claimant increased in all demographic groups (Figure 4).
- In 2023, working-age claimants (25–64) made up 66% of the private plan population but accounted for 77% of drug costs, reflecting a higher annual treatment cost per claimant.
- Males consistently incurred higher treatment costs than females within each age group, but more females made claims. This can be partially attributed to oral contraceptive claims.
- Over time, the share of claimants aged 65 and older increased slightly, indicating a gradual shift toward an aging demographic composition.
Figure 4. Average annual drug cost per claimant and corresponding demographic share, private drug plans, 2018 to 2023

Figure - Text version
| Average annual drug cost per claimant | Female under 25 | Female 25 to 64 | Female 65 and over | Male under 25 | Male 25 to 64 | Male 65 and over |
|---|---|---|---|---|---|---|
2018 |
$275 |
$709 |
$596 |
$323 |
$769 |
$688 |
2019 |
$286 |
$736 |
$627 |
$336 |
$799 |
$733 |
2020 |
$350 |
$820 |
$643 |
$420 |
$905 |
$750 |
2021 |
$381 |
$846 |
$691 |
$462 |
$932 |
$824 |
2022 |
$364 |
$884 |
$712 |
$422 |
$949 |
$845 |
2023 |
$391 |
$945 |
$740 |
$452 |
$974 |
$858 |
| Demographic share of claimants | Female under 25 | Female 25 to 64 | Female 65 and over | Male under 25 | Male 25 to 64 | Male 65 and over |
|---|---|---|---|---|---|---|
2018 |
11.2% |
39.4% |
4.7% |
9.1% |
30.8% |
4.7% |
2019 |
13.1% |
37.6% |
4.5% |
10.7% |
29.5% |
4.6% |
2020 |
12.3% |
38.3% |
5.0% |
9.8% |
29.6% |
5.1% |
2021 |
11.4% |
38.6% |
5.6% |
9.2% |
29.4% |
5.7% |
2022 |
12.3% |
37.2% |
5.7% |
10.5% |
28.7% |
5.7% |
2023 |
11.8% |
37.0% |
6.1% |
10.2% |
28.8% |
6.2% |
Limitations
The drug costs reported include associated markups and do not reflect any rebates, price discounts or confidential agreements.
Disclaimer
Although based in part on data under license by IQVIA™, the statements, findings, conclusions, views and opinions expressed in this report are exclusively those of the PMPRB.