
Navigating the market landscape for rare disease drugs in Canada
Jihong Yang, Tuhin Rahman and Shirin Rizzardo
Presented at the 29th Annual CAPT conference, September 22-23, 2025 and at the CDA Symposium 2026, April 22–24, 2026
Objective
The emergence of a growing number of expensive drugs for rare diseases (EDRDs) presents new treatment possibilities while raising concerns around affordability and access. This study analyzes EDRDs launched in Canada over the past two decades, using quantitative data to evaluate EDRD trends in drug approvals, drug prices and sales revenues in Canada.
Approach
Drawing on sales and price information from IQVIA MIDAS® and treatment cost information from Canada’s Drug Agency, this study examines 159 EDRDs approved in Canada between 2005 and 2024. The analysis explores approval trends and market growth over past decades, compares treatment costs between cancer and non-cancer EDRDs, and compares 2024 Canadian list prices with those in PMPRB11 countries: Australia, Belgium, France, Germany, Italy, Japan, the Netherlands, Norway, Spain, Sweden, and the UK.
Definition of EDRDs: For the study, these are drugs with at least one orphan (rare disease) designation by the US Food and Drug Administration or the Europe Medicines Agency, and an estimated cost over CA $100,000 per year for non-cancer drugs, or over CA $7,500 per 28 days for cancer/oncology drugs.
Results
1. How has the number of approved EDRDs changed over time in Canada?
- The number of EDRDs approved annually in Canada has increased significantly since 2005 (Figure 1).
- 2005–2008: Approvals were low and relatively flat (1–2 approvals/year).
- 2009–2014: Moderate but steady growth, reaching 6 approvals in 2014.
- 2015–2023: Marked acceleration in approvals, with consistently 10+ EDRDs per year and a peak of 17 in 2023, while 2024 approvals fell to 10, possibly reflecting a temporary dip.
- Overall, the trend demonstrates a significant rise in regulatory approvals for EDRDs in the past decade.
Figure 1. Number of expensive drugs for rare diseases (EDRDs) approved in Canada by Notice of Compliance (NOC) year, 2005–2024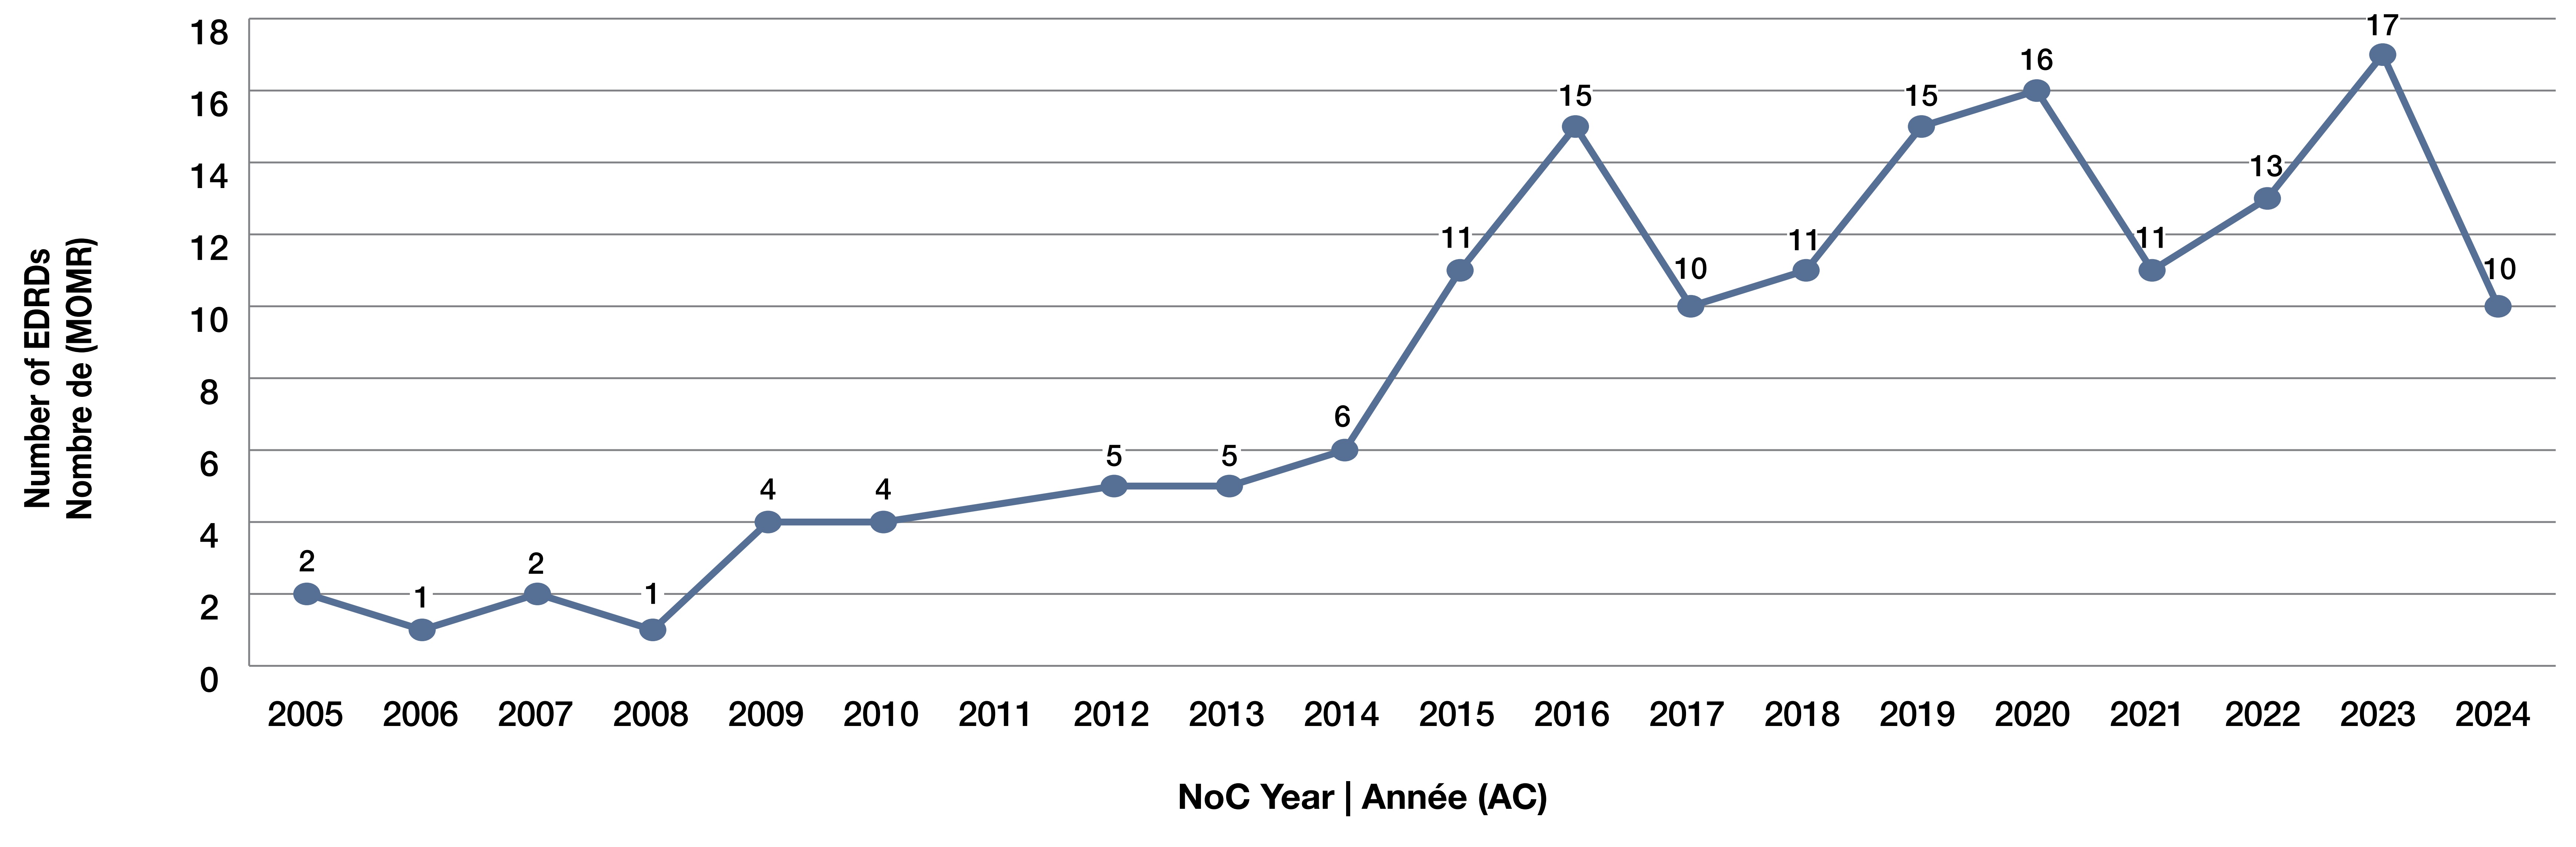
Figure - Text version
| Notice of Compliance year | Number of expensive drugs for rare diseases |
|---|---|
2005 |
2 |
2006 |
1 |
2007 |
2 |
2008 |
1 |
2009 |
4 |
2010 |
4 |
2012 |
5 |
2013 |
5 |
2014 |
6 |
2015 |
11 |
2016 |
15 |
2017 |
10 |
2018 |
11 |
2019 |
15 |
2020 |
16 |
2021 |
11 |
2022 |
13 |
2023 |
17 |
2024 |
10 |
Source: Health Canada Notice of Compliance (NOC) Database; Health Canada Drug Product Database; Canada’s Drug Agency.
2. How has the market share of EDRDs changed in the Canadian branded pharmaceutical market over time?
- From 2006 to 2016, market share of EDRDs in the Canadian branded pharmaceutical sector remained low and grew slowly, from 0.4% in 2006 to 3.8% in 2016 (Figure 2).
- Rapid growth: The market share of EDRDs in the Canadian branded pharmaceutical sector has increased steadily, with an especially sharp growth since 2017.
- Sustained acceleration (2018–2024): From 2018 onward, EDRDs’ market share climbed steeply each year, reaching 28.0% by 2024 up from just 0.4% less than two decades ago.
- From 2006 to 2024, sales of EDRDs grew at a compound annual growth rate (CAGR) of 32.4%, far outpacing the 3.9% growth for the total branded medicines.
Figure 2. Market share of expensive drugs for rare diseases (EDRDs) in the Canadian branded pharmaceutical market, 2006–2024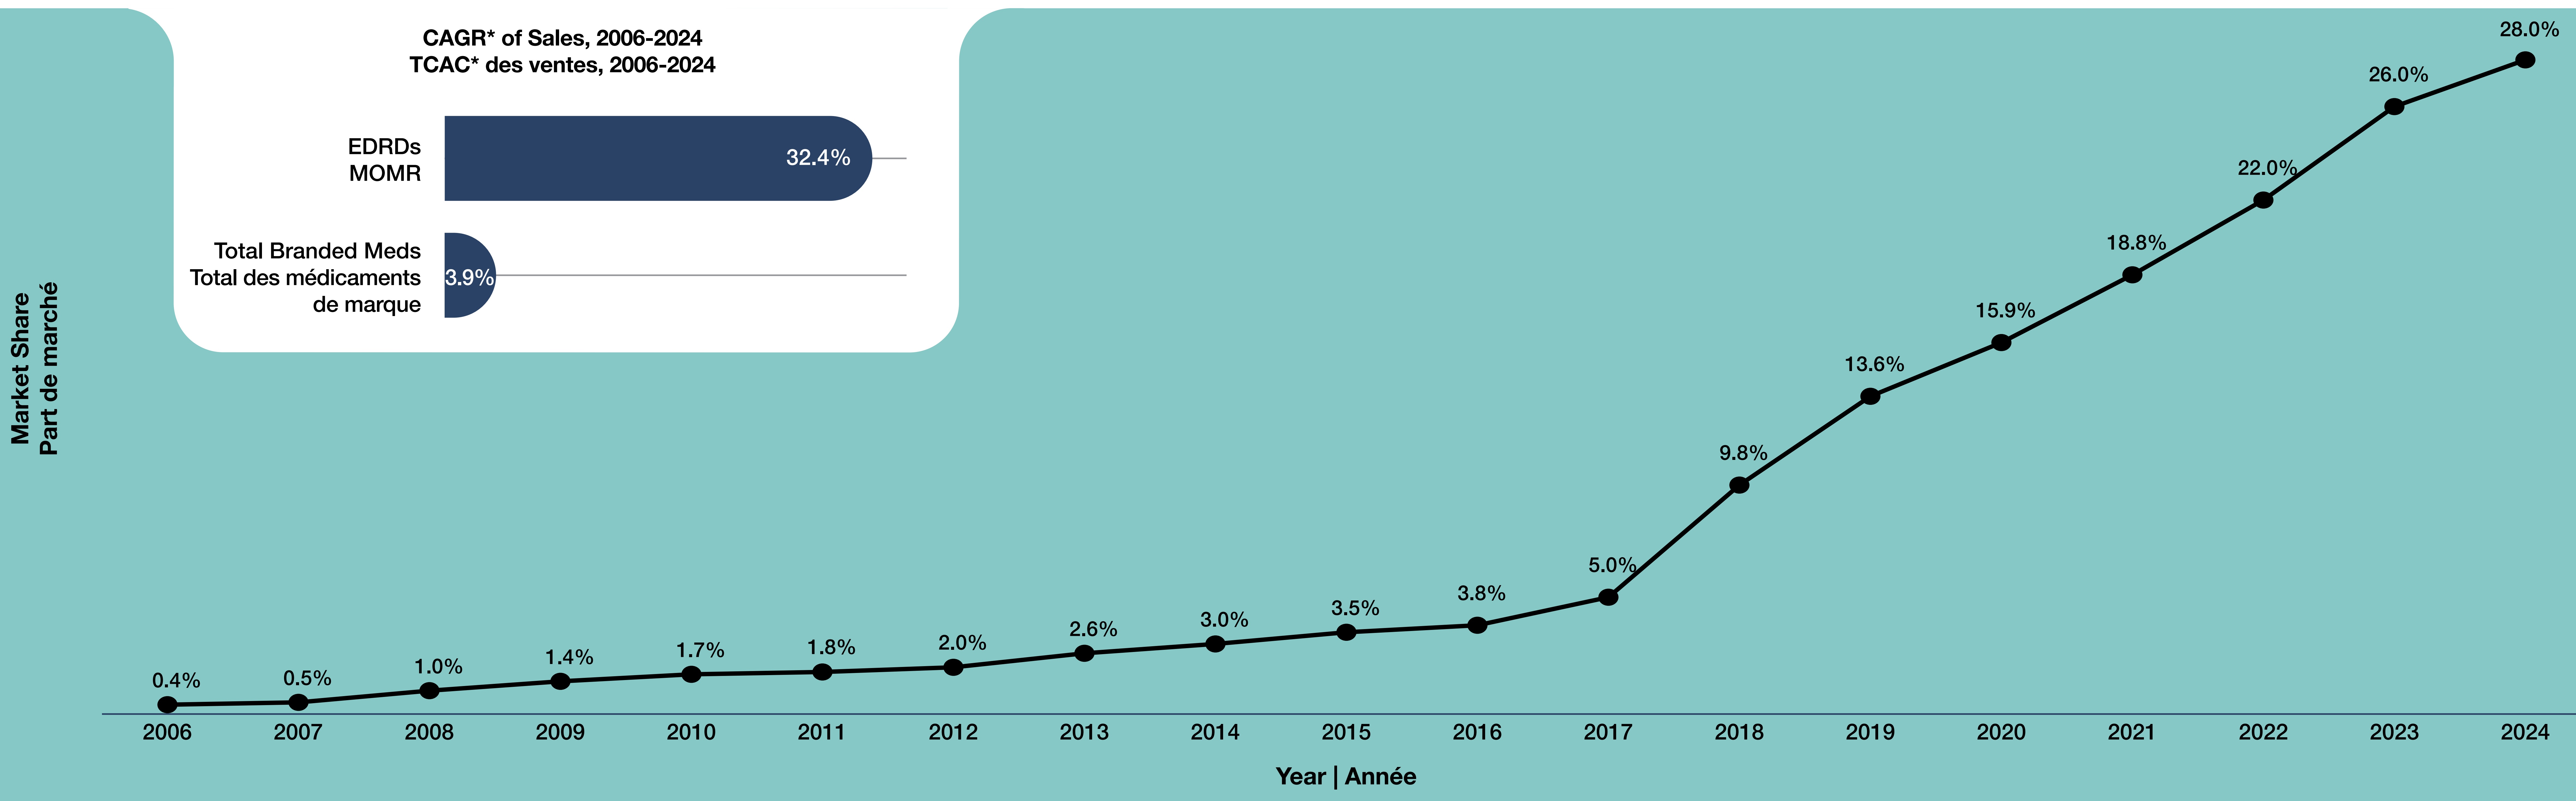
Figure - Text version
| Year | Market share |
|---|---|
2006 |
0.4% |
2007 |
0.5% |
2008 |
1.0% |
2009 |
1.4% |
2010 |
1.7% |
2011 |
1.8% |
2012 |
2.0% |
2013 |
2.6% |
2014 |
3.0% |
2015 |
3.5% |
2016 |
3.8% |
2017 |
5.0% |
2018 |
9.8% |
2019 |
13.6% |
2020 |
15.9% |
2021 |
18.8% |
2022 |
22.0% |
2023 |
26.0% |
2024 |
28.0% |
| Compound annual growth rate | |
|---|---|
Expensive drugs for rare diseases |
32.4% |
Total branded drugs |
3.9% |
Note: CAGR=Compound Annual Growth Rate.
Source: IQVIA Midas®.
3. How are EDRDs distributed by annual treatment cost, and how does this vary between cancer and non-cancer drugs?
- Of the 159 EDRDs approved in Canada over the past two decades, 88 (55%) are cancer drugs and 71 (45%) are non-cancer drugs (Figure 3).
- Cancer EDRDs skew toward lower-cost categories — 56% have annual treatment costs below $200K, compared to only 20% for non-cancer EDRDs.
- Non-cancer EDRDs are more likely to be in the highest-cost category — 23% exceed $1M annually, versus just 1% of cancer EDRDs.
- Mid-range costs ($200K–$1M) account for a large share in both groups — 43% of cancer EDRDs and 58% of non-cancer EDRDs fall in this range.
Figure 3. Share of expensive drugs for rare diseases (EDRDs) by annual treatment cost: cancer vs. non-cancer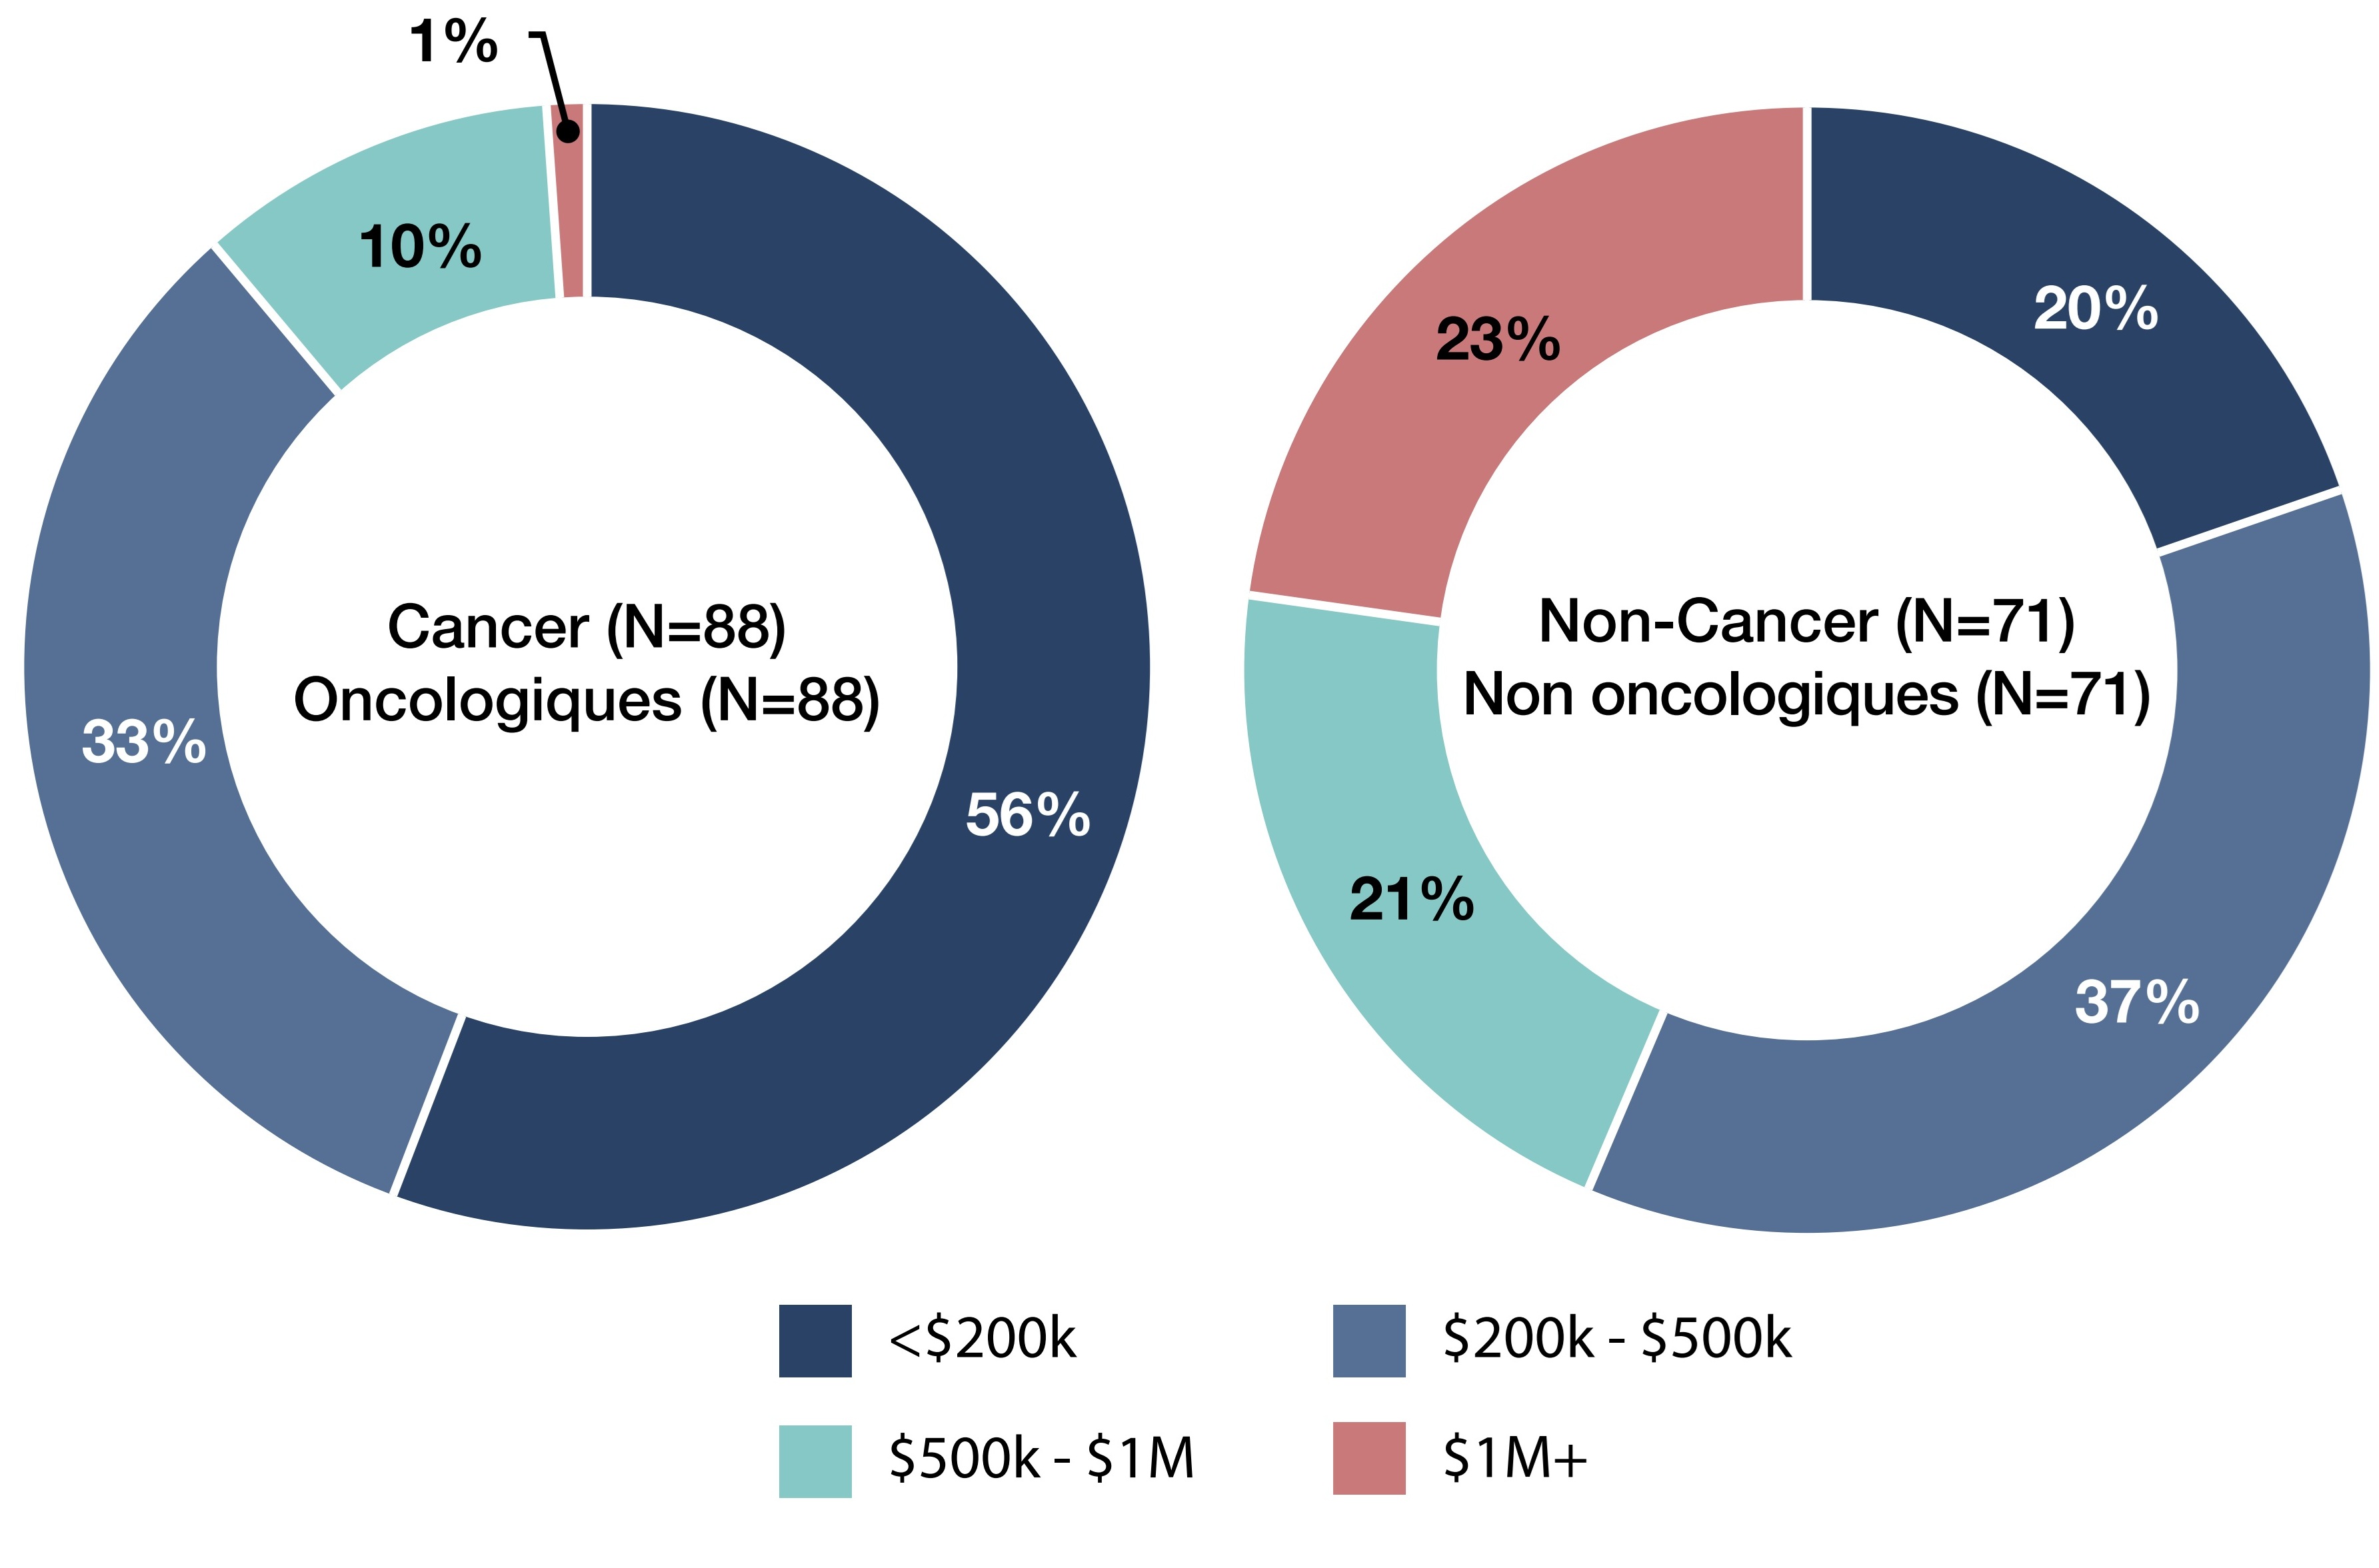
Figure - Text version
Cancer
| Treatment cost bands | Share |
|---|---|
<$200K |
56% |
$200K-$500K |
33% |
$500K - $1M |
10% |
$1M+ |
1% |
Non-cancer
| Treatment cost bands | Share |
|---|---|
<$200K |
20% |
$200K-$500K |
37% |
$500K - $1M |
21% |
$1M+ |
23% |
Source: Health Canada Notice of Compliance (NOC) Database; Health Canada Drug Product Database; Canada’s Drug Agency.
4. How did list prices for EDRDs in Canada compare with those in the 11 comparator countries used by the Patented Medicine Prices Review Board (PMPRB11) in 2024?
- In 2024, Canadian prices for EDRDs were the third highest compared to the PMPRB11 countries, with Spanish and Italian prices above Canadian prices by 15% and 3%, respectively (Figure 4).
- Highest international prices (HIP) were 19% above Canadian prices while median international prices (MIP) were 15% lower than the Canadian prices for EDRDs.
- Most countries had lower prices than Canada, with Japan (-40%), Australia (-20%), and France (-19%) showing the largest gaps, while Germany, Norway, Sweden, and the Netherlands were all about 17–18% lower.
Figure 4. Foreign-to-Canadian bilateral list price comparisons in 2024, expensive drugs for rare diseases, PMPRB11 countries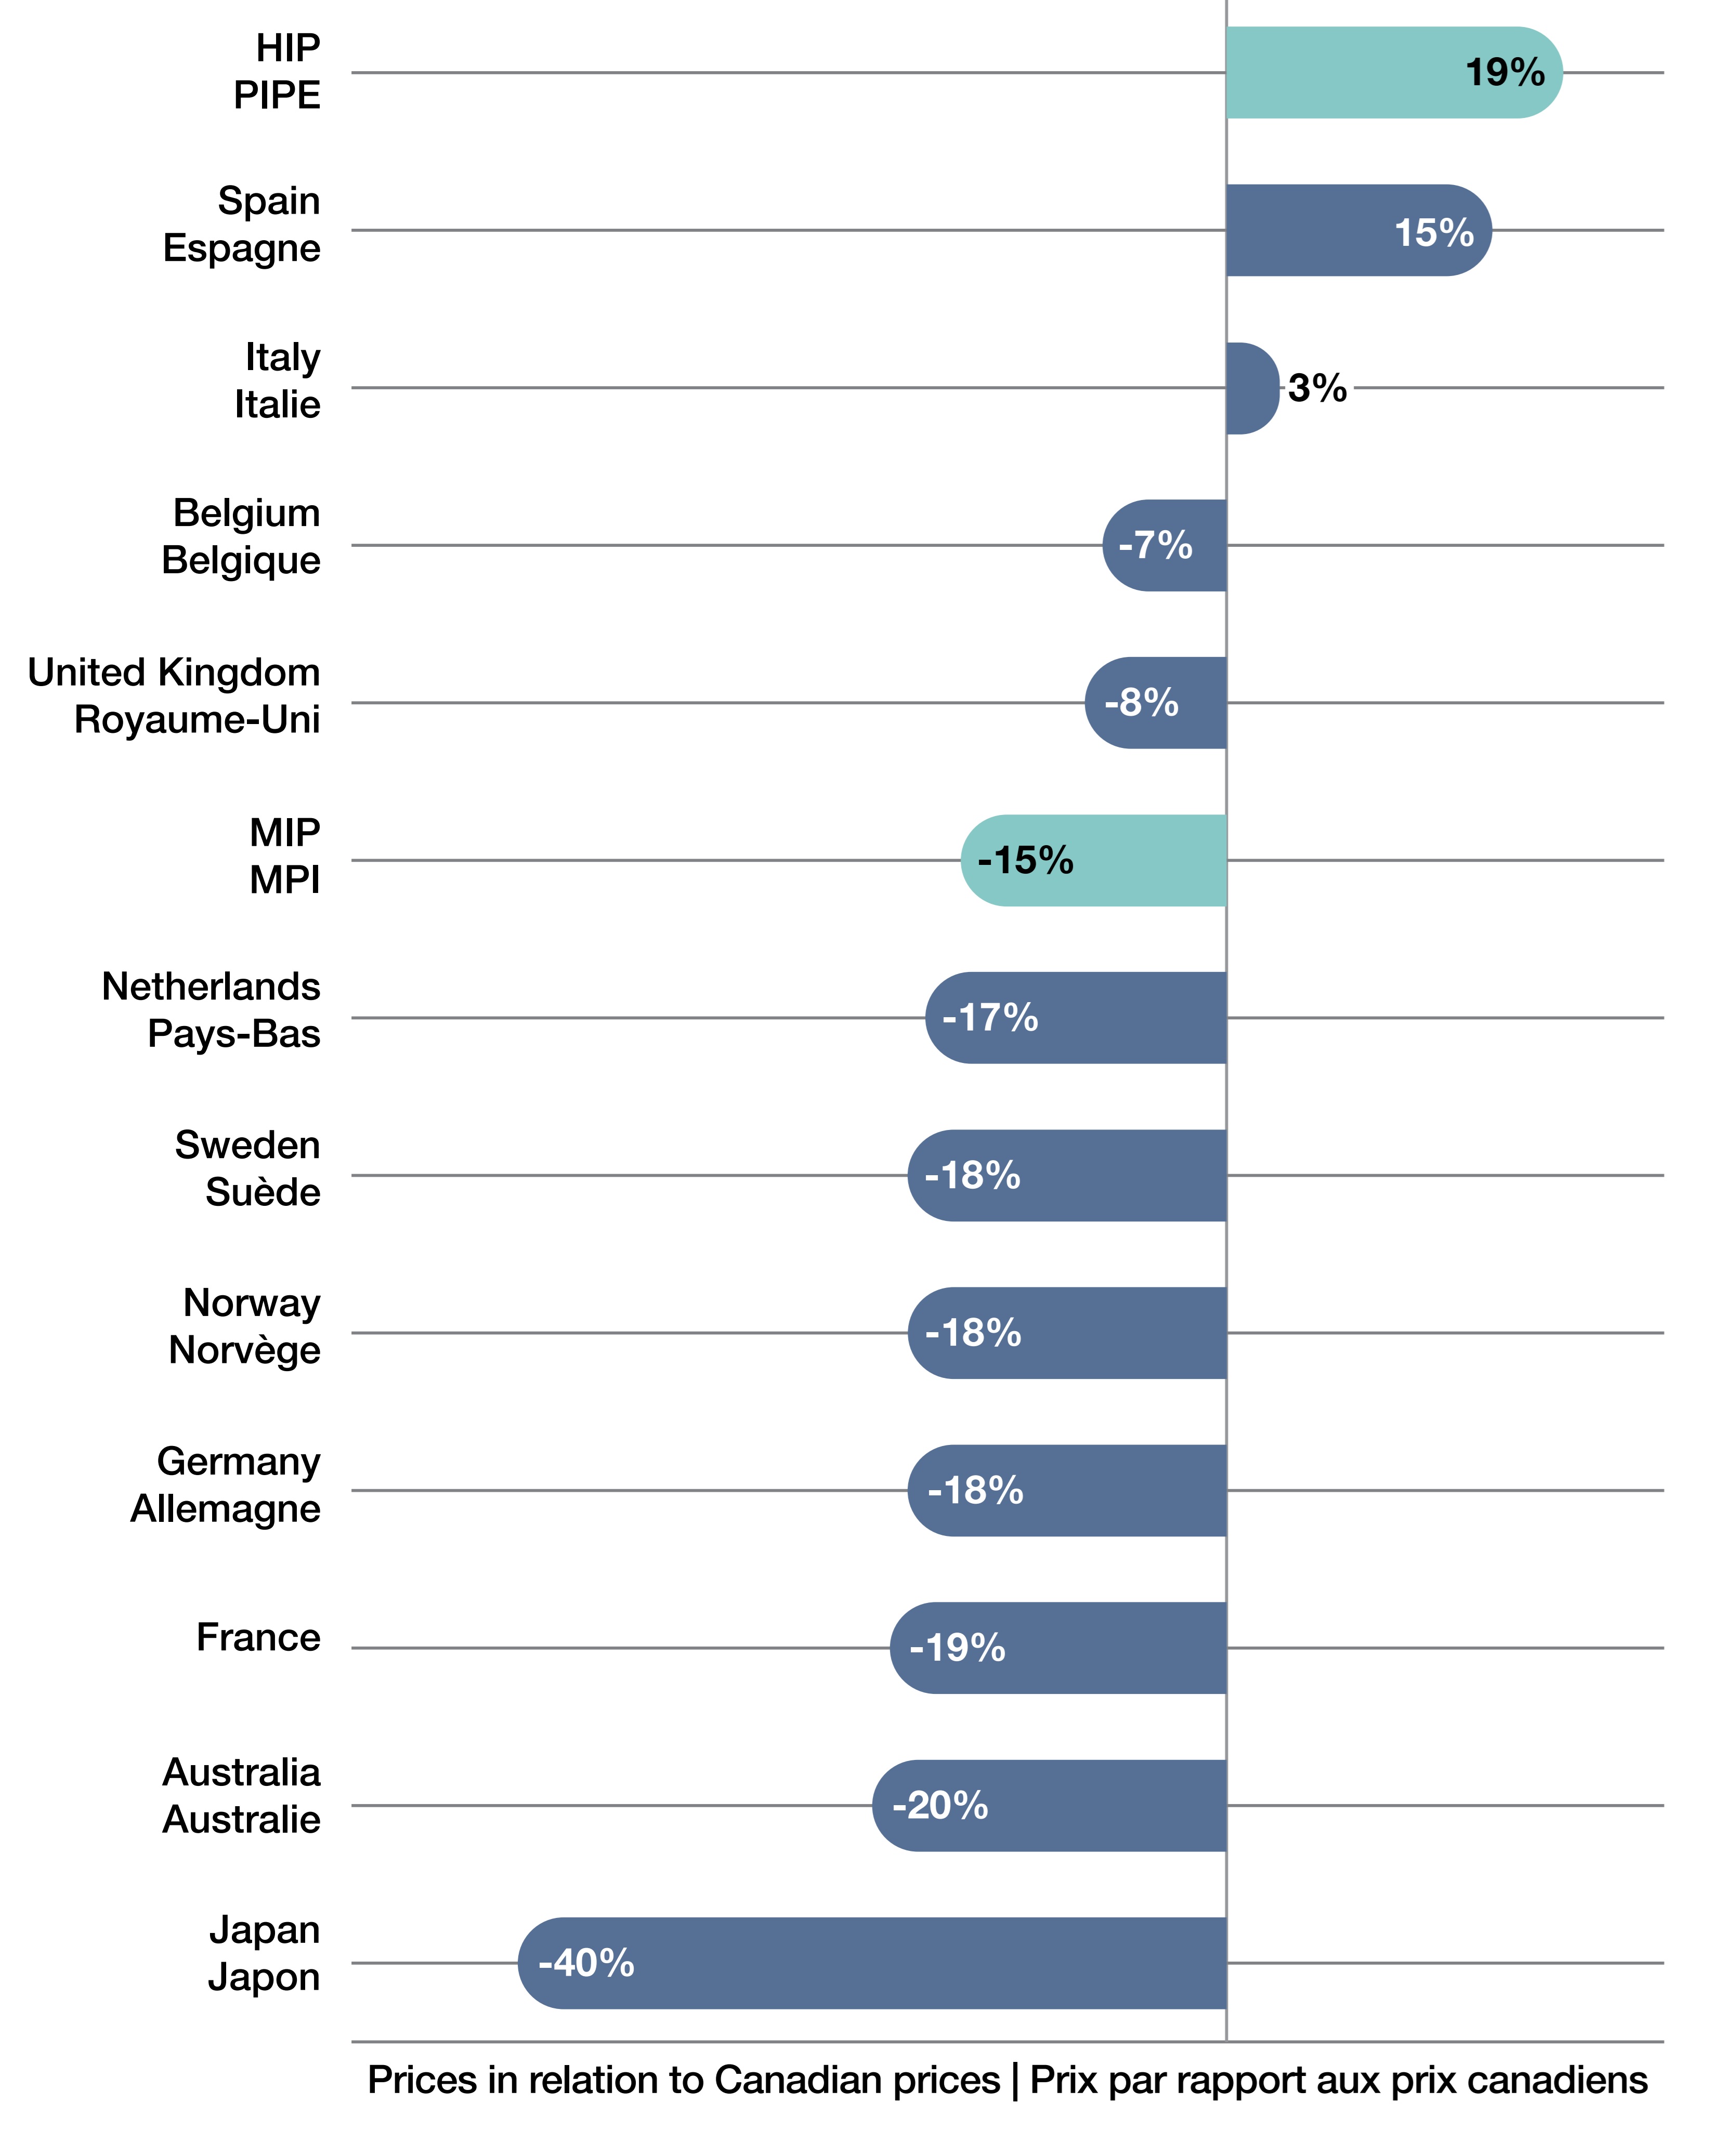
Figure - Text version
| Foreign-to-Canadian price ratio | |
|---|---|
Highest International Price |
19% |
Spain |
15% |
Italy |
3% |
Belgium |
-7% |
United Kingdom |
-8% |
Median international price |
-15% |
Netherlands |
-17% |
Sweden |
-18% |
Norway |
-18% |
Germany |
-18% |
France |
-19% |
Australia |
-20% |
Japan |
-40% |
Note: MIP = median international price; HIP = highest international price.
Source: IQVIA Midas®.
Conclusion
The study highlights the economic reality of the growing number and rising costs of expensive drugs for rare diseases (EDRDs) in Canada. The increase in approvals, expanding market presence, and relatively higher prices compared to other countries underscore the need for effective policies that support individuals with rare diseases while ensuring the sustainability of the health care system.
Limitations
The basket of drugs used for foreign-to-Canadian bilateral price comparisons differed by country. Nominal dollars were used to identify EDRDs approved in all years.
Disclaimer
Although based in part on data obtained under license from the MIDAS® database proprietary to IQVIA Solutions Canada Inc. and/or its affiliates ("IQVIA"), the statements, findings, conclusions, views, and opinions expressed in this presentation are exclusively those of the PMPRB and are not attributable to IQVIA.