
Cost-effectiveness of the top 100 drugs by public spending in Canada, 2015–2021: a repeated cross-sectional study
Presented at ISPOR 2024, May 5-8, 2024 and at CAHSPR 2024, May 14-16, 2024
Étienne Gaudette, Shirin Rizzardo, Yvonne Zhang, Mina Tadrous, and Kevin R. Pothier
Introduction
Objective: To assess the distribution and spending by cost-effectiveness category amongst those drugs with the highest public spending levels in Canada.
Approach: The share of public pharmaceutical spending allocated to cost-effective and cost-ineffective drugs was estimated using Canadian Agency for Drugs and Technologies in Health (CADTH) cost-effectiveness assessments and Canadian public plan spending data from six provinces.
Data
Public drug plans data: Spending data originated from the Canadian Institute for Health Information’s National Prescription Drug Utilization Information System (NPDUIS). The provincial public drug plans of Manitoba, Ontario, New Brunswick, Nova Scotia, Prince Edward Island, and Newfoundland were included in the analysis because they funded take-home cancer medications.
Main outcomes and measures: The key outcomes were the cost-effectiveness assessments for top-100 brand-name outpatient drugs by gross public plan spending in any fiscal year (i.e., April to March) between 2015 and 2021 and the gross public plan spending by cost-effectiveness category. Drug cost-effectiveness was assigned based on CADTH review type and finding within three categories:
| Review type and finding | Cost-effectiveness categorization |
|---|---|
Cost-minimization analysis |
|
Cost-decreasing |
Cost-effective |
Cost-increasing |
Cost-ineffective |
Cost-decreasing relative to some comparators and cost-increasing relative to others |
Mixed/unclear |
Inconclusive |
Mixed/unclear |
Incremental cost-utility analysis |
|
Dominant |
Cost-effective |
ICUR < 2021 $Can 50,000 |
Cost-effective |
ICUR > 2021 $Can 50,000 |
Cost-ineffective |
Dominated |
Cost-ineffective |
Inconclusive |
Mixed/unclear |
Other |
Mixed/unclear |
No review identified |
N/A |
ICUR: incremental cost-utility ratio.
Results
There was a marked increase of top-100 drugs with a cost-ineffective assessment
- Cost-effective drugs in the top-100 grew from 18 in 2015 to 24 in 2021, after peaking at 28 in 2019. Cost-effective drugs that exited the top-100 ranking included 4 indicated for the treatment of hepatitis C and human immunodeficiency viruses.
- Cost ineffective drugs grew from 29 in 2015 to 41 in 2021 and included new therapies for a variety of indications (e.g., cystic fibrosis and psoriasis).
- These increases were accompanied by a decline of primarily older drugs without an assessment or with an unclear assessment from the top-100.
Figure 1. Distribution of 100 highest-spending brand name drugs by cost-effectiveness category, 2015 to 2021
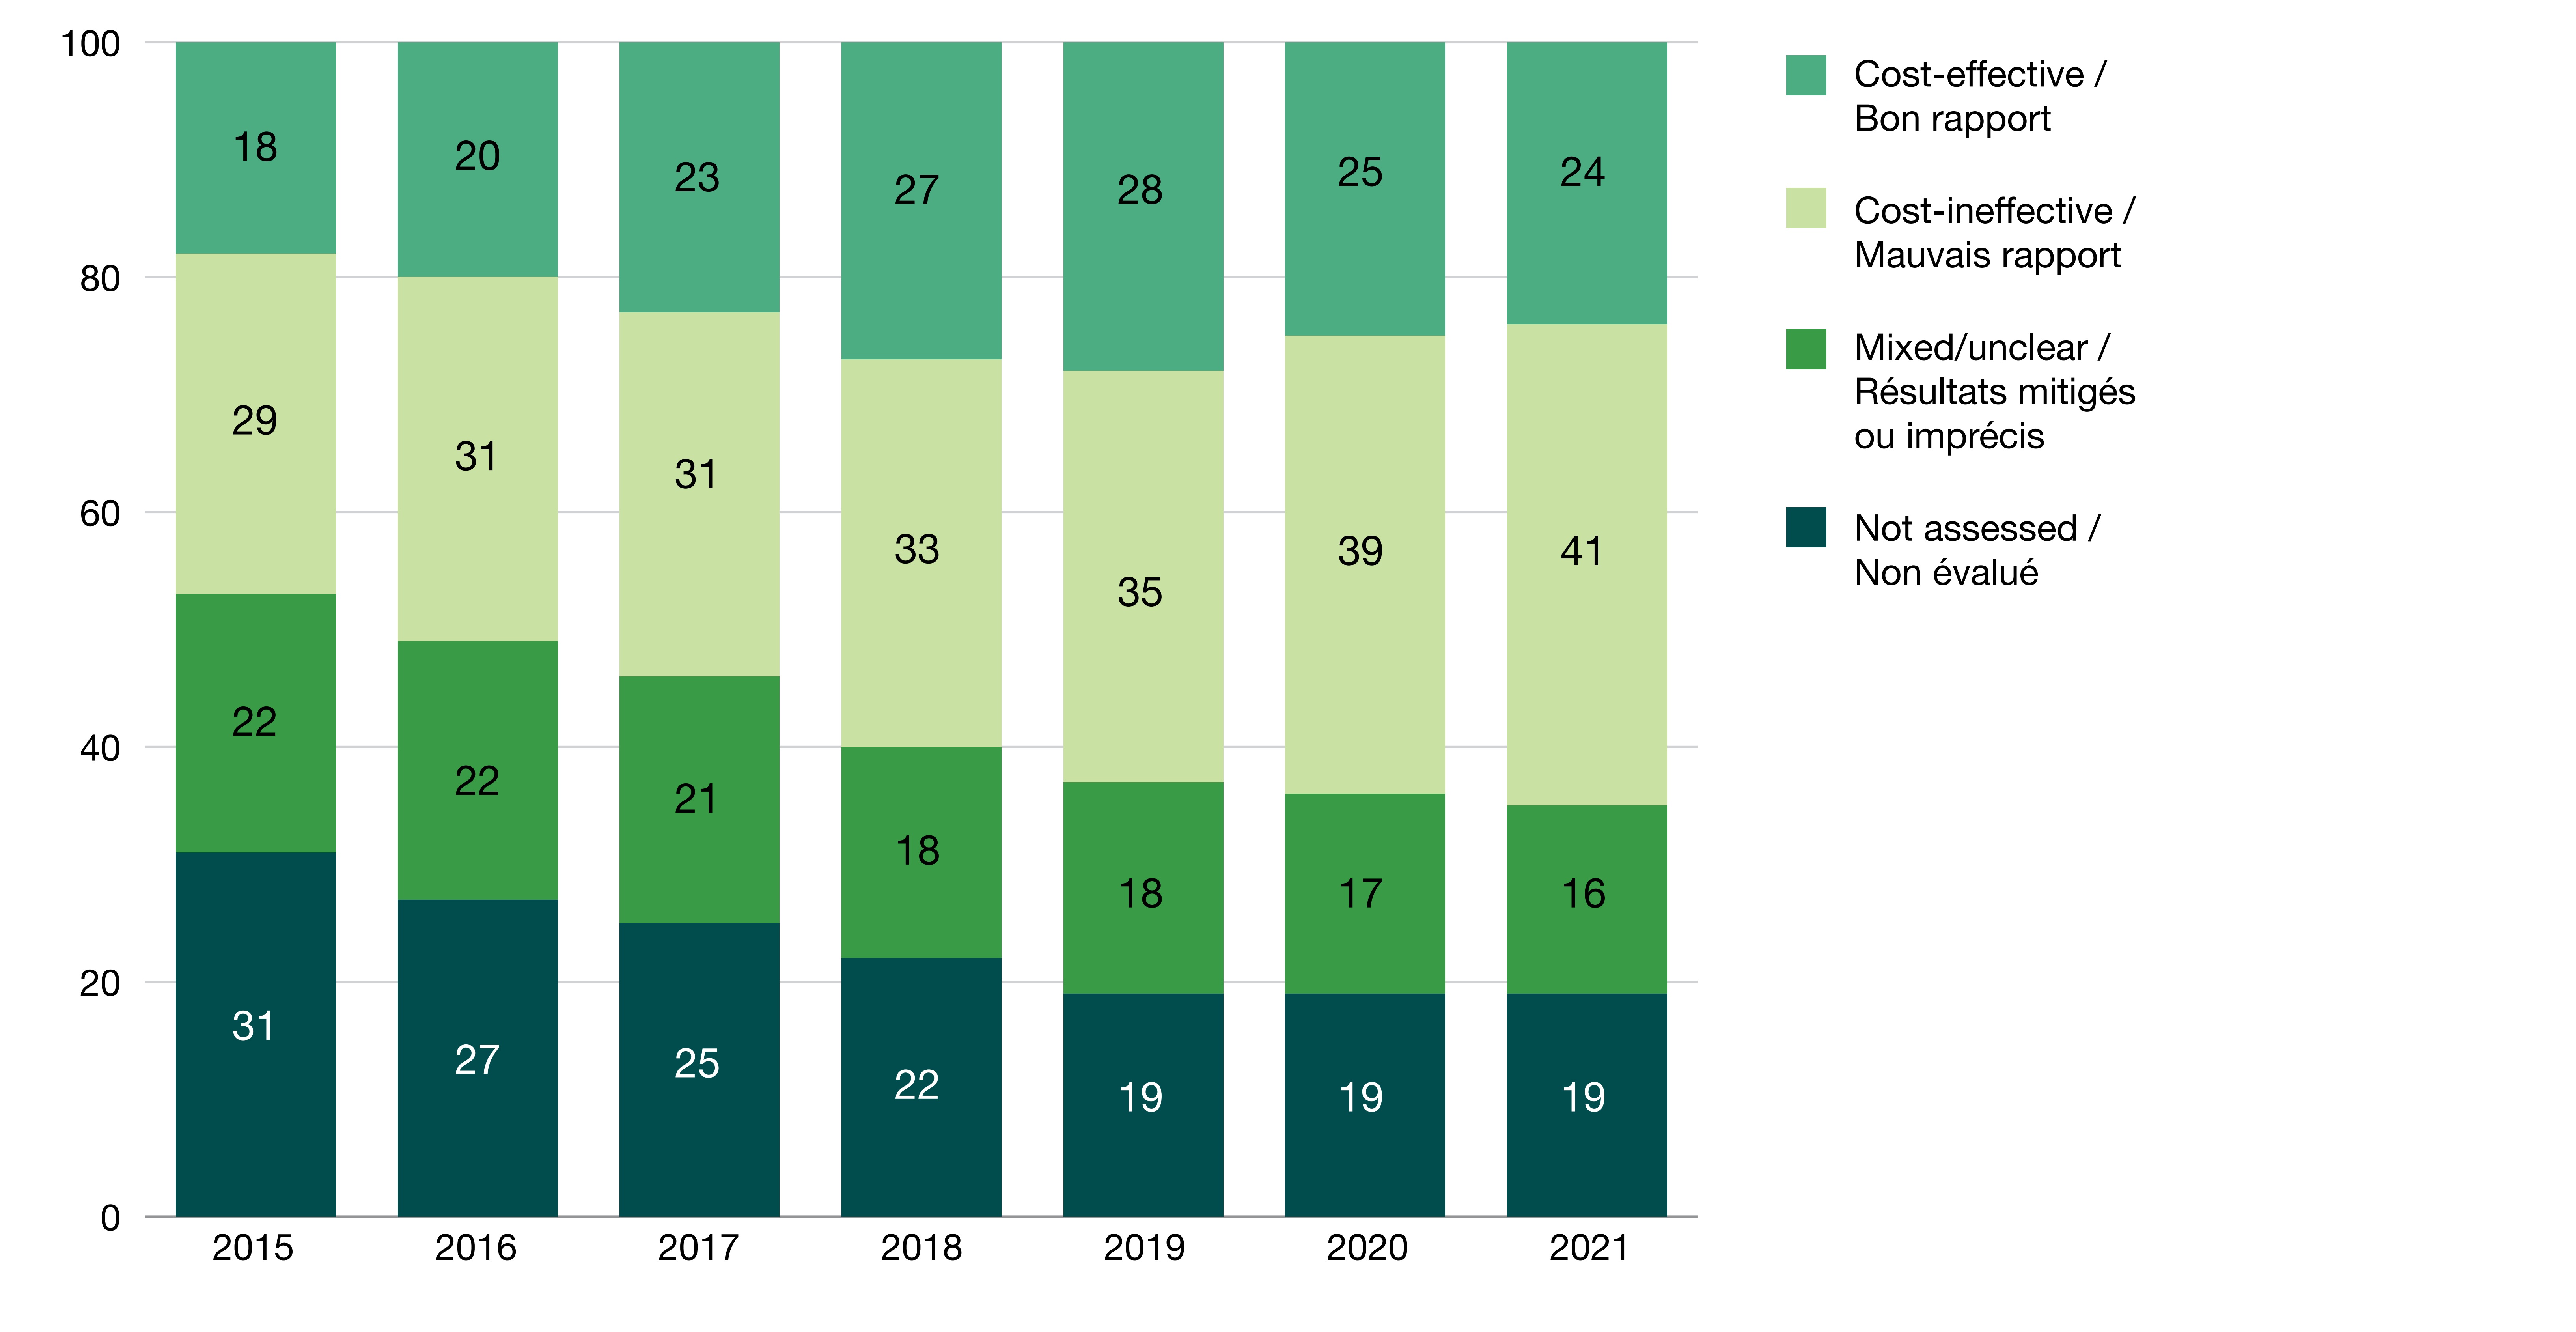
Figure - Text version
| 2015 | 2016 | 2017 | 2018 | 2019 | 2020 | 2021 | |
|---|---|---|---|---|---|---|---|
| Not assessed | 31 | 27 | 25 | 22 | 19 | 19 | 19 |
| Mixed/unclear | 22 | 22 | 21 | 18 | 18 | 17 | 16 |
| Cost-ineffective | 29 | 31 | 31 | 33 | 35 | 39 | 41 |
| Cost-effective | 18 | 20 | 23 | 27 | 28 | 25 | 24 |
Sources: Canadian Institute of Health Information (CIHI) data and Canadian Agency for Drugs and Technologies in Health (CADTH) reimbursement reviews.
The share of spending on cost-ineffective drugs grew by 50% from 2015 to 2021
- Overall, spending grew 68% faster for cost-ineffective drugs than spending for cost-effective drugs (15.8% vs. 9.4% compound annual growth rate over the period)
- As a result, the share of spending on cost-ineffective drugs grew from 30% in 2015 to 45% in 2021, while spending on cost-effective drugs was mostly stable at 40%-46% (Figure 2).
- These trends were accompanied by a decline in the proportion of spending allocated to drugs with a mixed or unclear assessment, from 27% to 15%.
Figure 2. Spending on 100 highest-spending brand name drugs by cost-effectiveness category, 2015 to 2021
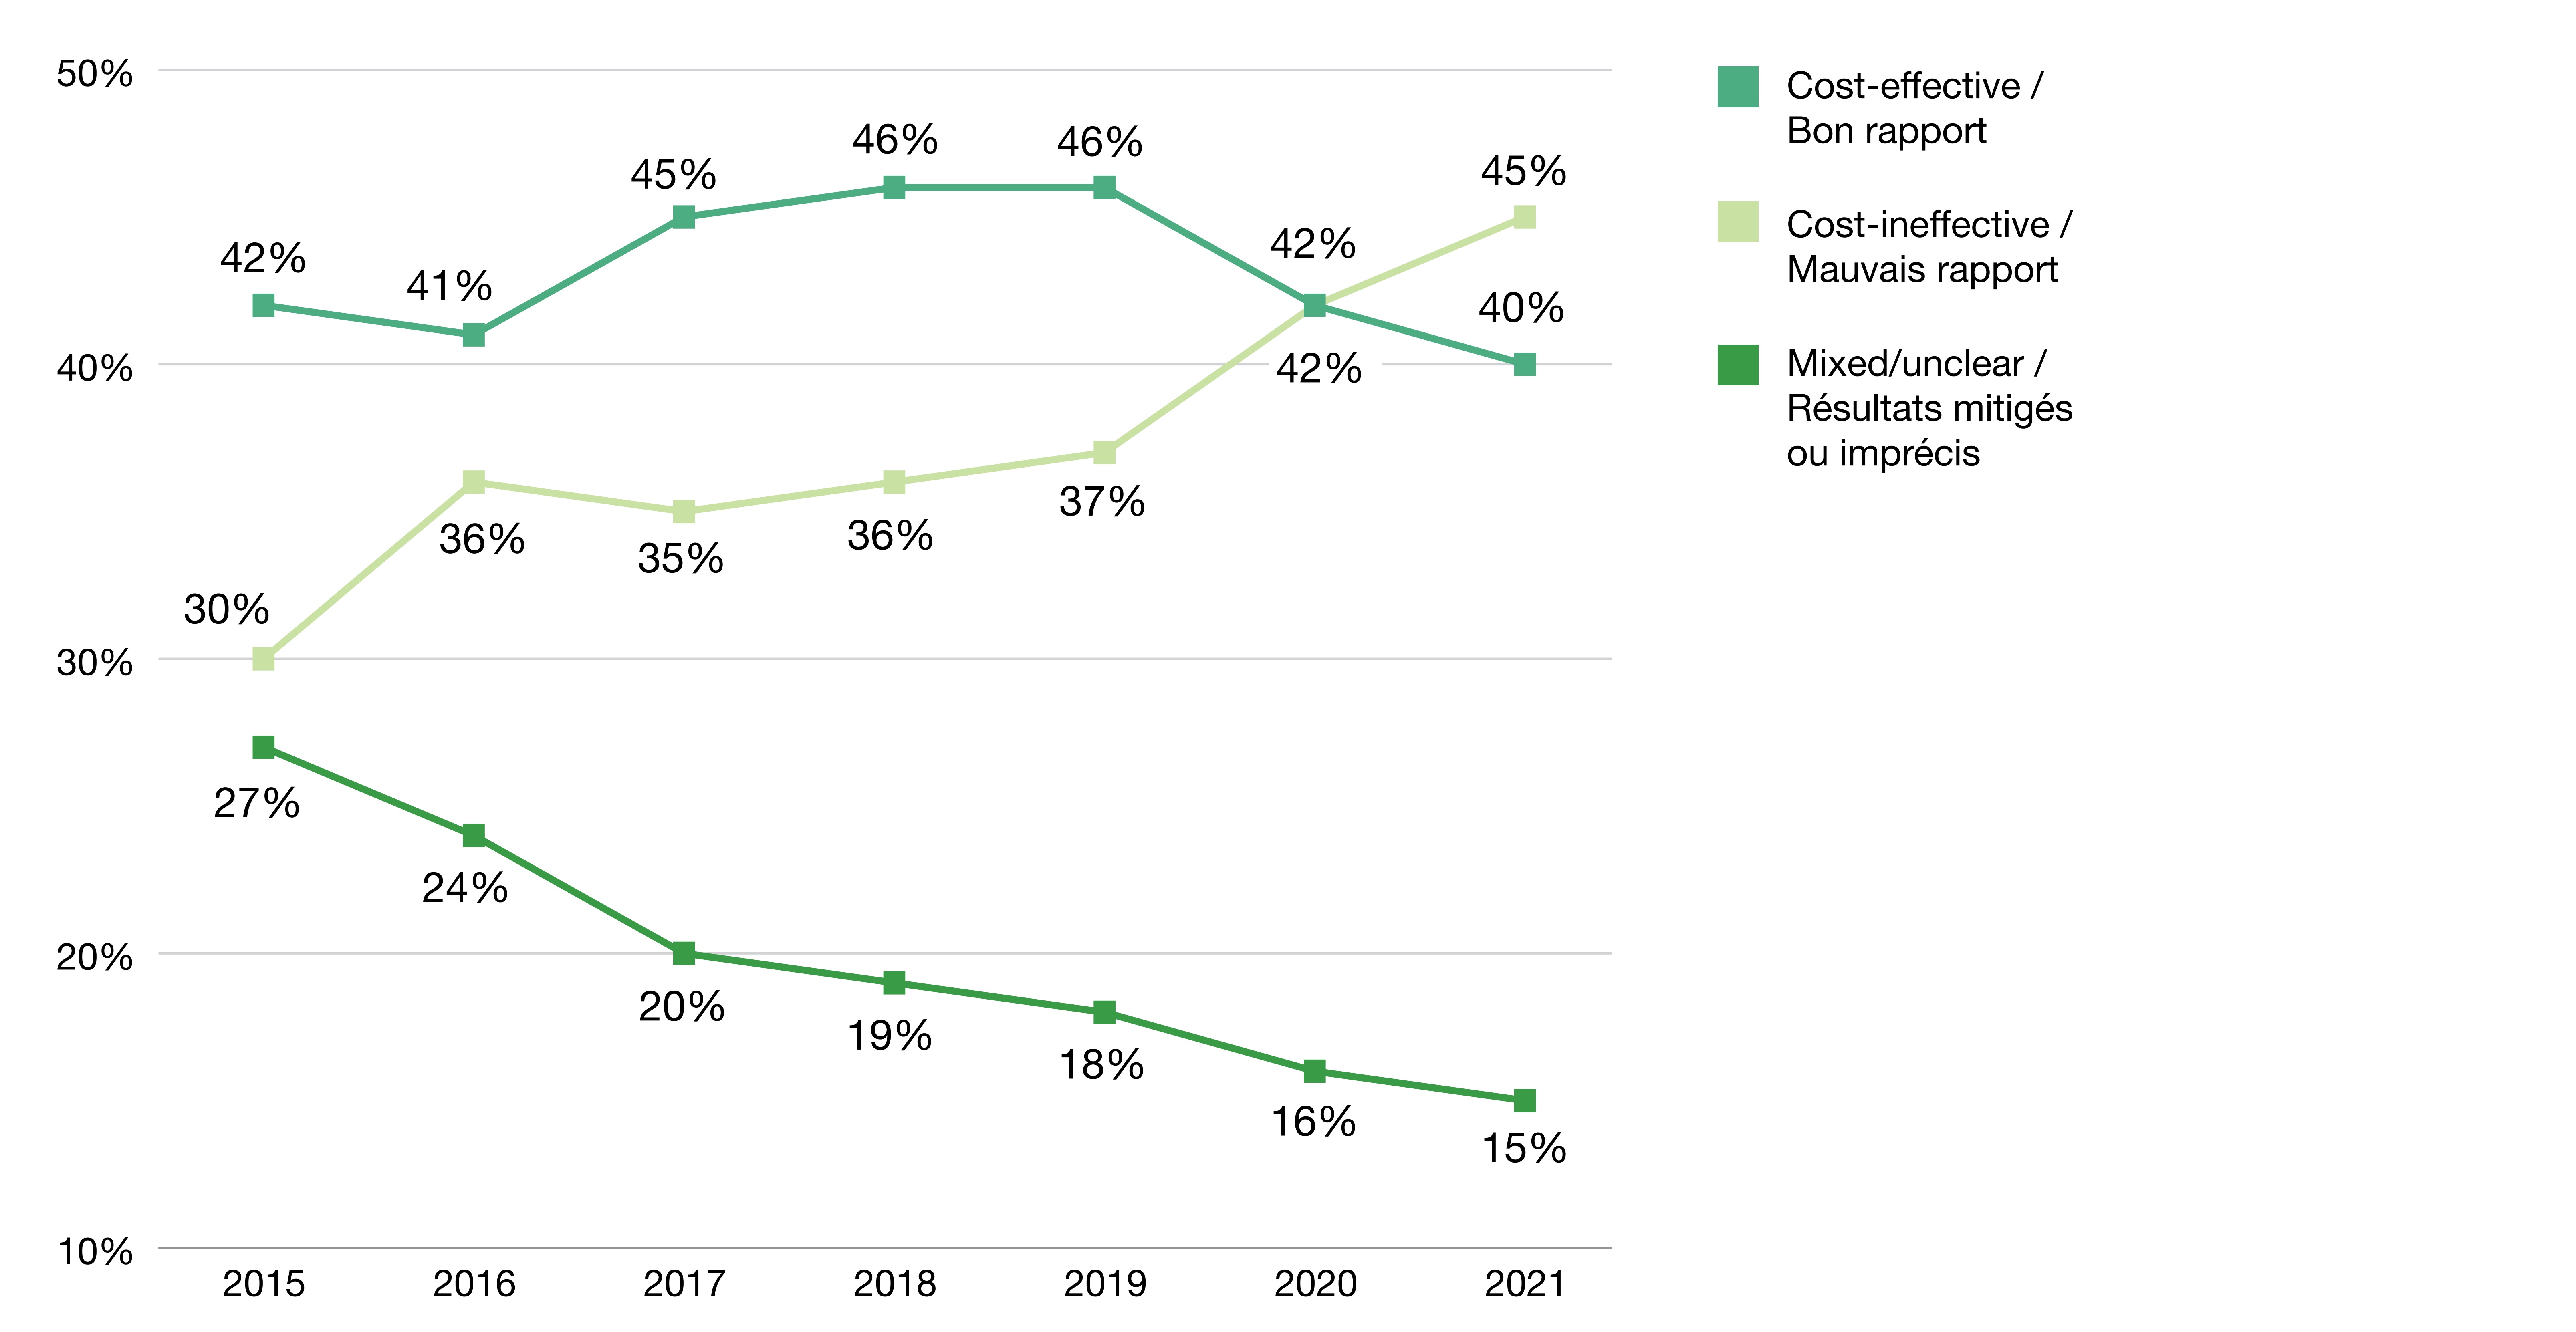
Figure - Text version
| 2015 | 2016 | 2017 | 2018 | 2019 | 2020 | 2021 | |
|---|---|---|---|---|---|---|---|
| Cost-effective | 42% | 41% | 45% | 46% | 46% | 42% | 40% |
| Cost-ineffective | 30% | 36% | 35% | 36% | 37% | 42% | 45% |
| Mixed/unclear | 27% | 24% | 20% | 19% | 18% | 16% | 15% |
Sources: Canadian Institute of Health Information (CIHI) data and Canadian Agency for Drugs and Technologies in Health (CADTH) reimbursement reviews.
Note: This figure excludes the drugs which have not been assessed by CADTH.
Conclusions
A significant and growing share of public drug spending in Canada was allocated to cost-ineffective drugs, which either increased costs relative to equivalent existing treatments or provided small added health benefits relative to their incremental cost. While some cost-ineffective drugs may provide clinically desirable treatment options to patients, allocating large budgets to such treatments prevents spending with greater health impact elsewhere in the healthcare system and could restrain the capacity to pay for truly groundbreaking pharmaceutical innovation in the future.
Limitations
As with all analyses of public spending on pharmaceuticals, our analysis valued drugs at list prices and did not have access to confidential discounts. The trends documented may have been impacted by shifts and improvements in CADTH processes over time, notably the shift to a greater use of incremental cost-utility analysis and the decline in the number of assessments with mixed or unclear results (Figure 3). CADTH does not recognize a formal threshold for cost-effectiveness for its analyses. Public consultations and the adoption of a formal value for Canada would help clarify the degree to which spending patterns were socially acceptable.
Figure 3. Distribution of 100 highest-spending brand name drugs by CADTH review type, 2015 and 2021
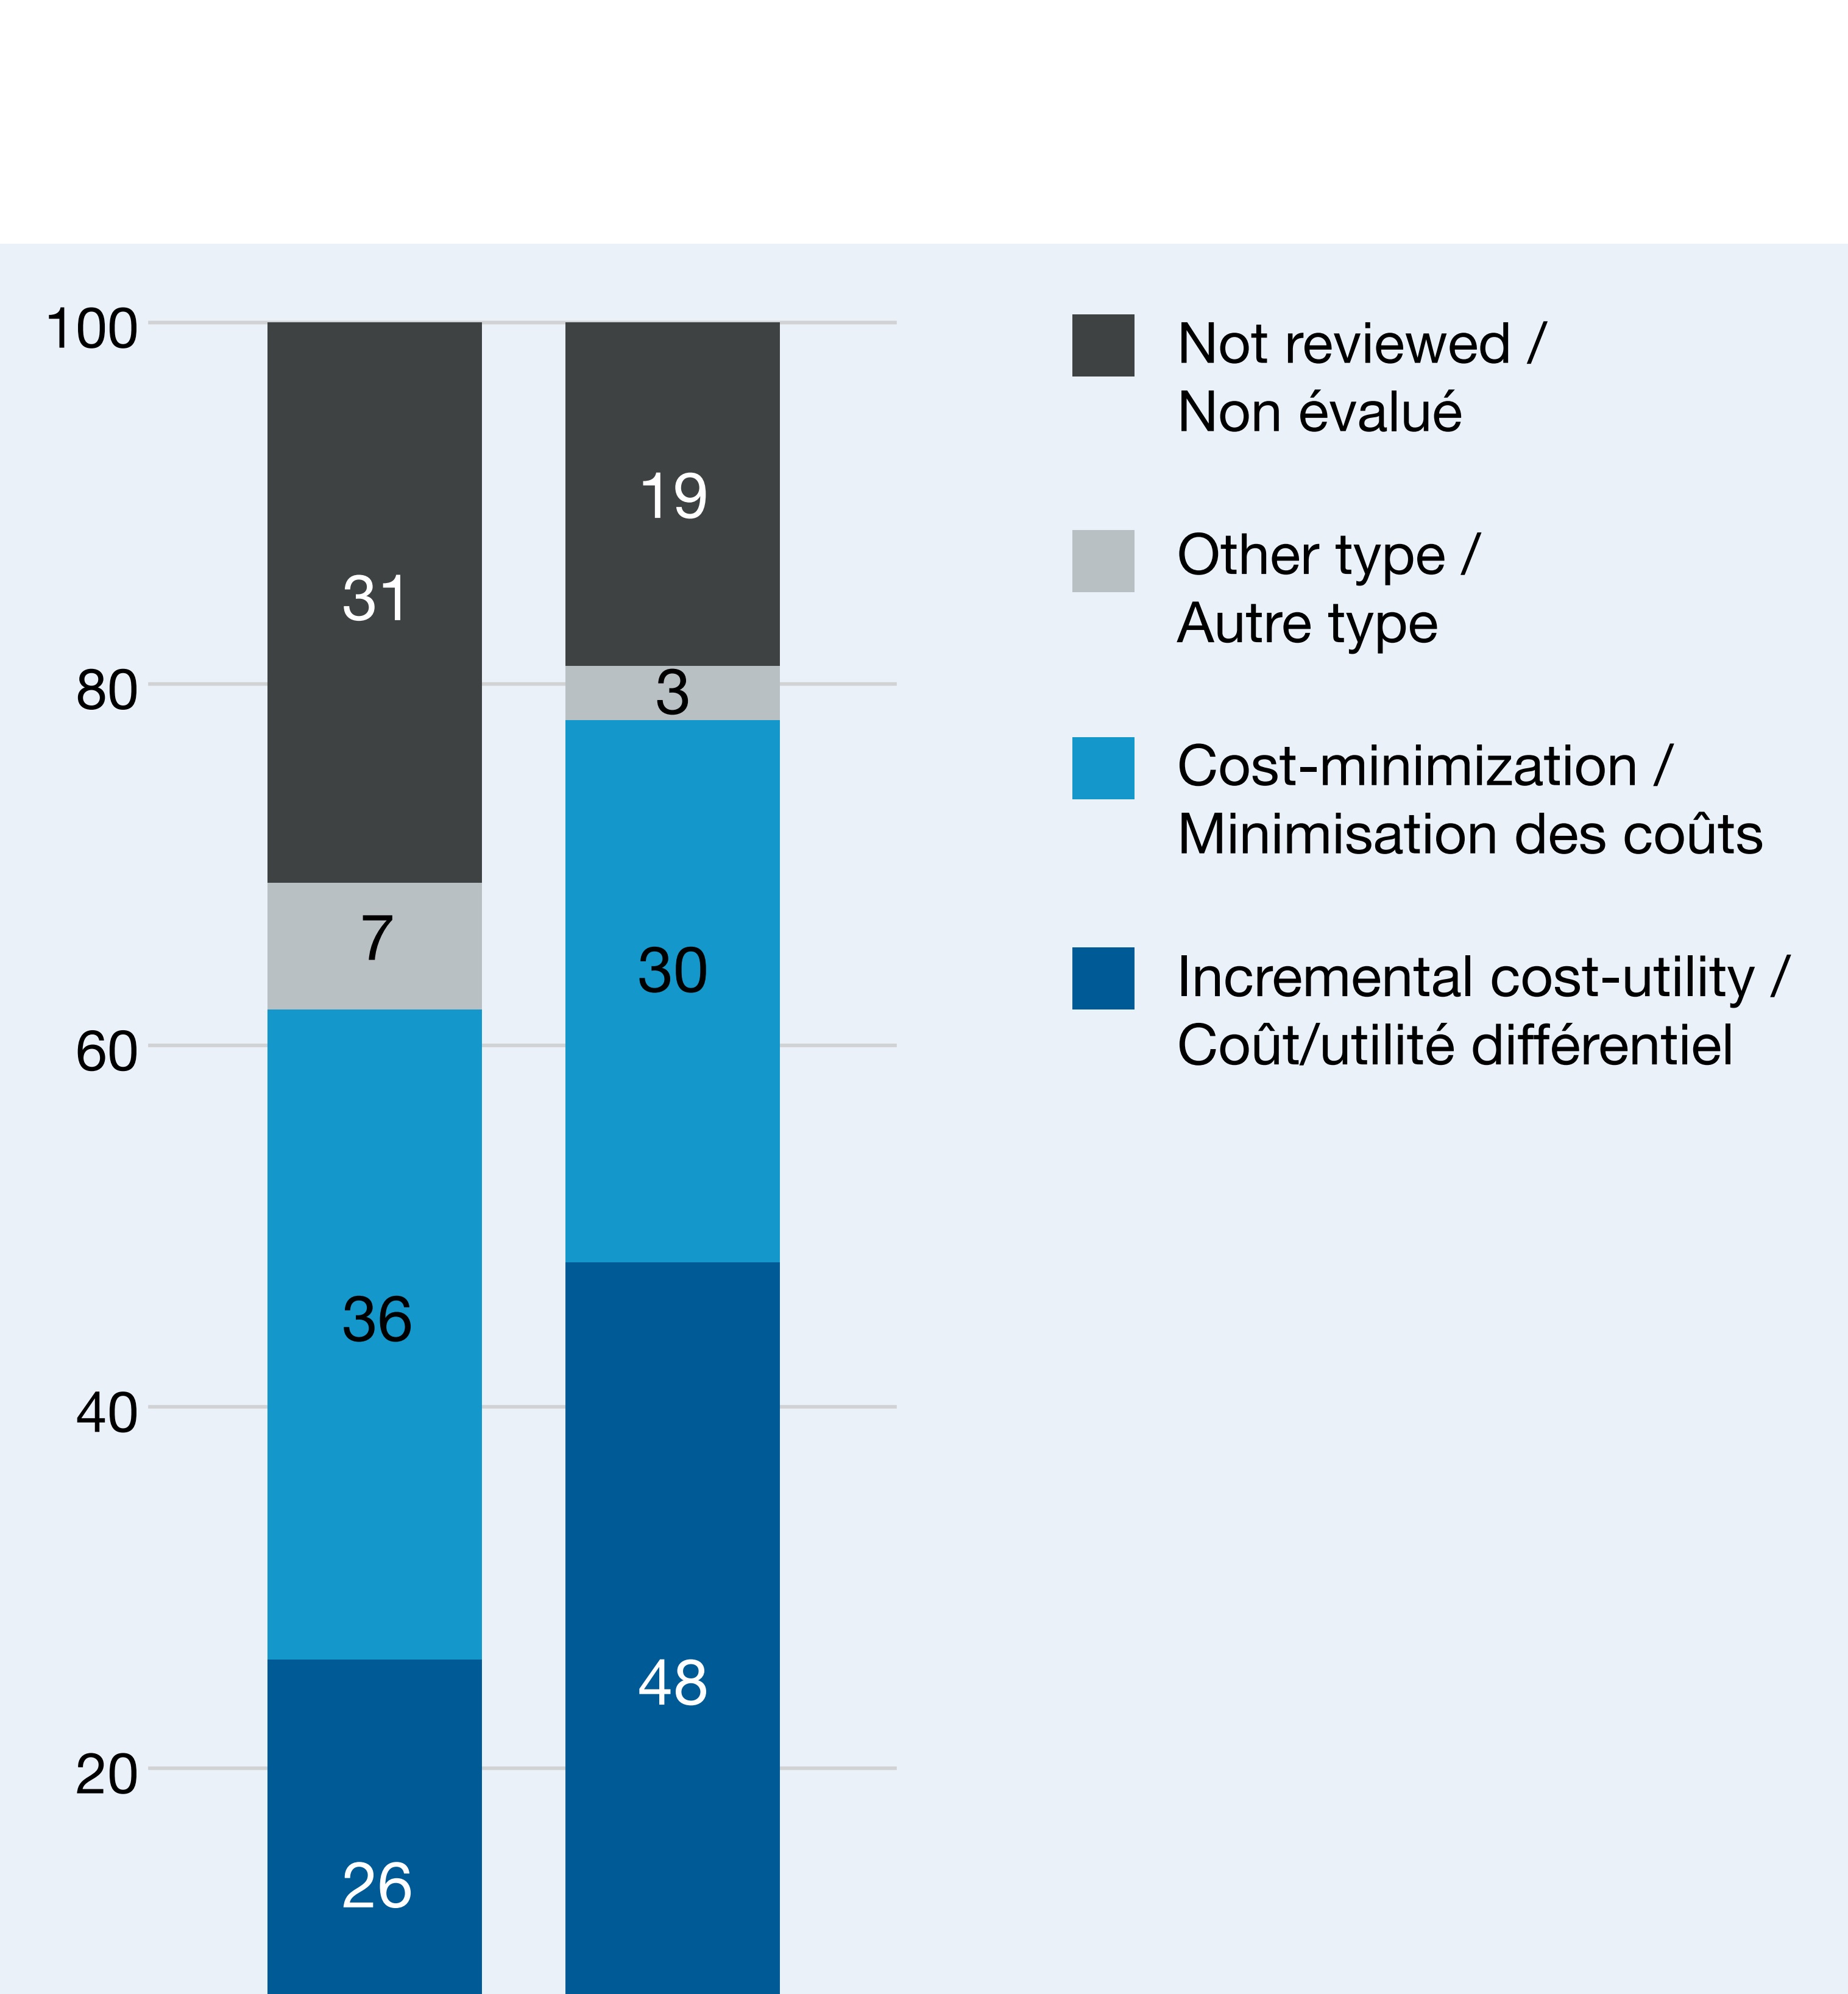
Figure - Text version
| 2015 | 2021 | |
|---|---|---|
| Incremental cost-utility | 26 | 48 |
| Cost-minimization | 36 | 30 |
| Other type | 7 | 3 |
| Not reviewed | 31 | 19 |
Recent publication
A more in-depth version of this research has recently been published in a peer-reviewed journal:
Gaudette É, Rizzardo S, Zhang Y, Pothier KR, Tadrous M. Cost-effectiveness of the top 100 drugs by public spending in Canada, 2015–2021: a repeated cross-sectional study. BMJ open. 2024 Mar 1;14(3):e082568.
Disclaimer
Although based in part on data provided by the Canadian Institute for Health Information (CIHI), the statements, findings, conclusions, views and opinions expressed in this report are exclusively those of the PMPRB.