
Cost drivers for Canada’s public and private drug plans during the COVID-19 pandemic: a 2019-2022 comparative analysis
Presented at CAHSPR 2024, May 14-16, 2024 and at the CDA Symposium, September 4-6, 2024
Yvonne Zhang
Introduction
Objective: Canadian public drug plans and private insurers together account for over three quarters of all prescribed drug spending in Canada. This poster sheds light on the differences and similarities between key cost pressures for public and private drug plans, differentiating between short-term effects and those with longer-lasting impacts.
Approach: The study spans from 2019, before the COVID-19 pandemic, to 2022, with a retrospective look at recent trends and highlights the impact of the pandemic on Canadian drug spending. A sophisticated cost-driver model analysis isolates the key factors contributing to the growth in drug expenditures (see Definitions). The cost driver analysis approach is detailed in a methodological report available online (see References).
Data
The main data sources for this report are the NPDUIS Database at the Canadian Institute for Health Information (CIHI) and the IQVIA™ Private Pay Direct Drug Plan Database (capture rate: 85.7% to 79.9% of the private pay direct market in Canada, varying by year). NPDUIS public drug plan annual data were aggregated at fiscal years (Apr. to Mar.), while private drug plan data were available at calendar years (Jan. to Dec.).
Definitions:
Demographic effect: Changes in the beneficiary population.
Volume effect: Changes in the amount of drugs used.
Drug-mix effect: Shifts between lower- and higher-priced drugs.
Price effect: Changes in drug prices.
Substitution effect: Shifts from brand-name to generic or biosimilar options.
Results
Drug costs rose by 7.9% in public plans in 2022/23 and 4.5% in private plans in 2022
- From 2019/20 to 2022/23, public plans saw a compound annual growth rate (CAGR) of 6.4%. In private plans, the CAGR was 6.7%Footnote 1 over the 2019-2022 period.
- The increasing use of higher-cost drugs (drug-mix effect) is the main cost driver for Canadian public and private drug plans. These were responsible for 7.1% of costs growth in public plans in 2022/23 and 5.0% in private plans 2022.
- Cost-mitigating measures (e.g. generic and biosimilar substitution and price reductions) only lowered costs by 4.2% in public plans in 2022/23 and 2.2% in private plans in 2022.
- The COVID-19 pandemic caused shifts in claims for both plan types: first a downward demographic effect in 2020 due to fewer reimbursed beneficiaries, then a rebound surpassing pre-pandemic levels in 2021 and 2022. Meanwhile, the volume effect exerted a minor inverse force (partly due to pandemic-related temporary prescription size limits).
- OHIP+ spending stabilized and has had little impact since 2019/20. The effect of direct acting antiviral (DAA) drugs for hepatitis C has also diminished and is not shown separately since 2020/21.
Figure 1. Drug cost drivers
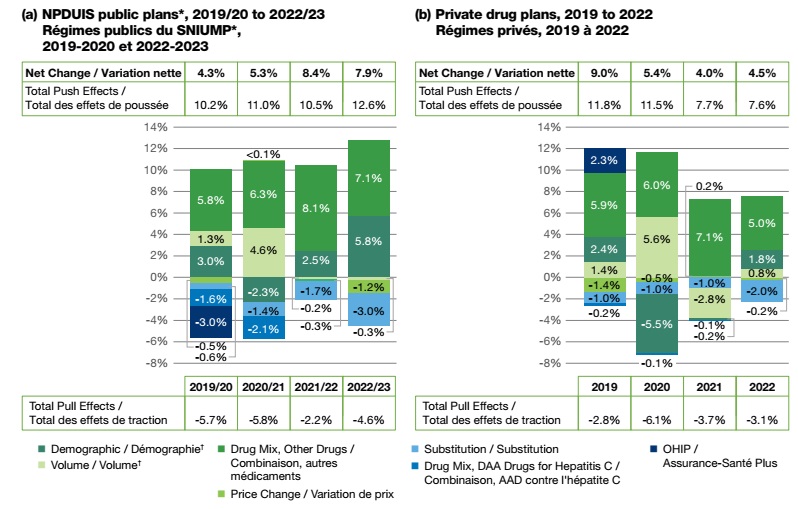
Figure - Text version
NPDUIS public plans, 2019/20 to 2022/23
| 2019/20 | 2020/21 | 2021/22 | 2022/23 | |
|---|---|---|---|---|
OHIP+ |
-3.0% |
- |
- |
- |
Drug-mix, direct-acting antiviral (DAA) drugs |
-1.6% |
-2.1% |
- |
- |
Drug-mix, other drugs |
5.8% |
6.3% |
8.1% |
7.1% |
Demographic |
3.0% |
-2.3% |
2.5% |
5.8% |
Volume |
1.3% |
4.6% |
-0.2% |
-0.3% |
Price change |
-0.5% |
<0.1% |
-0.3% |
-1.2% |
Substitution |
-0.6% |
-1.4% |
-1.7% |
-3.0% |
Total push effects |
10.2% |
11.0% |
10.5% |
12.6% |
Total pull effects |
-5.7% |
-5.8% |
-2.2% |
-4.6% |
Net change |
4.3% |
5.3% |
8.4% |
7.9% |
Private drug plans, 2019 to 2022
| 2019 | 2020 | 2021 | 2022 | |
|---|---|---|---|---|
OHIP+ |
2.3% |
- |
- |
- |
Drug-mix, direct-acting antiviral (DAA) drugs |
-0.2% |
-0.1% |
-0.1% |
- |
Drug-mix, other drugs |
5.9% |
6.0% |
7.1% |
5.0% |
Demographic |
2.4% |
-5.5% |
-0.2% |
1.8% |
Volume |
1.4% |
5.6% |
-2.8% |
0.8% |
Price change |
-1.4% |
-0.5% |
0.2% |
-0.2% |
Substitution |
-1.0% |
-1.0% |
-1.0% |
-2.0% |
Total push effects |
11.8% |
11.5% |
7.7% |
7.6% |
Total pull effects |
-2.8% |
-6.1% |
-3.7% |
-3.1% |
Net change |
9.0% |
5.4% |
4.0% |
4.5% |
Note: When multiple factors change simultaneously, they create a residual or cross effect, which is not reported separately in this analysis, but is accounted for in the net change. Individual values may not add to the net change due to rounding and cross-effects between factors.
*British Columbia, Alberta, Saskatchewan, Manitoba, Ontario, New Brunswick, Nova Scotia, Prince Edward Island, Newfoundland and Labrador, Yukon, and the Non-Insured Health Benefits (NIHB) Program. Results for 2020-21 onward do not include the NIHB program.
†A temporary partial data discontinuity from the private drug plans data supplier in 2021 and 2022 influenced the results for the demographic and volume effects.
Drug-mix effect
Increased use of higher-cost drugs is the primary driver of drug cost growth, pushing costs up by 5%–8% annually
- Drugs with annual treatment costs over $10,000 make up 37% of drug costs in public plans and 33% in private plans.
- Drugs with annual treatment costs over $25,000 make up 20% of drug costs in public plans and 15% in private plans. Public plan data is skewed towards beneficiaries with higher costs due to plan design and the focus on beneficiaries who met their deductible and received public reimbursement.
- The number of high-cost drugs across all cost bands has sharply increased in recent years. In 2022/23, public plans reimbursed 158 drugs costing over $10,000 annually and 93 costing over $25,000, while private drug plans in 2022 reimbursed 264 and 167, respectively; a 20%–30% increase compared to four years ago.
- The number of drugs costing over $100,000 annually per patient has almost doubled in public plans, from 13 in 2019/20 to 25 by 2022/23, and from 32 to 46 in private plans from 2019 to 2022. Despite their rapidly growing numbers, this category of drugs is used by less than 1% of the population.
Figure 2. Trends in the number and cost share of high-cost drugs

Figure - Text version
NPDUIS public plans, 2019/20 to 2022/23
| Number of drugs with annual costs of $10K to $25K | Number of drugs with annual costs of $25K to $50K | Number of drugs with annual costs of $50K to $100K | Number of drugs with annual costs of $100K+ | $10K high-cost drugs share of total drug costs | $25K high-cost drugs share of total drug costs | |
|---|---|---|---|---|---|---|
2019/20 |
58 |
36 |
23 |
13 |
34.0% |
19.2% |
2020/21 |
57 |
38 |
24 |
16 |
34.7% |
18.4% |
2021/22 |
60 |
40 |
25 |
22 |
36.9% |
18.9% |
2022/23 |
65 |
42 |
26 |
25 |
37.4% |
20.5% |
Private drug plans, 2019 to 2022
| Number of drugs with annual costs of $10K to $25K | Number of drugs with annual costs of $25K to $50K | Number of drugs with annual costs of $50K to $100K | Number of drugs with annual costs of $100K+ | $10K high-cost drugs share of total drug costs | $25K high-cost drugs share of total drug costs | |
|---|---|---|---|---|---|---|
2019 |
75 |
59 |
40 |
32 |
30.4% |
14.0% |
2020 |
86 |
62 |
46 |
35 |
32.9% |
15.2% |
2021 |
87 |
70 |
49 |
41 |
34.3% |
15.8% |
2022 |
97 |
69 |
52 |
46 |
33.3% |
15.4% |
*British Columbia, Alberta, Saskatchewan, Manitoba, Ontario, New Brunswick, Nova Scotia, Prince Edward Island, Newfoundland and Labrador, Yukon, and the Non-Insured Health Benefits (NIHB) Program. Results for 2020-21 onward do not include the NIHB program.
Price and substitution effects
The offsetting influences of generic price reductions and brand-name price increases has had a minimal net impact on drug cost growth (-1.4% to 0.2%) in public and private drug plans
- Shifting from brand-name to generic or biosimilar drugs had a more pronounced pull-down effect, impacting drug costs by -3.0% in public plans in 2022/23 and -2.0% in private plans in 2022.
- Recent biosimilar policy changes in most public drug plans, as well as initiatives introduced by some private payers, have significantly boosted the substitution effect. Use of biosimilars, particularly for three widely-used immunosuppressants (adalimumab, infliximab, and etanercept), have notably contributed to savings.
- With the ongoing implementation and expansion of biosimilar switching initiatives at the jurisdiction level and by payer, public drug plans have been ahead of private plans in realizing savings from biosimilars, and the impact continues as the availability of biosimilars expands.
Figure 3. Trends in price and substitution effects
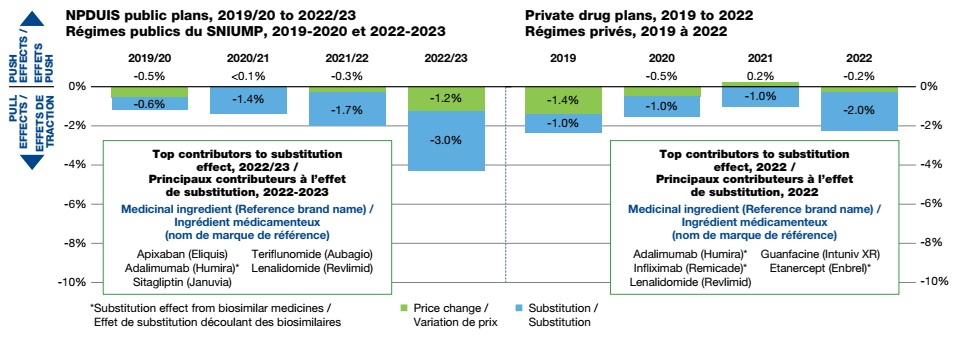
Figure - Text version
NPDUIS public plans, 2019/20 to 2022/23
| 2019/20 | 2020/2021 | 2021/22 | 2022/23 | |
|---|---|---|---|---|
Price Change |
-0.5% |
0.04% |
-0.3% |
-1.2% |
Substitution |
-0.6% |
-1.4% |
-1.7% |
-3.0% |
Top contributors to substitution effect, 2022/23
Medicinal ingredient (Reference brand name):
Apixaban (Eliquis)
Adalimumab (Humira)*
Sitagliptin (Januvia)
Teriflunomide (Aubagio)
Lenalidomide (Revlimid)
Private drug plans, 2019 to 2022
| 2019 | 2020 | 2021 | 2022 | |
|---|---|---|---|---|
Price Change |
-1.4% |
-0.5% |
0.2% |
-0.2% |
Substitution |
-1.0% |
-1.0% |
-1.0% |
-2.0% |
Top contributors to substitution effect, 2022
Medicinal ingredient (Reference brand name):
Adalimumab (Humira)*
Infliximab (Remicade)*
Lenalidomide (Revlimid)
Guanfacine (Intuniv XR)
Etanercept (Enbrel)*
*Substitution effect from biosimilar medicines
Demographic and volume effects
Changes in the beneficiary population pushed drug costs upward by 5.8% in public plans in 2022/23 and 1.8% in private plans in 2022. The volume effect had a modest impact on cost growth (-0.3% in public and 0.8% in private plans) due to a slower increase in quantity of drugs dispensed per patient.
- Beneficiary demographics in public and private plans differ significantly. The latest data show that the share of beneficiaries (male and female) in the 25-64 and 65+ age groups are nearly flipped between the two plan types: around 20% (25-64) and 63% (65+) in public plans, compared to 66% (25-64) and 12% (65+) in private plans. The under-25 age group shows less variation.
- Despite variations between plan types, the cost per active beneficiary has been on the rise from 2019-2022 for nearly all age and gender groups.
- Males aged 25-64 had the highest average annual spending per active beneficiary. In 2022/23, this group spent on average over $3,000 per active beneficiary in public plans, and nearly $1,000 in private drug plans in 2022, making up 9% of the public and 29% of the private beneficiary population.
- Seniors (65+) made up the majority (63% in 2022/23) of public plan beneficiaries and an emerging segment in private plans (12% in 2022). However, the average spending per senior (65+) in private plans was relatively low (around $800—less than half that of public plans), reflecting incomplete utilization and costs due to coordination with their publicly reimbursed benefits.
Figure 4. Average drug cost per active beneficiary and demographic composition by age and gender
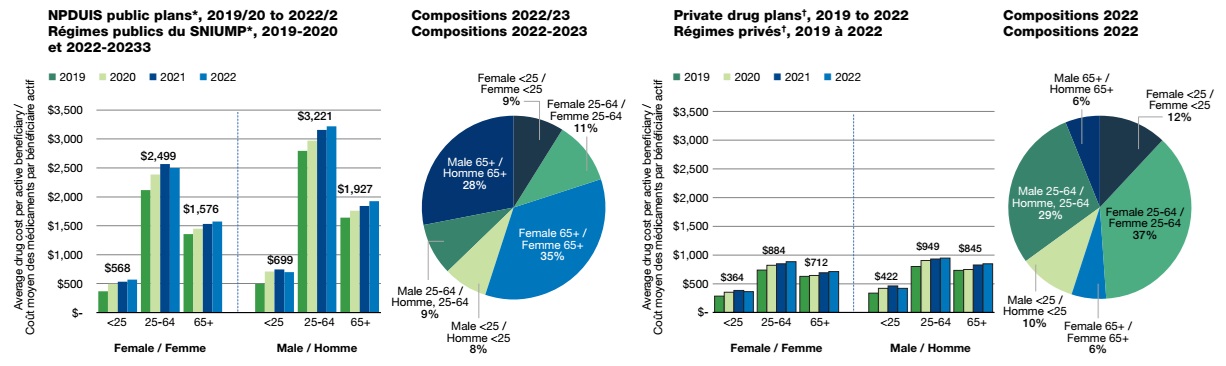
Figure - Text version
Average drug cost per active beneficiary, NPDUIS public plans, 2019/20 to 2022/23
| Age | 2019/20 | 2020/2021 | 2021/22 | 2022/23 | |
|---|---|---|---|---|---|
Female |
Less than 25 |
$ 369 |
$ 497 |
$ 532 |
$ 568 |
25 to 64 |
$ 2,116 |
$ 2,387 |
$ 2,567 |
$ 2,499 |
|
65 and over |
$ 1,358 |
$ 1,451 |
$ 1,534 |
$ 1,576 |
|
Male |
Less than 25 |
$ 496 |
$ 711 |
$ 744 |
$ 699 |
25 to 64 |
$ 2,795 |
$ 2,970 |
$ 3,160 |
$ 3,221 |
|
65 and over |
$ 1,643 |
$ 1,759 |
$ 1,842 |
$ 1,927 |
|
NPDUIS public plan active beneficiary compositions, 2022/23
| Age | Share of active beneficiaries | |
|---|---|---|
Female |
Less than 25 |
9% |
25 to 64 |
11% |
|
65 and over |
35% |
|
Male |
less than 25 |
8% |
25 to 64 |
9% |
|
65 and over |
28% |
Average drug cost per active beneficiary, private drug plans, 2019 to 2022
| Age | 2019 | 2020 | 2021 | 2022 | |
|---|---|---|---|---|---|
Female |
Less than 25 |
$ 286 |
$ 350 |
$ 381 |
$ 364 |
25 to 64 |
$ 736 |
$ 820 |
$ 846 |
$ 884 |
|
65 and over |
$ 627 |
$ 643 |
$ 691 |
$ 712 |
|
Male |
Less than 25 |
$ 336 |
$ 420 |
$ 462 |
$ 422 |
25 to 64 |
$ 799 |
$ 905 |
$ 932 |
$ 949 |
|
65 and over |
$ 733 |
$ 750 |
$ 824 |
$ 845 |
Private drug plan active beneficiary compositions, 2022
| Age | Share of active beneficiaries | |
|---|---|---|
Female |
Less than 25 |
12% |
25 to 64 |
37% |
|
65 and over |
6% |
|
Male |
less than 25 |
10% |
25 to 64 |
29% |
|
65 and over |
6% |
*British Columbia, Alberta, Saskatchewan, Manitoba, Ontario, New Brunswick, Nova Scotia, Prince Edward Island, Newfoundland and Labrador, and Yukon.
†A temporary partial data discontinuity from the private drug plans data supplier in 2021 and 2022 influenced the results for the demographic and volume effects.
Limitations
The drug costs reported include associated markups and do not reflect rebates resulting from confidential product listing agreements.
Disclaimer
Although based in part on data provided by the Canadian Institute for Health Information (CIHI) or under license by IQVIA™, the statements, findings, conclusions, views and opinions expressed in this report are exclusively those of the PMPRB.
References
Patented Medicine Prices Review Board. 2013. The Drivers of Prescription Drug Expenditures: A Methodological Report. Ottawa: PMPRB.