
IRCC Minister Transition Binder 2019: IRCC – Public Opinion Research on Canadians’ Attitudes towards Immigration
Immigration Levels
Phone Surveys & Focus Groups
- Canadians’ views on immigration levels remain supportive, though a group of Canadians feel there are “too many” immigrants coming to Canada.
- In focus groups, participants see Canada’s economic and cultural need for immigration, but voice concerns about our ability to adequately settle and integrate new immigrants.
In your opinion do you feel that there are too many, too few or about the right number of immigrants coming to Canada?
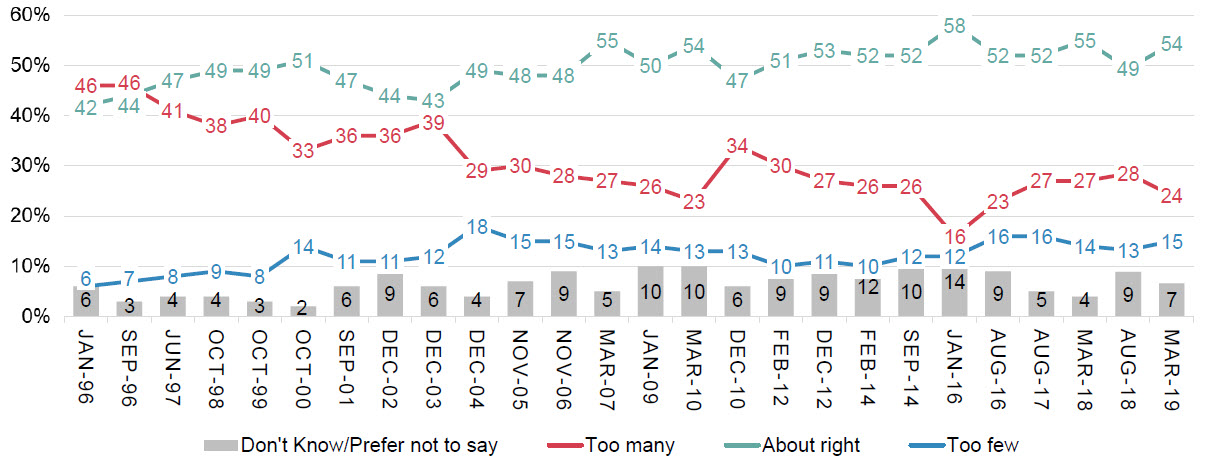
Text version: In your opinion do you feel that there are too many, too few or about the right number of immigrants coming to Canada?
| Date | Too many | About right | Too few | Don’t know or preferred not to say |
|---|---|---|---|---|
| January 1996 | 46% | 42% | 6% | 6% |
| September 1996 | 46% | 44% | 7% | 3% |
| June 1997 | 41% | 47% | 8% | 4% |
| October 1998 | 38% | 49% | 9% | 4% |
| October 1999 | 40% | 49% | 8% | 3% |
| October 2000 | 33% | 51% | 14% | 2% |
| September 2001 | 36% | 47% | 11% | 6% |
| December 2002 | 36% | 44% | 11% | 9% |
| December 2003 | 39% | 43% | 12% | 6% |
| December 2004 | 29% | 49% | 18% | 4% |
| November 2005 | 30% | 48% | 15% | 7% |
| November 2006 | 28% | 48% | 15% | 9% |
| March 2007 | 27% | 55% | 13% | 5% |
| January 2009 | 26% | 50% | 14% | 10% |
| March 2010 | 23% | 54% | 13% | 10% |
| December 2010 | 34% | 47% | 13% | 6% |
| February 2012 | 30% | 51% | 10% | 9% |
| December 2012 | 27% | 53% | 11% | 9% |
| Febraury 2014 | 26% | 52% | 10% | 12% |
| September 2014 | 26% | 52% | 12% | 10% |
| January 2016 | 16% | 58% | 12% | 14% |
| August 2016 | 23% | 52% | 16% | 9% |
| August 2017 | 27% | 52% | 16% | 5% |
| March 2018 | 27% | 55% | 14% | 4% |
| August 2018 | 28% | 49% | 13% | 9% |
| March 2019 | 24% | 54% | 15% | 7% |
Source: IRCC Telephone Tracking Survey (1996 through March 2019)
Online Surveys
Views on immigration, and in particular support for levels, are more negative in online surveys compared to telephone surveys.
Differences between online and telephone results – March 2019
| Source | Too many | About right | Too few | Don’t know or preferred not to say |
|---|---|---|---|---|
| Online | 37% | 42% | 10% | 12% |
| Telephone | 24% | 54% | 15% | 7% |
| Difference | +13% | -12% | -5% | +5% |
Source: IRCC Telephone & Online Tracking Survey (March 2019)
Did you know?
- In part, the difference is believed to be the result of “social desirability bias”, where respondents are uncomfortable expressing opinions that may be viewed unfavorably by a telephone interviewer.
- For this reason, we cannot make comparisons between telephone and online results, particularly with respect to historic trending.
External Surveys Support IRCC’s Understanding
- External polling presents similar findings regarding perceptions of immigration levels.
- Canadians underestimate immigration levels, and prioritize economic over family and refugee classes.
Angus Reid Institute Online Survey (September 2019)
In your opinion do you feel that there are too many, too few or about the right number of immigrants coming to Canada?
- Too many: 40%
- About right: 39%
- Too few: 13%
- Don’t know or preferred not to answer: 8%
Economic Immigration (58% of total)
- Too many: 18%
- About right: 48%
- Too few: 28%
Family Immigration (27% of total)
- Too many: 31%
- About right: 53%
- Too few: 11%
Refugee or Humanitarian Immigration (15% of total)
- Too many: 34%
- About right: 38%
- Too few: 23%
How many immigrants were admitted entry to Canada in 2019 (Actual 2019 level: 331,000 immigrants)?
| Guess | Percentage |
|---|---|
| Fewer than 200,000 | 20% |
| Between 200,000 to 299,999 | 33% |
| Between 300,000 to 399,999 | 20% |
| Between 400,000 to 499,999 | 9% |
| Greater than 500,000 | 7% |
| Don’t know or preferred not to answer | 11% |
Segmenting Attitudes
- Polarized population segments found in other countries are present in Canada, but to a lesser extent.
- Views on immigration levels are strongly correlated with views on the costs and benefits of immigration.
- The segmentation model categorizes people using answers to attitudinal questions on the economic and social benefits and costs of immigration.
In your opinion is immigration a benefit or a cost?
| Response | Percentage of responses |
|---|---|
| Economic benefit and social benefit | 26% |
| Economic benefit only | 10% |
| Social benefit only | 13% |
| Conflicted: both a benefit and a cost | 6% |
| Neutral: neither a benefit nor a cost | 23% |
| Social cost only | 4% |
| Economic cost only | 8% |
| Economic cost and social cost | 10% |
Source: IRCC Telephone Tracking Survey (March 2019)
Impact of Immigration
Views on the impact of immigration change as scope narrows from the national to local level.
Benefits of immigration:
- More clearly seen at the national level
- A large number of Canadians do not see a local impact
In general, what effect does immigration to this country have on Canada, my province, my city and my neighbourhood?
| Region | Positive impact | Neither positive or negative | Negative impact |
|---|---|---|---|
| Canada | 67% | 12% | 19% |
| My province | 62% | 16% | 20% |
| My city | 59% | 23% | 17% |
| My neighbourhood | 51% | 35% | 11% |
Source: IRCC Telephone Tracking (March 2019)
Regional Views on Local Immigration Levels
Support for the number of immigrants coming to Canadian cities varies substantially.
- Toronto and Vancouver are particularly likely to say there are too many, with residents expressing less support for their city’s levels than they do for national levels.
- Mid-sized and small centres in Atlantic Canada and Quebec are most likely to want to see an increase.
In your opinion do you feel that there are too many, too few or about the right number of immigrants coming to your city?
| Region | Local population | Too many | About right | Too few | Don’t know or preferred not to say |
|---|---|---|---|---|---|
| Atlantic Canada | 100,000 or over | 19% | 47% | 21% | 13% |
| Under 100,000 | 13% | 35% | 24% | 28% | |
| Quebec | Montréal | 26% | 45% | 12% | 18% |
| 100,000 or over (excluding Montréal) | 10% | 50% | 25% | 14% | |
| Under 100,000 | 7% | 38% | 28% | 28% | |
| Ontario | Toronto | 41% | 38% | 6% | 15% |
| 100,000 or over (excluding Toronto) | 26% | 40% | 11% | 23% | |
| Under 100,000 | 19% | 40% | 17% | 24% | |
| Manitoba and Saskatchewan | 100,000 or over | 35% | 38% | 12% | 16% |
| Under 100,000 | 21% | 59% | 3% | 17% | |
| Alberta | 100,000 or over | 29% | 40% | 8% | 24% |
| Under 100,000 | 26% | 49% | 13% | 12% | |
| British Columbia | Vancouver | 37% | 43% | 8% | 12% |
| 100,000 or over (excluding Vancouver) | 17% | 47% | 19% | 17% | |
| Under 100,000 | 28% | 40% | 13% | 20% |
Source: IRCC Online Tracking (March 2019)