
IRCC Minister Transition Binder 2019: Immigrant Outcomes
Outline
Canada admits the largest number of skilled labour migrants in the OECD. Additionally, Canada also has the most carefully designed and longest-standing skilled migration system in the OECD. It is widely perceived as a benchmark for other countries, and its success is evidenced by good integration outcomes.
Souce: OECD, Recruiting Immigrant Workers: Canada 2019 (2019)
Economic outcomes of immigrants, by immigration category:
- Labour force indicators
- Average entry employment earnings
- Average employment earnings over time
- Net direct fiscal contribution
Social outcomes of immigrants, by immigration category:
- Civic engagement
- Sense of belonging
- Citizenship take-up rate
Outcomes of the children of immigrants:
- University completion rates
Immigrant Outcomes in the Canadian Labour Market
- Economic principal applicants participate in the labour market at a higher rate than the Canadian-born population, and also report higher employment rates.
- The unemployment rate for economic principal applicants is on par with the Canadian-born average.
- As permanent residents who are not selected for primarily economic reasons, refugees and sponsored family class immigrants report lower participation and employment rates.
- In 2018, the labour market performance of immigrants in Canada was stronger than the average reported for other OECD countries.
Participation, employment and unemployment rates, age 25-54
| Category | Participation rate | Employment rate | Unemployment rate |
|---|---|---|---|
| Canadian born | 87% | 82% | 6% |
| Sponsored family | 80% | 75% | 7% |
| Economic immigrants – spouses and dependants | 82% | 75% | 8% |
| Economic immigrants principal applicants | 90% | 85% | 6% |
| Refugees | 78% | 72% | 9% |
| All Immigrants | 83% | 77% | 7% |
Source: 2016 Census
How Much do Immigrants Earn Initially?
Immigrants (except refugees) who landed in 2014 and 2015 reported the highest entry employment earnings of any landing cohort since 1990.
- Economic principal applicants’ entry earnings have grown rapidly ($31,000 in 1990 compared to $45,000 in 2015).
- Entry earnings in certain immigration categories (i.e., sponsored family, refugees) have been relatively stable since 1990.
Average entryFootnote * employment earnings, by immigration category (in 2016 constant dollars)
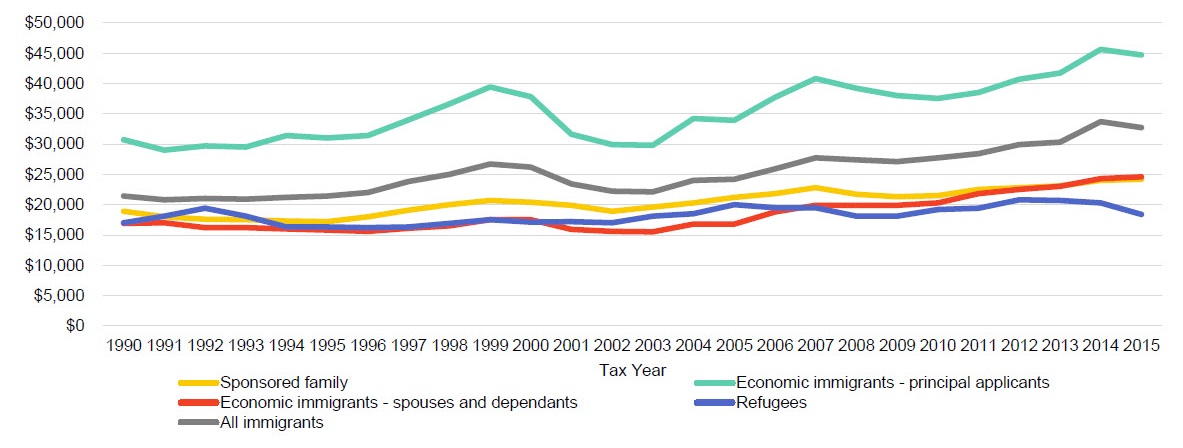
Text version: Average entry employment earnings, by immigration category (in 2016 constant dollars)
| Tax Year | Sponsored family | Economic immigrants –principal applicants | Economic immigrants – spouses and dependants | Refugees | All immigrants |
|---|---|---|---|---|---|
| 1990 | $18,900 | $30,700 | $16,900 | $17,100 | $21,400 |
| 1991 | $18,000 | $29,000 | $17,000 | $18,100 | $20,800 |
| 1992 | $17,600 | $29,700 | $16,200 | $19,400 | $21,000 |
| 1993 | $17,500 | $29,500 | $16,200 | $18,100 | $20,900 |
| 1994 | $17,300 | $31,400 | $16,000 | $16,300 | $21,200 |
| 1995 | $17,200 | $31,000 | $15,800 | $16,300 | $21,400 |
| 1996 | $18,000 | $31,400 | $15,600 | $16,200 | $22,000 |
| 1997 | $19,100 | $34,000 | $16,100 | $16,900 | $23,800 |
| 1998 | $20,000 | $36,600 | $16,500 | $17,500 | $25,000 |
| 1999 | $20,700 | $39,400 | $17,500 | $17,100 | $26,700 |
| 2000 | $20,400 | $37,800 | $17,500 | $17,200 | $26,200 |
| 2001 | $19,900 | $31,600 | $15,900 | $17,000 | $23,400 |
| 2002 | $18,900 | $29,900 | $15,600 | $18,100 | $22,200 |
| 2003 | $19,600 | $29,800 | $15,500 | $18,500 | $22,100 |
| 2004 | $20,300 | $34,200 | $16,800 | $20,000 | $24,000 |
| 2005 | $21,200 | $33,900 | $16,800 | $19,500 | $25,900 |
| 2006 | $21,800 | $37,700 | $18,800 | $19,500 | $27,700 |
| 2007 | $22,800 | $40,800 | $19,900 | $18,100 | $27,400 |
| 2008 | $21,700 | $39,200 | $19,900 | $18,100 | $27,100 |
| 2009 | $21,300 | $38,000 | $19,900 | $19,200 | $27,700 |
| 2010 | $21,500 | $37,500 | $20,300 | $19,400 | $28,400 |
| 2011 | $22,500 | $38,500 | $21,800 | $20,800 | $29,900 |
| 2012 | $22,800 | $40,700 | $22,500 | $20,700 | $30,300 |
| 2013 | $23,100 | $41,700 | $23,000 | $20,300 | $33,700 |
| 2014 | $24,000 | $45,600 | $24,300 | $18,400 | $32,700 |
| 2015 | $24,200 | $44,700 | $24,600 | $18,400 | $32,700 |
| 1990 | $18,900 | $30,700 | $16,900 | $17,100 | $21,400 |
| 1991 | $18,000 | $29,000 | $17,000 | $18,100 | $20,800 |
| 1992 | $17,600 | $29,700 | $16,200 | $19,400 | $21,000 |
| 1993 | $17,500 | $29,500 | $16,200 | $18,100 | $20,900 |
| 1994 | $17,300 | $31,400 | $16,000 | $16,300 | $21,200 |
| 1995 | $17,200 | $31,000 | $15,800 | $16,300 | $21,400 |
| 1996 | $18,000 | $31,400 | $15,600 | $16,200 | $22,000 |
| 1997 | $19,100 | $34,000 | $16,100 | $16,900 | $23,800 |
| 1998 | $20,000 | $36,600 | $16,500 | $17,500 | $25,000 |
| 1999 | $20,700 | $39,400 | $17,500 | $17,100 | $26,700 |
| 2000 | $20,400 | $37,800 | $17,500 | $17,200 | $26,200 |
| 2001 | $19,900 | $31,600 | $15,900 | $17,000 | $23,400 |
| 2002 | $18,900 | $29,900 | $15,600 | $18,100 | $22,200 |
| 2003 | $19,600 | $29,800 | $15,500 | $18,500 | $22,100 |
| 2004 | $20,300 | $34,200 | $16,800 | $20,000 | $24,000 |
| 2005 | $21,200 | $33,900 | $16,800 | $19,500 | $25,900 |
| 2006 | $21,800 | $37,700 | $18,800 | $19,500 | $27,700 |
| 2007 | $22,800 | $40,800 | $19,900 | $18,100 | $27,400 |
| 2008 | $21,700 | $39,200 | $19,900 | $18,100 | $27,100 |
| 2009 | $21,300 | $38,000 | $19,900 | $19,200 | $27,700 |
| 2010 | $21,500 | $37,500 | $20,300 | $19,400 | $28,400 |
| 2011 | $22,500 | $38,500 | $21,800 | $20,800 | $29,900 |
| 2012 | $22,800 | $40,700 | $22,500 | $20,700 | $30,300 |
| 2013 | $23,100 | $41,700 | $23,000 | $20,300 | $33,700 |
| 2014 | $24,000 | $45,600 | $24,300 | $18,400 | $32,700 |
| 2015 | $24,200 | $44,700 | $24,600 | $18,400 | $32,700 |
Source: Longitudinal Immigration Database (IMDB), 2016. IMDB analysis includes immigrant tax filers who are 15 and over.
Employment Earnings over Time
- Economic principal applicants’ employment earnings are well above the average for all immigrants, and surpass the Canadian-born average shortly after landing.
- Among refugees, employment earnings were consistently lower than the average for all immigrants, and remained below the Canadian average 15 years after landing.
Average employment earnings, by immigration category and years since landing (tax year 2016)
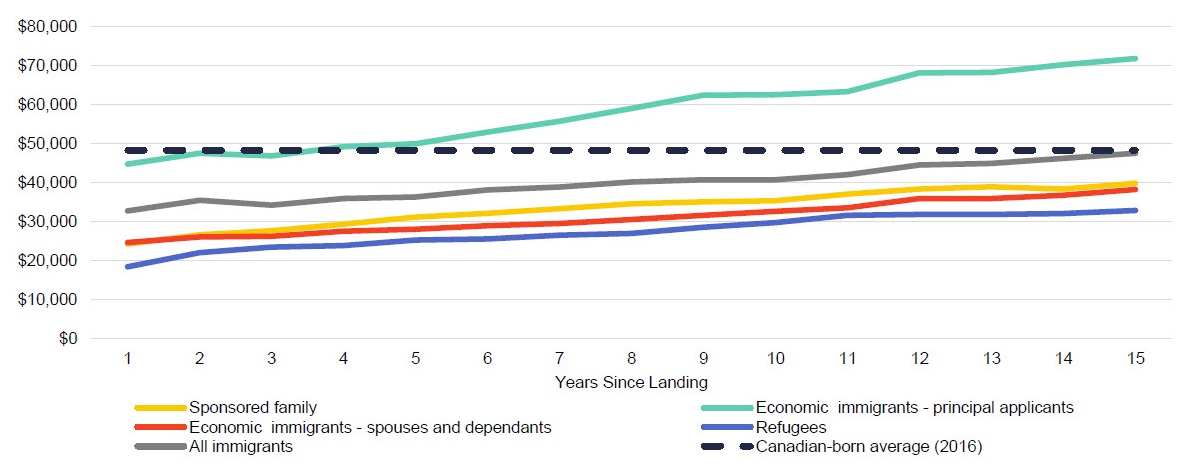
Text version: Average employment earnings, by immigration category and years since landing (tax year 2016)
| Years since landing | Sponsored family | Economic immigrants – principal applicants | Economic immigrants – spouses and dependants | Refugees | All immigrants | Canadian-born average (2016) |
|---|---|---|---|---|---|---|
| 1 | $24,200 | $44,700 | $24,600 | $18,400 | $32,700 | $48,200 |
| 2 | $28,600 | $47,500 | $26,000 | $22,000 | $35,400 | $48,200 |
| 3 | $27,600 | $46,800 | $26,200 | $23,400 | $34,200 | $48,200 |
| 4 | $29,300 | $49,200 | $27,500 | $23,800 | $35,900 | $48,200 |
| 5 | $31,100 | $49,900 | $28,000 | $25,200 | $36,300 | $48,200 |
| 6 | $32,100 | $52,900 | $28,900 | $25,500 | $38,100 | $48,200 |
| 7 | $33,300 | $55,700 | $29,500 | $26,500 | $38,800 | $48,200 |
| 8 | $34,500 | $59,000 | $30,500 | $26,900 | $40,100 | $48,200 |
| 9 | $35,000 | $62,400 | $31,600 | $28,500 | $40,700 | $48,200 |
| 10 | $35,300 | $62,500 | $32,600 | $29,700 | $40,700 | $48,200 |
| 11 | $37,000 | $63,300 | $33,500 | $31,600 | $42,000 | $48,200 |
| 12 | $38,300 | $68,100 | $35,900 | $31,800 | $44,500 | $48,200 |
| 13 | $38,900 | $68,200 | $35,900 | $31,800 | $44,900 | $48,200 |
| 14 | $38,300 | $70,200 | $36,700 | $32,000 | $46,200 | $48,200 |
| 15 | $39,800 | $71,800 | $38,200 | $32,800 | $47,500 | $48,200 |
Source: Longitudinal Immigration Database (IMDB), 2016. IMDB analysis includes immigrant tax filers who are 15 and over.
Impacts of Immigration on Canada
Demographic
- Immigration is essential for increasing Canada’s working age population (aged 15 to 64 years old). Without it, Canada's population is projected to decrease by 4% in the next 20 years as the population ages. Nonetheless, immigration is not a long-term solution to population aging in Canada.
Economic
- Immigrants contribute disproportionately to the supply of highly-skilled workers in the fields of Science, Technology, Engineering, and Math (STEM), promoting productivity and innovation in Canada. Although immigrants account for 20% of the Canadian population, approximately 50% of all STEM degree holders in Canada are immigrants.
- Immigration has fueled entrepreneurship and job creation in Canada - immigrants are more likely to be business owners than the Canadian-born population.
Fiscal
- Immigrants have positive net direct fiscal contributions. Economic principal applicants make higher net contributions than other immigrants and Canadians.
- Although refugees and family class immigrants have net direct fiscal contributions that are consistently below the Canadian average, their contribution grows over time.
Civic Engagement and Sense of Belonging
Are immigrants civically engaged?
The share of economic principal applicants who voted (self-declared in the GSS) in the 2011 federal election was on par with the Canadian-born average.
Self-declared voting rates (2011 federal election), by immigration category
| Categoty | Voting rate |
|---|---|
| Canadian born | 81% |
| Sponsored family | 66% |
| Economic immigrants – spouses and dependants | 71% |
| Economic immigrants principal applicants | 82% |
| Refugees | 68% |
Source: 2013 General Social Survey
Do immigrants feel a strong sense of belonging to Canada?
Refugees report the strongest sense of belonging to Canada (95%), compared to 91% for the Canadian-born population.
Sense of belonging to Canada, by immigration category
| Categoty | Voting rate |
|---|---|
| Canadian born | 91% |
| Sponsored family | 92% |
| Economic immigrants – spouses and dependants | 93% |
| Economic immigrants principal applicants | 94% |
| Refugees | 95% |
Source: 2013 General Social Survey
Life Satisfaction
Are immigrants satisfied with life?
Economic immigrants and refugees’ satisfaction with life remains consistent over time. Family class immigrants are less likely to be satisfied with life as they spend more time in Canada.
Percentage of the population who are “satisfied with life,” by immigration class and length of time in Canada
| CategoryFootnote *** | Voting rate |
|---|---|
| Canadian born | 93% |
| Family Class - Recent | 92% |
| Family Class - Established | 88% |
| Economic immigrants - Recent | 92% |
| Economic immigrants - Established | 92% |
| Refugees - Recent | 85% |
| Refugees - Established | 85% |
Source: CCHS-IMDB linkage produced in 2017, the chart uses CCHS variables in the 2013/2014 cycle.
Are immigrants stressed?
Immigrants, especially refugees and family class immigrants, are more likely to report feeling stressed as they spend more time in Canada.
Percentage of the population that reported life stress to be “quite a bit/extremely stressful," by immigration class and length of time in Canada
| CategoryFootnote **** | Voting rate |
|---|---|
| Canadian born | 23% |
| Family Class - Recent | 16% |
| Family Class - Established | 24% |
| Economic immigrants - Recent | 23% |
| Economic immigrants - Established | 26% |
| Refugees - Recent | 17% |
| Refugees - Established | 27% |
Source: CCHS-IMDB linkage produced in 2017, the chart uses CCHS variables in the 2013/2014 cycle.
Citizenship Take-up Rate
Refugees report the highest citizenship take-up rate of all immigrants, at 89%.
In recent years, the citizenship take-up rate has declined among certain immigrants (e.g., those with lower official language skills, less education, and lower income).
- Recent policy changes such as an increase in citizenship fees may have contributed to this decline.
Citizenship take-up rate for immigrants who landed in Canada after 1980 with 4+ years since landing, by immigration category, 2016
| Category | Take-up rate |
|---|---|
| Sponsored family | 80% |
| Economic immigrants - spouses and dependants | 84% |
| Economic immigrants - principal applicants | 83% |
| Refugees | 89% |
Source: 2016 Census
Children of Immigrants
- The children of immigrants (1.5 generation and 2nd generation) complete university at a higher rate than their peers with Canadian-born parents.
- 1.5 generation refers to immigrants who arrive in Canada under the age of 15
- 2nd generation children earn more on average than children with Canadian-born parents, while 1.5 generation children earn less.
- The earnings of the children of immigrants vary by visible minority status.
- Childhood immigrants whose parents were in the economic class are significantly more likely to complete university than children who arrived as refugees, or as a sponsored family immigrant.
University completion rate (age 25-54), by generation status
| Generation status | Completion rate |
|---|---|
| First generation | 44% |
| 1.5 generation | 38% |
| Second generation | 36% |
| Third generation or more | 24% |
Source: 2016 Census
University completion rate (age 25-54), childhood immigrants (1.5 generation)
| Category | Completion rate |
|---|---|
| All immigrants | 38% |
| Refugees | 32% |
| Economic immigrants | 54% |
| Sponsored family | 24% |
Source: 2016 Census
Key Takeaways
- Immigrants, particularly economic principal applicants, have strong, positive economic outcomes.
- Despite being admitted to Canada on a humanitarian basis, refugees become increasingly self-sufficient with more time spent in Canada.
- Though immigrants and refugees appear to integrate well based on voting rates, sense of belonging, and citizenship take-up, they are more likely to report feeling stressed as they spend more time in Canada.
- Children of immigrants and refugees outperform their peers with Canadian-born parents in terms of educational attainment.
- Immigration, Refugees and Citizenship Canada monitors demographic trends in a variety of areas and will continue to report on the social and economic outcomes of immigrants.