
Bisphenol analogues in people living in Canada
Learn about human biomonitoring of bisphenol analogues in Canada.
On this page
- About bisphenol analogues
- Data sources for bisphenol analogue biomonitoring
- Results of bisphenol analogue biomonitoring
- Related links
- How to cite this web page
About bisphenol analogues
Bisphenol analogues are a group of chemicals that have similar structures and uses as bisphenol A (BPA). These uses include the production of certain plastics and other products.
The use of bisphenol analogues increased after new rules restricted the production and use of BPA. There are many types of bisphenol analogues. Commonly used bisphenol analogues that are often detected in people include:
- bisphenol E (BPE)
- bisphenol F (BPF)
- bisphenol S (BPS)
BPE, BPF and BPS may be used as replacements for BPA in epoxy resins and polycarbonate or polyethersulfone plastics. These materials can be found in a variety of products such as:
- water bottles
- food containers
- canned foods and beverages
- dental sealants and medical devices
BPS is also used as an ink developer in thermal papers used for receipts. BPF can also form naturally in mustard seeds.
People are exposed to BPE, BPF and BPS by:
- eating foods or drinking water and other beverages after these chemicals have leached from food packaging and repeat-use polycarbonate plastic containers
- skin contact with items that contain these chemicals
BPE, BPF and BPS are absorbed in the body after exposure. Bisphenols are measured in a urine sample. The presence of these bisphenol analogues in your urine reflects recent exposure to these chemicals.
The presence of a substance in your body doesn't mean it will affect your health.
Potential health effects of BPE, BPF and BPS
Bisphenol analogues may have similar health effects as BPA, because they have similar structures and similar physical and chemical properties. The potential health impacts of BPA include adverse effects on the liver, kidneys, reproduction, development and behaviour. There is less information available on the health impacts of BPE, BPF and BPS.
What we're doing to lower human exposures to BPE, BPF and BPS
We have identified bisphenol analogues for consideration as a chemical group for potential future activity under Canada's Chemicals Management Plan. In 2021, we issued a notice to collect information on the commercial status, industrial processes and uses in Canada from manufacturers, importers and those who use these chemicals to produce goods. We will use this information to determine possible risk assessment and risk management actions for bisphenol analogues.
Data sources for bisphenol analogue biomonitoring
This fact sheet presents human biomonitoring data from the:
- Canadian Health Measures Survey (CHMS)
- Maternal-Infant Research on Environmental Chemicals (MIREC) study
- Qanuilirpitaa? 2017 Nunavik Inuit Health Survey (Q2017)
You can access more results for bisphenol analogues and other self-care and consumer product chemicals in the Canadian population through the Canadian biomonitoring dashboard.
| Initiative | Collection period | Target population |
|---|---|---|
| CHMS | 2014 to 2019 | General Canadian population aged 3 to 79 living in the 10 provinces |
| MIREC | 2008 to 2011 | Pregnant people aged 18 and above from 10 cities across Canada |
| Q2017* | 2017 | Inuit aged 16 and above living in the region of Nunavik, Quebec |
| *BPF was measured in Q2017, but the data aren't presented because the average levels were too unreliable. | ||
We wish to acknowledge all participants, including Indigenous peoples, who took part in the biomonitoring studies.
Results of bisphenol analogue biomonitoring
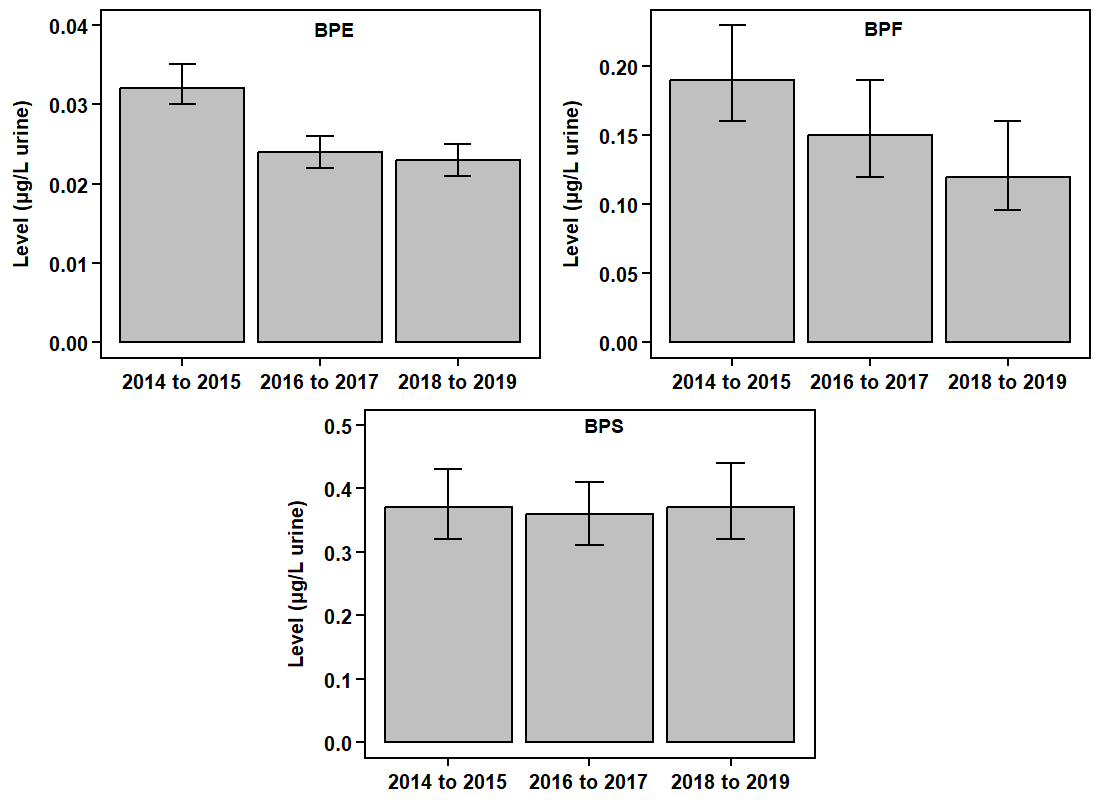
Figure 1: Levels in the Canadian population
From 2014 to 2019, average levels of BPE decreased by 28% and average levels of BPF decreased by 37%. Average levels of BPS were relatively unchanged over time.
Text description
| Chemical | Collection period | Geometric mean level (µg/L) | 95% confidence interval (µg/L) |
|---|---|---|---|
| BPE | 2014 to 2015 | 0.032 | 0.030–0.035 |
| BPE | 2016 to 2017 | 0.024 | 0.022–0.026 |
| BPE | 2018 to 2019 | 0.023 | 0.021–0.025 |
| BPF | 2014 to 2015 | 0.19 | 0.16–0.23 |
| BPF | 2016 to 2017 | 0.15 | 0.12–0.19 |
| BPF | 2018 to 2019 | 0.12 | 0.096–0.16 |
| BPS | 2014 to 2015 | 0.37 | 0.32–0.43 |
| BPS | 2016 to 2017 | 0.36 | 0.31–0.41 |
| BPS | 2018 to 2019 | 0.37 | 0.32–0.44 |
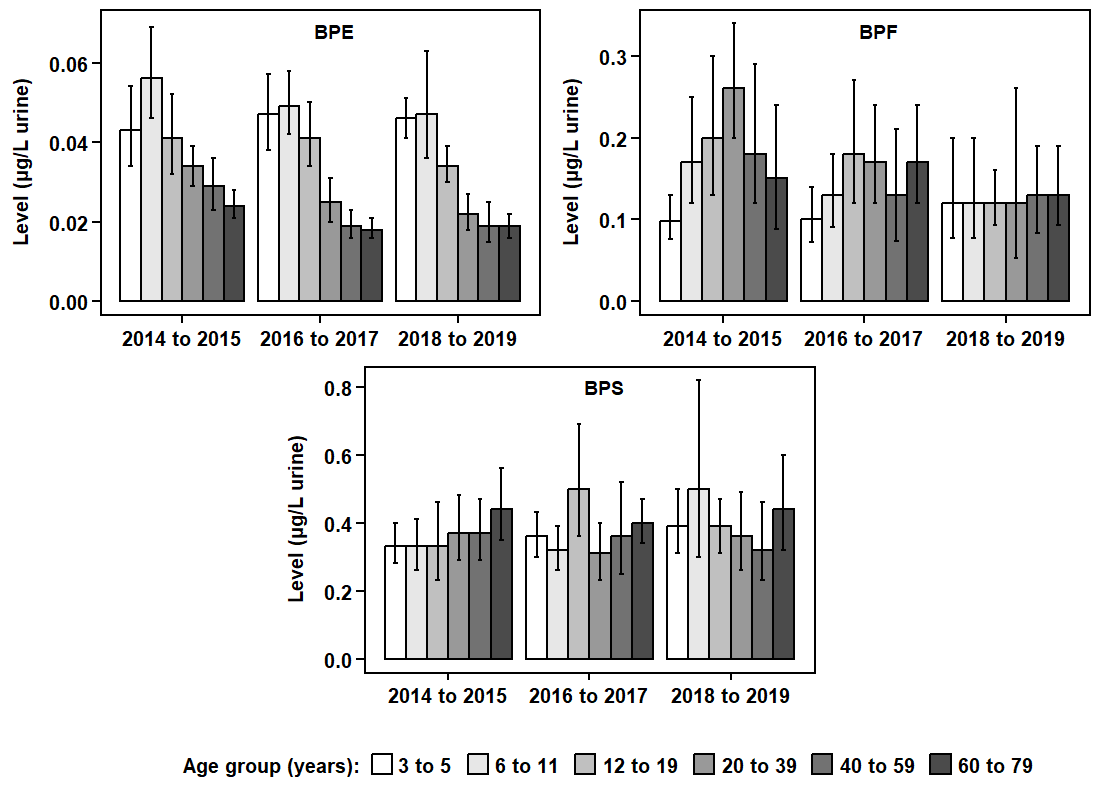
Figure 2: Levels in the Canadian population, by age group
From 2014 to 2019, average levels of BPE were higher in children and adolescents than in adults. Average levels of BPF and BPS were similar across age groups in the most recent collection period, from 2018 to 2019.
Text description
| Chemical | Collection period | Age group (years) | Geometric mean level (µg/L) | 95% confidence interval (µg/L) |
|---|---|---|---|---|
| BPE | 2014 to 2015 | 3 to 5 | 0.043 | 0.034–0.054 |
| BPE | 2014 to 2015 | 6 to 11 | 0.056 | 0.046–0.069 |
| BPE | 2014 to 2015 | 12 to 19 | 0.041 | 0.032–0.052 |
| BPE | 2014 to 2015 | 20 to 39 | 0.034 | 0.029–0.039 |
| BPE | 2014 to 2015 | 40 to 59 | 0.029 | 0.023–0.036 |
| BPE | 2014 to 2015 | 60 to 79 | 0.024 | 0.021–0.028 |
| BPE | 2016 to 2017 | 3 to 5 | 0.047 | 0.038–0.057 |
| BPE | 2016 to 2017 | 6 to 11 | 0.049 | 0.042–0.058 |
| BPE | 2016 to 2017 | 12 to 19 | 0.041 | 0.034–0.050 |
| BPE | 2016 to 2017 | 20 to 39 | 0.025 | 0.020–0.031 |
| BPE | 2016 to 2017 | 40 to 59 | 0.019 | 0.016–0.023 |
| BPE | 2016 to 2017 | 60 to 79 | 0.018 | 0.016–0.021 |
| BPE | 2018 to 2019 | 3 to 5 | 0.046 | 0.041–0.051 |
| BPE | 2018 to 2019 | 6 to 11 | 0.047 | 0.036–0.063 |
| BPE | 2018 to 2019 | 12 to 19 | 0.034 | 0.030–0.039 |
| BPE | 2018 to 2019 | 20 to 39 | 0.022 | 0.018–0.027 |
| BPE | 2018 to 2019 | 40 to 59 | 0.019 | 0.015–0.025 |
| BPE | 2018 to 2019 | 60 to 79 | 0.019 | 0.016–0.022 |
| BPF | 2014 to 2015 | 3 to 5 | 0.098 | 0.076–0.13 |
| BPF | 2014 to 2015 | 6 to 11 | 0.17 | 0.12–0.25 |
| BPF | 2014 to 2015 | 12 to 19 | 0.20 | 0.13–0.30 |
| BPF | 2014 to 2015 | 20 to 39 | 0.26 | 0.20–0.34 |
| BPF | 2014 to 2015 | 40 to 59 | 0.18 | 0.12–0.29 |
| BPF | 2014 to 2015 | 60 to 79 | 0.15 | 0.089–0.24 |
| BPF | 2016 to 2017 | 3 to 5 | 0.10 | 0.073–0.14 |
| BPF | 2016 to 2017 | 6 to 11 | 0.13 | 0.091–0.18 |
| BPF | 2016 to 2017 | 12 to 19 | 0.18 | 0.12–0.27 |
| BPF | 2016 to 2017 | 20 to 39 | 0.17 | 0.12–0.24 |
| BPF | 2016 to 2017 | 40 to 59 | 0.13 | 0.074–0.21 |
| BPF | 2016 to 2017 | 60 to 79 | 0.17 | 0.12–0.24 |
| BPF | 2018 to 2019 | 3 to 5 | 0.12 | 0.078–0.20 |
| BPF | 2018 to 2019 | 6 to 11 | 0.12 | 0.078–0.20 |
| BPF | 2018 to 2019 | 12 to 19 | 0.12 | 0.093–0.16 |
| BPF | 2018 to 2019 | 20 to 39 | 0.12 | 0.053–0.26 |
| BPF | 2018 to 2019 | 40 to 59 | 0.13 | 0.084–0.19 |
| BPF | 2018 to 2019 | 60 to 79 | 0.13 | 0.093–0.19 |
| BPS | 2014 to 2015 | 3 to 5 | 0.33 | 0.28–0.40 |
| BPS | 2014 to 2015 | 6 to 11 | 0.33 | 0.26–0.41 |
| BPS | 2014 to 2015 | 12 to 19 | 0.33 | 0.23–0.46 |
| BPS | 2014 to 2015 | 20 to 39 | 0.37 | 0.29–0.48 |
| BPS | 2014 to 2015 | 40 to 59 | 0.37 | 0.29–0.47 |
| BPS | 2014 to 2015 | 60 to 79 | 0.44 | 0.35–0.56 |
| BPS | 2016 to 2017 | 3 to 5 | 0.36 | 0.30–0.43 |
| BPS | 2016 to 2017 | 6 to 11 | 0.32 | 0.26–0.39 |
| BPS | 2016 to 2017 | 12 to 19 | 0.50 | 0.36–0.69 |
| BPS | 2016 to 2017 | 20 to 39 | 0.31 | 0.23–0.40 |
| BPS | 2016 to 2017 | 40 to 59 | 0.36 | 0.25–0.52 |
| BPS | 2016 to 2017 | 60 to 79 | 0.40 | 0.34–0.47 |
| BPS | 2018 to 2019 | 3 to 5 | 0.39 | 0.31–0.50 |
| BPS | 2018 to 2019 | 6 to 11 | 0.50 | 0.30–0.82 |
| BPS | 2018 to 2019 | 12 to 19 | 0.39 | 0.31–0.47 |
| BPS | 2018 to 2019 | 20 to 39 | 0.36 | 0.26–0.49 |
| BPS | 2018 to 2019 | 40 to 59 | 0.32 | 0.23–0.46 |
| BPS | 2018 to 2019 | 60 to 79 | 0.44 | 0.32–0.60 |
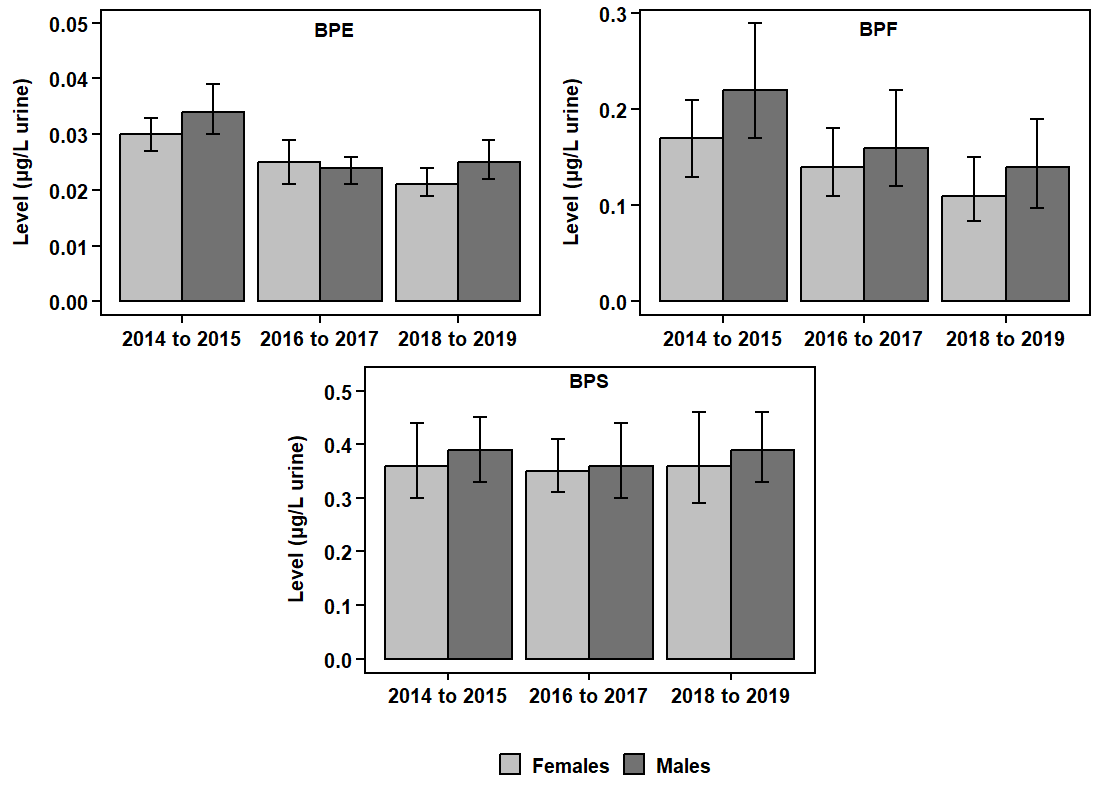
Figure 3: Levels in the Canadian population, by sex
Average levels of BPE, BPF and BPS were similar between sexes.
Text description
| Chemical | Collection period | Sex | Geometric mean level (µg/L) | 95% confidence interval (µg/L) |
|---|---|---|---|---|
| BPE | 2014 to 2015 | Females | 0.030 | 0.027–0.033 |
| BPE | 2014 to 2015 | Males | 0.034 | 0.030–0.039 |
| BPE | 2016 to 2017 | Females | 0.025 | 0.021–0.029 |
| BPE | 2016 to 2017 | Males | 0.024 | 0.021–0.026 |
| BPE | 2018 to 2019 | Females | 0.021 | 0.019–0.024 |
| BPE | 2018 to 2019 | Males | 0.025 | 0.022–0.029 |
| BPF | 2014 to 2015 | Females | 0.17 | 0.13–0.21 |
| BPF | 2014 to 2015 | Males | 0.22 | 0.17–0.29 |
| BPF | 2016 to 2017 | Females | 0.14 | 0.11–0.18 |
| BPF | 2016 to 2017 | Males | 0.16 | 0.12–0.22 |
| BPF | 2018 to 2019 | Females | 0.11 | 0.084–0.15 |
| BPF | 2018 to 2019 | Males | 0.14 | 0.097–0.19 |
| BPS | 2014 to 2015 | Females | 0.36 | 0.30–0.44 |
| BPS | 2014 to 2015 | Males | 0.39 | 0.33–0.45 |
| BPS | 2016 to 2017 | Females | 0.35 | 0.31–0.41 |
| BPS | 2016 to 2017 | Males | 0.36 | 0.30–0.44 |
| BPS | 2018 to 2019 | Females | 0.36 | 0.29–0.46 |
| BPS | 2018 to 2019 | Males | 0.39 | 0.33–0.46 |
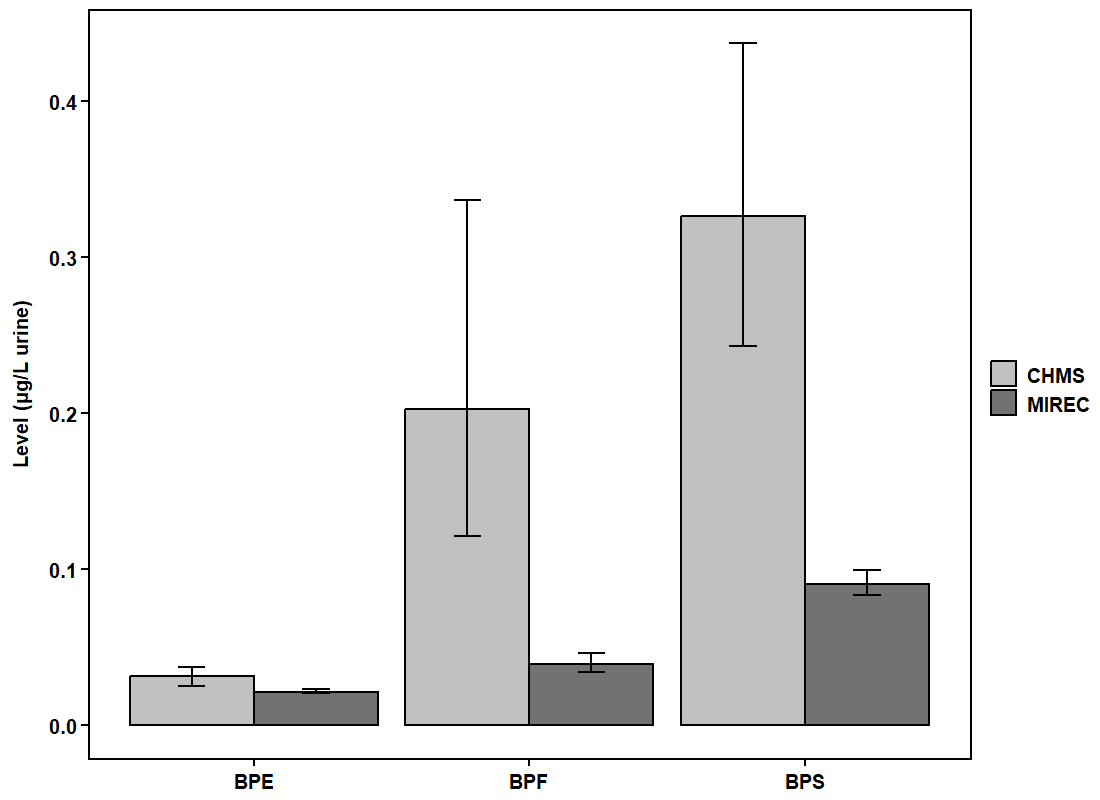
Figure 4: Levels in pregnant people in Canada
Average levels of BPE, BPF and BPS were lower in pregnant people in the MIREC study than in people of child-bearing age (females aged 18 to 49 years) in the CHMS.
Text description
| Chemical | Collection period | Survey | Geometric mean level (µg/L) | 95% confidence interval (µg/L) |
|---|---|---|---|---|
| BPE | 2014 to 2015 | CHMS | 0.030 | 0.025–0.040 |
| BPE | 2008 to 2011 | MIREC | 0.021 | 0.020–0.023 |
| BPF | 2014 to 2015 | CHMS | 0.20 | 0.12–0.34 |
| BPF | 2008 to 2011 | MIREC | 0.040 | 0.030–0.050 |
| BPS | 2014 to 2015 | CHMS | 0.33 | 0.24–0.44 |
| BPS | 2008 to 2011 | MIREC | 0.090 | 0.080–0.10 |
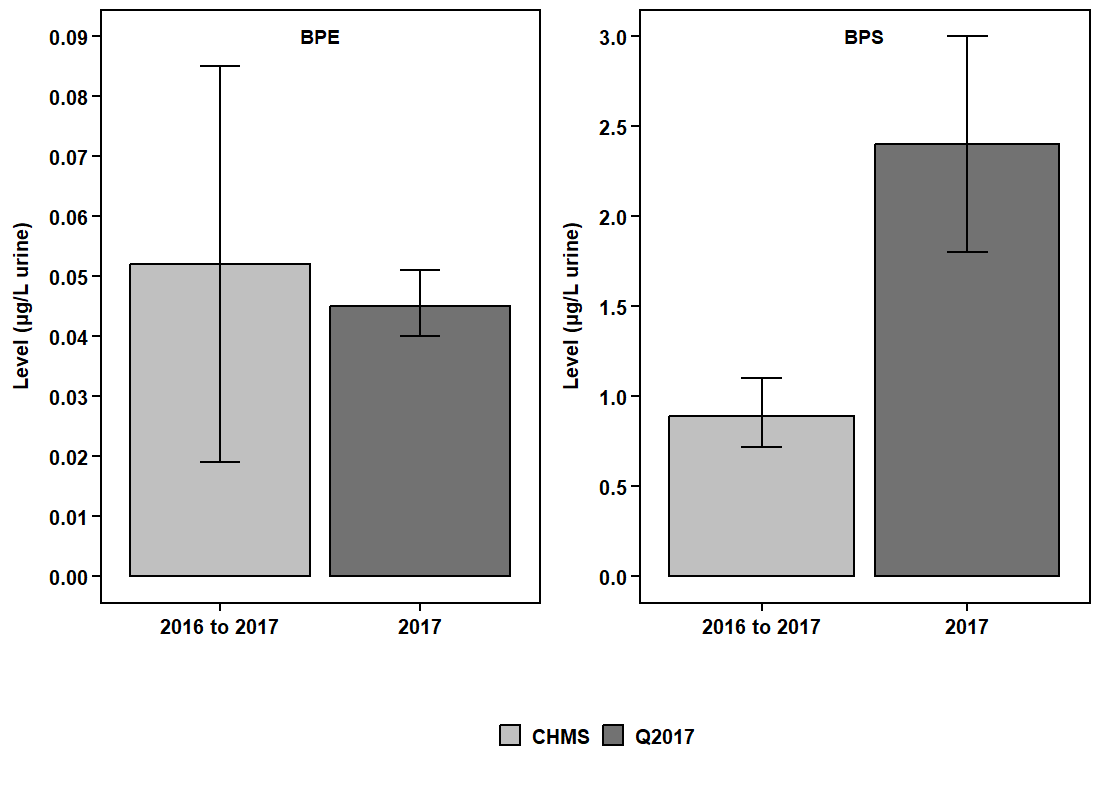
Figure 5: Levels in Inuit living in Nunavik
The average level of BPS was higher among Inuit from the Q2017 survey in Nunavik than in people 16 years of age or older in the CHMS (2016 to 2017). The average levels of BPE were similar.
Text description
| Chemical | Collection period | Survey | Arithmetic mean level (µg/L) | 95% confidence interval (µg/L) |
|---|---|---|---|---|
| BPE | 2016 to 2017 | CHMS | 0.052 | 0.019–0.085 |
| BPE | 2017 | Q2017 | 0.045 | 0.040–0.051 |
| BPS | 2016 to 2017 | CHMS | 0.89 | 0.72–1.1 |
| BPS | 2017 | Q2017 | 2.4 | 1.8–3.0 |
Related links
- Canadian biomonitoring dashboard
- Bisphenol A (BPA) structural analogues and functional alternatives
- Identification of risk assessment priorities (IRAP): results of the 2017-2018 review
- A descriptive analysis of first trimester urinary concentrations of 14 bisphenol analogues in the MIREC Canadian pregnancy cohort
- Non-persistent exposures from plasticizers or plastic constituents in remote Arctic communities: a case for further research
How to cite this webpage
Health Canada. 2024. Bisphenol analogues in people living in Canada. Ottawa, ON. Available: https://www.canada.ca/en/health-canada/services/environmental-workplace-health/reports-publications/environmental-contaminants/human-biomonitoring-resources/bisphenols-analogues-in-people.html
For more information, contact: biomonitoring-biosurveillance@hc-sc.gc.ca