
Validating analytical methods in cannabis testing
On this page
- Who this is for
- Purpose
- Validation tests, methodology and evaluation
- Quality control during analysis
- Equipment
- Reporting of results
Who this is for
This page is for organizations engaged in analytical testing, including the following licences:
- micro-cultivation, nursery and standard cultivation
- micro-processing and standard processing
- analytical testing
Purpose
This page serves as supplementary information to the ICH Q2(R2) Guideline on Validation of Analytical Procedures. This page is specifically for cannabis testing and acknowledges the unique and complex nature of cannabis products.
As outlined in ICH Q2(R2), different approaches to method validation may be acceptable, provided you can offer a scientifically justified rationale. Ultimately, your method validation will help you show that your method is fit for its intended purpose.
Validation tests, methodology and evaluation
General
Subsection 92(1) of the Cannabis Regulations (the Regulations), requires you to use validated methods for testing under sections 90 to 91.1. In practice, you would generally do method validation before implementing a new test method or introducing a new technique or instrument.
You may decide to use an already validated standard method and either conduct:
- method validation
- verification to ensure it performs as intended in your own settings
When you change a validated method, it’s generally expected that you assess the changes on method performance to choose the right approach to validate the change. You should justify your approach and document your justification with your validation results according to requirements from Part 11 of the Regulations.
In the context of method validation, it’s crucial to consider both:
- the sample preparation steps
- the specific instrument’s settings
Validation activities usually include the entire analytical workflow, from sample preparation to data processing and reporting. It’s generally acknowledged that methods are validated with consideration of each type of product for which they are intended.
For traceability, it’s recommended that you document and maintain your validation process and results according to Part 11 of the Regulations. A complete validation package usually comprises, for example:
- your procedure on how you choose and validate new methods
- your data and records (raw data, instrument reports, spreadsheets, calculations)
- your validation plan including each characteristic’s pre-established acceptability criteria
- You would prepare this document before validation
- the test methods you’re validating, including the sample preparation, instrument settings, data processing
- your validation report, which presents the findings of your method validation for each characteristic evaluated and indicates whether they met acceptability criteria
Reference materials and standards
It is recommended to use well-characterized and traceable reference materials and standards throughout the validation process. This is particularly true during accuracy evaluation as it’s the foundation of reliable measurements. The certificate of analysis for these reference materials is typically available and specify their storage conditions and expiration date. Once you open these materials, dilute or mix them with other analytes, it is common practice to assess their stability during its use.
Matrix considerations
In cannabis testing, a variety of products are available, each with different physical and chemical characteristic that can influence analytical performance. Differences in matrix composition can affect:
- stability
- extraction efficiency
- instrument interferences
Common matrices include, for example:
- oils
- candies
- extracts
- beverages
- baked goods
- dried cannabis
- fresh cannabis
- topical products
- chemically derived extracts (for example, semi-synthetic cannabinoids)
Within these categories, more variability may exist and demand specific method validation. For example, topicals may be further separated into cream, transdermal patches, bath bomb, balms. Each would have different chemical characteristics that can have an effect on a method’s performance.
It’s generally recommended to show that you can accurately and reliably measure each analyte in the matrices to which you’ll apply the method.
Specificity
Specificity is the ability of the detection system to produce a unique and characteristic signal for the analyte of interest. This allows the accurate identification and quantification of analytes during testing.
Chromatographic separation
When using a chromatographic technique, you can identify chromatographic peaks by first injecting each reference standard on its own. After you know the retention times and spectral characteristics for each compound, a mixed solution may be more practical.
Make sure you separate the peaks well enough to measure them accurately. If you clearly separate the peaks at the baseline of the chromatogram, looking at the chromatogram is enough. If any peaks overlap, you may need to calculate the resolution. A resolution value of 1.2 or higher is generally accepted as good enough for accurate quantification. For quantitative methods, it’s important to verify the separation using analyte concentrations close to those expected in the sample extracts.
Other substances from the matrix may also be co-eluting and interfering with the substance you’re measuring. These interferences may vary from sample-to-sample and are important to consider during validation and routine testing. For example, certain byproducts of synthesis may interfere with cannabinoids of interest when analysing cannabis extracts, since they may be closely-related in structure. Also, delta-8-THC and delta-9-THC elute closely under most chromatographic conditions due to their structural similarity. Sufficiently separating closely eluting compounds allows for accurate and reliable results.
Identification
For accurate identification, it’s important to verify that the substance you’re measuring is the one you think it is. Some compounds that look or behave similarly can produce almost the same signal in a test. Your method is supposed to be able to tell them apart to avoid misidentification. Substances beyond the scope of your method may be in the products and have an effect on your analysis (for example, containing byproducts of synthesis).
For example, when using chromatography with UV detection, it is recommended to collect the full spectrum rather than measuring at a single fixed wavelength. Comparing the UV spectrum from your sample against a library of known compounds helps reduce the chance of mistaking one peak for another. If mass spectrometry data is available, you can also use the MS spectra to help confirm the identity of the peaks.
If you have a sample that doesn’t contain any of the analytes you’re looking for, you can run it as a matrix blank. This helps spot any interferences from the matrix that might interact with your analytes and influence your measurement.
Recommended data
- For chromatographic methods:
- Record the retention time for each compound (analyte) from their own analysis
- Include spectra (UV or MS) along with the criteria you use to confirm that you correctly identified a peak
- Show the resolution calculations for any pairs of analytes that are close to each other in a chromatogram
- For all type of methods:
- Record data for matrix blanks
- Record data for matrix blanks spiked with the known analytes
- Include any analytes that might be in the product, not just the main ones you’re targeting
Selectivity
Selectivity describes how well a method can measure the target analyte without being influenced by other substances in the sample.
Matrix effects
Special care is needed when using validation guidelines that were originally for pharmaceutical testing. Pharmaceutical samples usually have simple, clean matrices, so those guidelines often require a basic check of selectivity.
As mentioned before, cannabis products, are much more complex. You want to verify that the matrix doesn’t interfere with the measurement. In some cases, no amount of sample preparation will completely remove matrix effects. When this happens, you may wish to take steps to reduce these effects as much as possible, so they don’t negatively change the final result.
You typically verify matrix effects on samples that are representative of the types of samples to be analyzed. It’s up to your laboratory to check what counts as a representative matrix and how to group similar products. For example, you might group gummies and hard candies as a confectionery product type and choose gummies as the representative sample for your validation work. In all cases, you should be able to explain why you chose that representative sample and show that the level of validation you performed is appropriate.
There are several simple ways to check whether your method is affected by matrix effects or selectivity:
- Recovery study: Add known amounts of the analyte (spike) into a representative sample at different concentrations that cover your method’s working range. Then measure the sample with your method, using a calibration curve made in a clean, matrix‑free solvent. If possible, add the analyte before the extraction step so you can also see whether the sample preparation process itself affects the results.
- Regression study: Take the results from the recovery study and plot what you added versus what you measured. Create a regression line. The intercept (where the line crosses the y-axis) should match the concentration you originally measured in the unspiked sample. If it does, it shows that the matrix isn’t distorting the response.
- Comparing calibration curves: Prepare one calibration curve in clean solvent and another using an analyte‑free sample extract (matrix‑matched). If there is no matrix effect at the instrument level, the 2 curves should look similar. Their slopes and intercepts should be almost the same.
Recommended data
- Calculate the recoveries of spiked sample matrices at different concentrations.
- Compile data to justify the lack of any bias in calibration due to matrix effects.
Linearity
It’s important to check that your method gives a signal that increases in a predictable way as the analyte concentration increases. You typically evaluate this relationship (linearity) across the full working range of a method
One approach is to look at a graph of instrument signal versus analyte concentration. If the graph looks linear, you can use statistical analysis to confirm this observation, for example, by calculating a regression line using the least‑squares method.
To show linearity, prepare standard solutions at different concentrations. Plot their measured signals against their known concentrations. It’s generally recommended to use at least 5 calibration points. They need to cover the entire range, from the limit of quantification to the upper limit of quantification.
You can select the right mathematical model (for example, linear or quadratic) and weighting to best fit the relationship. To ensure reliable and comparable results, it’s recommended that you apply these parameters consistently for all calculations during validation and routine analysis.
Finally, remember that the coefficient of determination alone is often not enough to show the lack of bias of a calibration curve, especially at the lower and upper ends.
Recommended data
- Define the mathematical model and weighting that best suits your needs.
- Record:
- the y-intercept
- a plot of the data
- the residual sum of squares
- the coefficient of determination
- the slope of the regression line
- Analyse the deviation of the actual data points from the regression line.
Limit of detection and limit of quantification
The limit of detection is the lowest concentration of an analyte that your method can find as truly present and not just part of the background (noise).
The limit of quantification is the lowest concentration of an analyte that your method can measure reliably, with acceptable precision and accuracy.
The limit of detection is often estimated for the instrument and is commonly based on either:
- a minimum value of signal-to-noise ratio
- the standard deviation of the instrument response for low-level samples or blanks
You calculate the limit of quantification in a similar way to the limit of detection. However, you calculate it at a higher concentration, where the signal is strong enough to measure accurately. It’s defined in a way that it doesn’t exceed the lowest calibration point used in your calibration curve.
When reporting limit of detection and limit of quantification, it’s important to pay attention to the measurement units. A limit of detection based only on instrument, such as signal-to-noise value, reflects only the sensitivity of the instrument. It doesn’t include sample preparation steps that dilute the analytes. Because of this, a reported limit of detection based only on the signal-to-noise often makes the method appear more sensitive than it is.
Example
A sample is prepared.
- You have a sample of 500 mg
- You add 10 mL of solvent
- 1 mL of this solution is diluted to 10 mL
- You do an instrumental analysis
If the instrumental limit of detection has been determined at 1 mcg/mL and we reverse all the dilutions and extraction steps, you can find out how much analyte this would be in the original sample:
- Instrumental analysis
- Limit of detection is 1 mcg/mL
- 1 mL diluted to 10 mL
- Limit of detection is 10 mcg/mL
- Add 10 mL solvent
- Limit of detection is 100 mcg/mL
- Sample 500 mg
- Limit of detection is 200 mcg/g
As a result, a limit of detection of 1 mcg/mL at the instrument means a limit of detection of 200 mcg/g in the original sample when you consider the full sample preparation.
Recommended data
- Describe the method used to determine the limit of detection or limit of quantification.
- Report the limit of detection or limit of quantification.
Important: To accurately demonstrate your method’s capability, it’s recommended that the reported limit of detection or limit of quantification on any certificate of analysis:
- take into account sample weight if applicable
- be in the same units of measurement as the reported results and dilution factors
Range
The range of an analytical procedure is the interval between the lowest and the highest measurement values where the analytical method has been demonstrated to be reliable. This means it gives a suitable signal and produces accurate and precise results.
In practice, the range is determined by validating both linearity and limit of detection or limit of quantification. The upper limit of quantification is the highest point that you have validated on a calibration curve.
Figure 1: Calibration curve
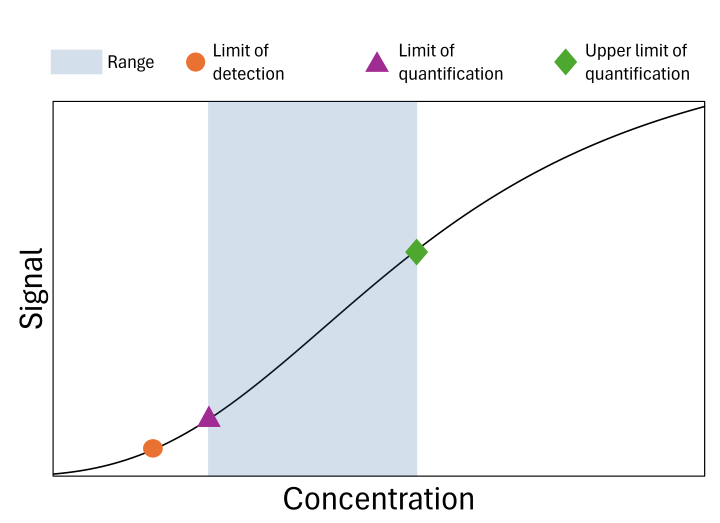
Figure 1: Text description
The figure shows the relationship between analyte concentration and instrument response. The limit of detection is the lowest detectable concentration, while the limit of quantification marks the lowest concentration that can be quantified reliably. Between the limit of quantification and the upper limit of quantification, the response is linear and suitable for accurate quantification. Above the upper limit of quantification, the response becomes nonlinear, and samples generally require dilution for reliable measurement.
Recommended data
- Using the same units as the calibration curve.
- Make sure the results from your sample fall between the limit of quantification and the upper limit of quantification.
- If a result is lower than the calibration curve, report it as being below the limit of quantification or give a value such as “<0.01 mg/g”.
- If a result is higher than the upper limit of quantification, adjust the sample preparation (for example, dilute the sample), so the measurement falls within the validated range.
Accuracy
Accuracy is a critical feature describing how close your measured value is from the “true” value. It’s recommended to validate accuracy across the full range of results your method is intended to report. Accuracy is typically demonstrated through comparison of the measured results with expected value, using normal test conditions. For example, in the presence of sample matrix and using the method’s sample preparation steps.
The “expected value” used to calculate accuracy usually refers to a certified value of a proper reference material.
There are several ways to check the accuracy of your method:
- Reference material comparison: You use this method to measure a sample with a known, certified value (such as a reference material or a well‑characterized impurity). You compare the measured result with the expected value to see how close they are.
- Recovery (spiking) study: You add (spike) a known amount of the analyte into a blank matrix or into a real sample. You compare the results from the unspiked and spiked samples to find out how much of the analyte you can accurately recover using the full method. This is useful when you can’t perfectly reproduce the full matrix.
- Orthogonal procedure comparison: You compare the results from the method being validated with results from another well‑established method (orthogonal technique) whose accuracy has already been demonstrated.
Special considerations for cannabis analysis
The analysis of cannabinoids and contaminants in cannabis and cannabis products presents certain challenges when undertaking accuracy validation and verification:
- reference materials that match samples you are analyzing in cannabinoid composition and concentration aren’t always available
- reference materials such as standard solutions of cannabinoids that you could use in recovery studies are often available at maximum concentrations of 1 to 10 mg/mL
- the cannabis products tested include many different sample types that vary in cannabinoid levels and matrix complexity
For example, some products contain the analyte at such high levels that the “extraction” becomes essentially a dilution step. In such cases, it may not be possible to do recovery studies on the undiluted sample. Instead, checking recovery after dilution and before instrument analysis allows you to verify that the final preparation or instrumental analysis doesn’t introduce interferences that could influence accuracy.
Recommended data
- Collect accuracy data on samples similar to the samples you are analyzing.
- For the recovery study, do multiple determinations at different concentrations levels within the reportable range of the method.
Precision
You preferably check precision using real homogeneous samples. If no suitable samples are available, you can make you own by spiking either:
- a known amount of the analyte to a blank matrix
- a sample so it contains the right concentration of the analyte
Precision is divided into 3 types:
- Repeatability: The precision under the same operating conditions over a short interval of time
- Repeatability is also called intra-assay precision
- Intermediate precision: The precision within the laboratory under varied operating conditions, such as:
- different days
- different analysts
- different equipment
- different environmental conditions
- Reproducibility: The precision between laboratories
Recommended data
You can verify the standard deviations and the relative standard deviation for each type of precision validated. Ideally, a minimum of 6 measurements are recommended for each type of precision.
Robustness
Robustness describes the reliability of an analysis when there are slight variations in the method’s condition. You can evaluate it either during the development or the validation of your method.
Recommended data
A proper approach to validate your method robustness would be to test normal and expected variations in your process by varying your conditions. The variations studied will depend largely on the type of analysis, but would often include:
- verifying the influence of either:
- the temperature and flow rate for gas chromatography analysis
- the variations in the preparation of mobile phases for liquid chromatography analysis
- establishing the duration of sample extraction steps
- studying the stability of solutions over time and in different storage conditions
- determining the effects of different lots of chromatographic columns on separation
Quality control during analysis
Quality controls are routine checks that help make sure an analytical method keeps working the way it should on a day-to-day basis, not just during the original validation. Because instruments, reagents, and sample types can change over time, these checks act as a form of continuing validation. They confirm that the method remains accurate, consistent, and reliable during regular use. By monitoring key performance indicators, such as calibration stability, instrument performance, analyte recovery, precision, and matrix effects, laboratories can:
- quickly identify trends
- find problems early
- maintain confidence in the results they report
The acceptance criteria for each quality control are usually determined beforehand and included in a relevant standard operating procedure.
| Validation characteristic | Suggested quality controls (during routine analysis) | Purpose and notes |
|---|---|---|
|
Specificity |
|
Ensures analytes remain properly resolved as the column ages and conditions change |
|
Selectivity |
|
Verifies that the method performs correctly across realistic sample types and matrix variations |
|
Linearity |
|
Ensures the calibration remains accurate and stable throughout the analysis sequence |
|
Accuracy |
|
Confirms the method is producing correct results and flags any drift in extraction, preparation, or instrument response |
|
Precision |
|
Detects variability within a run (repeatability) and across runs, analysts, or days (intermediate precision) |
Equipment
Measuring equipment and analytical instrumentation
Although not normally covered in validation references, the performance of a method of analysis directly depends on the proper use and maintenance of equipment and instrumentation. Ensuring that your instruments are functioning correctly supports accurate results and helps minimize downtime due to instrument failures. As part of routine verification, it may be useful to plan checks for your instruments. For example, it’s recommended to ensure that:
- your instruments are properly calibrated.
- you schedule and perform preventive maintenance of instrumentation as required
- you have indicators and tools to decide when you would need to recalibrate an instrument
- you routinely verify and calibrate analytical measuring equipment, such as scales, pipets, automatic diluters
System suitability testing
System suitability testing is an integral part of many analytical procedures. System suitability addresses 3 performance aspects of a method at its time of use:
- that you have properly set up the instrument for analysis
- that the instrument has performed acceptably throughout the analysis
- that the instrument as set up can perform at the same level it performed at during its qualification (or during validation)
The type and the scope of a system suitability test will vary depending on:
- the type of analysis
- the instrumentation used
- the other quality control required by your method of analysis
Reporting of results
How you report your analytical results is an important component of your method’s performance. It directly affects how you interpret and use the results. Clear, consistent and transparent reporting practices help ensure that results are meaningful and reflective of your method’s capabilities.
Units of measurement
The units of measurement indicate the magnitude of your results. It allows for correct interpretation and comparison with established limits (for example, for contaminants). It’s generally recommended that :
- you express results, measurement uncertainty and limit of detection or limit of quantification in the same units of measurement
- you calculate results using the actual sample weights and not a target or prescribed weights
- if unit conversion is necessary (for example, mg/g to % w/w), you clearly describe the formula in the methods or procedures
Reporting of equivalencies and use of corrective factors
In cannabis testing, it’s common to report calculated values. When applicable, it is good practice to clearly describe in your procedure the formula used to calculate the “Total” amounts of cannabinoids to support transparency and consistency. These calculations generally incorporate both carboxylated and decarboxlyated forms. For example, “Total THC” would include THC and THCA.
Significant digits
Significant digits reflect the accuracy and precision of your method. Arbitrarily choosing a fixed number of decimals isn’t scientifically supported. It doesn’t accurately represent the method’s performance. A good understanding of significant digits is important, and you’re encouraged to :
- set up a procedure for the correct rounding off of the number of digits before issuing a result
- present the limit of detection or limit of quantification and measurement uncertainty with consistent and proper significant digits
- round the reported results to include only the proper number of significant digits
- including too many significant digits in the certificate of analysis gives a false impression of the precision of your method
Measurement of uncertainty
Measurement of uncertainty provides important context for interpreting analytical results and understanding the level of confidence associated with them. To ensure reliable reporting, it’s recommended that :
- the laboratory have a procedure for estimating measurement uncertainty
- the measurement of uncertainty be available for each method of analysis