
Grain safety research to support market access for Canadian grain
Trace Organics and Trace Elements Analysis Program
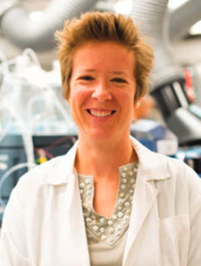
Dr. Sheryl Tittlemier
Research scientist/program manager
Trace Organics and Trace Elements Analysis
sheryl.tittlemier@grainscanada.gc.ca
Team members
Research scientist/program manager
- Dr. Sheryl Tittlemier
Chemists
- Mei Huang
- Hoangkim Luong
- Suresh Patel
Technicians
- Lianna Bestvater
- Michael Bestvater
- Richard Blagden
- Daniel Bockru
- Jason Chan
- Joshua Crellin
- Dainna Drul
- Valentina Timofeiev
- Michael Tran
- Tanya Zirdum
The Trace Organics and Trace Elements Analysis Program focuses on researching and monitoring the pesticides, mycotoxins, and trace elements, particularly heavy metals, found in grain. We want to understand what causes these substances to accumulate in grain and how they behave during processing. We also evaluate the accuracy and precision of the methods we use for sampling and analyses, and look for ways to improve them. The information we gather and share helps instill confidence in the safety and reliability of Canadian grain for producers, commodity associations, exporters, government partners, and end users.
Sampling plans for measuring mycotoxins
Sampling methods and sample processing are the most important steps in the analytical process for many grain contaminants. The open access Mycotoxin Sampling Tool from the Food and Agriculture Organization lets users change parameters, such as sample size and sample number, to estimate the risk of misclassifying cargos as compliant with defined maximum levels of contaminants without having to perform laboratory analyses. We evaluated the potential of data to vary using different sampling plans and found that the current Codex General Standard on Contaminants and Toxins in Food and Feed sampling plans for maize and wheat could result in a total measurement error greater than or equal to 90% of the current and proposed maximum levels for ochratoxin A in wheat and aflatoxins in maize, respectively. We also found that increasing the laboratory sample size from 1 kg to 5 kg had the greatest impact on minimizing the variance due to sampling (Figure 1).
A better understanding of food safety
In another study, we looked at what happens to two chemicals, cadmium and glyphosate, when pasta made from durum wheat is cooked. Cadmium is a heavy metal that is present in soil and can accumulate in durum, while glyphosate is a herbicide used in weed management. We partnered with the durum breeding group from Agriculture and Agri-Food Canada at Swift Current, Saskatchewan, to produce durum wheat containing a range of cadmium and glyphosate levels. With help from other programs in the Grain Research Laboratory, the durum was milled and made into dry spaghetti. We found that the cooked spaghetti contained less glyphosate, but that the amount of cadmium stayed the same. We also found that more glyphosate than cadmium moves from the spaghetti into the water used to cook the pasta. By cooking the spaghetti for 9 minutes to al dente, approximately 65% of the glyphosate in the pasta transferred into the cooking water (Figure 2). This study helps us better understand how these chemicals behave during cooking and helps regulators set realistic and relevant regulations to manage the presence of these chemicals in grain.
Improved technology reduces bias
In the past year we also improved our handling and processing of grain samples for the cargo monitoring program by modifying technology used in our laboratory. When we receive 10-kilogram samples for contaminant analysis, we make sub-samples using a rotary sample divider. We tested new rotary dividers with canola, flaxseed, peas, soybeans and wheat, and observed that variable amounts of grain ricocheted off the divider’s carousel and accumulated in the corners of the housing instead of being directed into the carousel receptacles (Figure 3). The mass of lost sample was inversely correlated with the mass of individual kernels, with canola (average mass 0.004 g) affected the most and peas and soybeans (average mass 0.2 g) affected the least.
To minimize sample loss, we had a metal collar fabricated and installed on the divider carousel (Figure 4). The modification resulted in a decrease by at least 100x in the amount of sample lost, falling from 3% to 0.03% for peas and 9% to 0.06% for canola. This improvement in equipment used for sample processing will prevent lighter, lower quality kernels, from being lost and biasing the results of grain quality and safety assessments.

Graph data
| Laboratory sample size (kg) | 1 | 5 | 5 | 10 | 10 |
|---|---|---|---|---|---|
| Test portion size (g) | 25 | 25 | 50 | 25 | 50 |
| Sampling variance | 19 | 3.9 | 3.9 | 1.9 | 1.9 |
| Sample preparation variance | 0.26 | 0.26 | 0.13 | 0.26 | 0.13 |
| Analysis variance | 0.82 | 0.82 | 0.82 | 0.82 | 0.82 |
| Total variance | 20.08 | 4.98 | 4.85 | 2.98 | 2.85 |

Graph data
| Cooking time (minutes) | Test material B | Test material C |
|---|---|---|
| 0 | 0 | 0 |
| 3 | -49.9 | -48.1 |
| 5 | -56.6 | -55.5 |
| 7 | -61.3 | -60.9 |
| 9 | -65.0 | -66.2 |
| 11 | -68.0 | -67.3 |
| 13 | -71.7 | -70.7 |
| 15 | -73.5 | -73.0 |


Recent publications
- Tittlemier, S.A., Bestvater, L., Chan, J., Timofeiev, V., Richter, A., Wang, K., Ruan, Y., Izydorczyk, M. and B.X. Fu. 2023. Diverging fates of cadmium and glyphosate during pasta cooking. Food Addit. Contam. Part A 40(11): 1459-1469. https://doi.org/10.1080/19440049.2023.2264976
- Tittlemier, S.A. and T.B. Whitaker. 2023. Current sampling plans can introduce high variance in mycotoxin testing results as demonstrated by the online FAO Mycotoxin Sampling Tool. World Mycotoxin J. 16(2): 115-126. https://doi.org/10.3920/WMJ2022.2804