
Quality of Canada Western Red Spring wheat in 2026
This report presents harvest quality data for Canada Western Red Spring (CWRS) wheat grown in 2026. Wheat samples were submitted to the Canadian Grain Commission’s Harvest Sample Program by producers. Quality data are compiled from the results of analytical tests performed in the Grain Research Laboratory and will be updated as more samples are received.
Data as of October 6, 2026
Data fields will remain empty until a representative number of samples has been collected to validate the information.
- Data are unlikely to represent samples harvested within 2 weeks of the date of this report.
- The number of samples reported for each grade may not correspond to the actual distribution of grades in a crop year.
Canada Western Red Spring wheat
CWRS is the most widely grown class of wheat in western Canada. It is well known for its excellent milling performance, producing high yields of flour with low ash content and minimal protein loss. The high protein content and very high water absorption of CWRS flour results in dough that is strong yet extensible. This makes it ideal for the production of pan bread with a large loaf volume. Due to the high protein and good gluten strength of its flour, CWRS wheat is used extensively, either alone or in blends with weaker wheats, in a range of products such as hearth breads, flat breads, steamed breads, and noodles.
Protein data by grade and by province
| Province | Number of samples | Mean | SD |
|---|---|---|---|
| Manitoba | 86 | 14.5 | 0.8 |
| Saskatchewan | 71 | 13.8 | 1.2 |
| Alberta and B.C. | 45 | 13.4 | 1.9 |
| Western Canada | 202 | 14.0 | 1.3 |
| Province | Number of samples | Mean | SD |
|---|---|---|---|
| Manitoba | 112 | 14.4 | 0.8 |
| Saskatchewan | 64 | 13.4 | 1.2 |
| Alberta and B.C. | 26 | 12.3 | 1.4 |
| Western Canada | 202 | 13.8 | 1.3 |
| Province | Number of samples | Mean | SD |
|---|---|---|---|
| Manitoba | 51 | 14.7 | 0.9 |
| Saskatchewan | 14 | NSFootnote * | NS |
| Alberta and B.C. | 4 | NS | NS |
| Western Canada | 69 | 14.4 | 1.2 |
| Province | Number of samples | Mean | SD |
|---|---|---|---|
| Manitoba | 27 | 14.9 | 0.9 |
| Saskatchewan | 9 | NS | NS |
| Alberta and B.C. | 9 | NS | NS |
| Western Canada | 45 | 14.6 | 1.2 |
| Province | Number of samples | Mean | SD |
|---|---|---|---|
| Manitoba | 278 | 14.6 | 0.8 |
| Saskatchewan | 162 | 13.6 | 1.3 |
| Alberta and B.C. | 87 | 13.3 | 1.8 |
| Western Canada | 527 | 14.0 | 1.3 |
Protein data by grade and by crop region
Ten crop regions in western Canada were designated for Canada Western Red Spring (CWRS) wheat based on similar environmental characteristics. The direction of grain movement, political boundaries and production (seeded area) were also considered when the regions were designated. Areas with low production were grouped with areas with high production to ensure that each region will provide a sufficient number of samples for analysis.
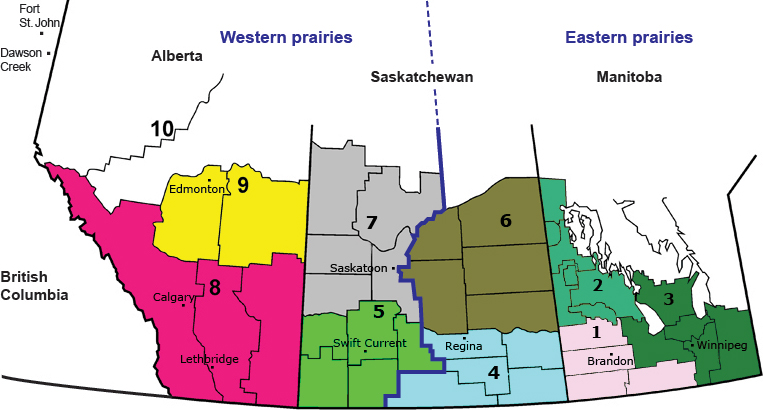
Text description
- Region 1: southwestern Manitoba
- Region 2: central western Manitoba
- Region 3: southeastern Manitoba
- Region 4: southeastern Saskatchewan
- Region 5: southwestern Saskatchewan
- Region 6: central eastern Saskatchewan
- Region 7: central western Saskatchewan
- Region 8: southern Alberta
- Region 9: central eastern Alberta
- Region 10: northern Alberta
| Region | Number of samples | Mean | Standard deviation |
|---|---|---|---|
| 1 | 35 | 14.4 | 0.9 |
| 2 | 13 | NS | NS |
| 3 | 38 | 14.7 | 0.7 |
| 4 | 23 | 14.0 | 1.1 |
| 5 | 19 | NS | NS |
| 6 | 13 | NS | NS |
| 7 | 16 | NS | NS |
| 8 | 39 | 13.6 | 1.9 |
| 9 | 1 | NS | NS |
| 10 | 5 | NS | NS |
| Region | Number of samples | Mean | Standard deviation |
|---|---|---|---|
| 1 | 66 | 14.5 | 0.8 |
| 2 | 14 | NS | NS |
| 3 | 32 | 14.4 | 0.9 |
| 4 | 21 | 13.6 | 1.3 |
| 5 | 9 | NS | NS |
| 6 | 15 | NS | NS |
| 7 | 19 | NS | NS |
| 8 | 12 | NS | NS |
| 9 | 7 | NS | NS |
| 10 | 7 | NS | NS |
Grading factor data
Producer samples submitted to the Harvest Sample Program were graded using the current grading factor tolerances found in the Official Grain Grading Guide. The table below lists the grading factors that led to downgrading in this year’s wheat samples and the percentage of samples that were downgraded for each grading factor. A sample can be downgraded if it does not meet the tolerances for 1 or more grading factors.
Grading factors and the percentage of samples downgraded for CWRS wheat samples from all provinces as of October 6, 2026
| Samples | No. 1 CWRS | No. 2 CWRS | No. 3 CWRS | Feed | Sample |
|---|---|---|---|---|---|
| Number of samples | 202 | 202 | 69 | 45 | 8 |
| % of total | 38.4 | 38.4 | 13.1 | 8.6 | 1.5 |
| Grading factor | No. 1 CWRS | No. 2 CWRS | No. 3 CWRS | Feed | Sample |
|---|---|---|---|---|---|
| Ergot (ERG) | 0.0 | 0.0 | 0.0 | 15.6 | 12.5 |
| Frost (FR) | 0.0 | 0.5 | 0.0 | 0.0 | 0.0 |
| Fusarium damage (FUS DMG) | 0.0 | 49.5 | 76.8 | 46.7 | 62.5 |
| Heated (HTD) | 0.0 | 0.0 | 0.0 | 0.0 | 12.5 |
| Hard vitreous kernel (HVK) | 0.0 | 54.5 | 0.0 | 0.0 | 0.0 |
| Midge damage (MDGE) | 0.0 | 1.5 | 0.0 | 0.0 | 0.0 |
| Mildew (MIL) | 0.0 | 12.4 | 10.1 | 0.0 | 0.0 |
| Matter other than cereal grains (MOTCG) | 0.0 | 2.5 | 5.8 | 0.0 | 12.5 |
| Non-registered variety (NON REGV) | 0.0 | 0.0 | 0.0 | 11.1 | 0.0 |
| Severely sprouted kernels (SEVSPTD) | 0.0 | 5.0 | 5.8 | 22.2 | 0.0 |
| Sawfly damage (SFLY DMG) | 0.0 | 0.5 | 0.0 | 0.0 | 0.0 |
| Shrunken (SHR) | 0.0 | 0.0 | 0.0 | 6.7 | 0.0 |
| Total foreign material (TFM) | 0.0 | 1.0 | 0.0 | 0.0 | 0.0 |
| Total sprouted kernels (TSPTD) | 0.0 | 5.0 | 14.5 | 6.7 | 0.0 |