
Canada Water Act Annual report to Parliament 2022–2023
Minister’s message
It is with great pleasure that I present the 2022-2023 Canada Water Act Annual Report to Parliament and Canadians. In the spirit of transparency and accountability, and as required by the Canada Water Act, this report describes operations under the Act for 2022-2023.
This is a unique time for freshwater governance in Canada with the creation of the Canada Water Agency within Environment and Climate Change Canada. This is an interim step, as the Government of Canada introduced legislation in 2023 that would establish the Canada Water Agency as a stand-alone entity. The Agency provides leadership, effective federal collaboration, and improved coordination and collaboration with provinces, territories, and Indigenous peoples to proactively address national and regional transboundary freshwater challenges and opportunities. Budget 2023 announced significant investments in the Canada Water Agency and major waterbodies across the country, including the Great Lakes, Lake Winnipeg, Lake of the Woods, the St. Lawrence River, the Fraser River, the Wolastoq/Saint John River, the Mackenzie River, and Lake Simcoe.
Water challenges have increased due to population growth, industrial development, and agricultural intensification. Climate change has advanced, exacerbating water issues. In addition, the United Nations Declaration on the Rights of Indigenous Peoples Act came into force in 2021, requiring the Government of Canada, in consultation and cooperation with Indigenous peoples, to “take all measures necessary to ensure the laws of Canada are consistent with the Declaration.” In addition, the Agency has initiated a review of the Canada Water Act to reflect Canada’s freshwater reality.
This report describes the varied operations conducted under the authority of the Act, including, for example, the work of various water boards created through federal-provincial-territorial agreements and arrangements concluded under the Act. Important water quantity and quality monitoring and research in Canada’s diverse watersheds are key activities also documented by the report.
We are fortunate as Canadians to be the stewards of millions of rivers and 20 percent of the world’s fresh water. The Government of Canada is committed to protecting these waters today, and for future generations.
The Honourable Steven Guilbeault
Minister of Environment and Climate Change
1 Introduction
The Canada Water Act (the Act) is administered by the Minister of Environment and Climate Change. It provides a framework for collaboration among federal, provincial and territorial governments in matters relating to water resources. To date, over 40 agreements on water quality and quantity have been formally authorized under the Act. Environment and Climate Change Canada’s (ECCC) scientific efforts in water management are enabled by these agreements, allowing ECCC to conduct water research and monitor the conservation, development, and use of Canada’s water resources.
Part I of the Act provides for the establishment of federal-provincial/territorial arrangements and programs in relation to water resource management. It also enables the Minister of Environment and Climate Change, independently or with others, to conduct research, collect data, and establish inventories on water resources. This part of the Act has been used since the Act came into force in 1970.
Part II of the Act provides for the establishment of federal-provincial/territorial management agreements applicable to designated water quality management areas that are federal waters, or where water quality has become a matter of urgent national concern. It also allows for the planning and implementation of water quality management programs and prohibits pollution in the designated areas. This part of the Act has never been used.
Part III of the Act provided for regulating the concentration of nutrients in cleaning agents and water conditioners. This part was repealed in 1985 and is now incorporated into the Canadian Environmental Protection Act, 1999 (sections 116–119).
Part IV of the Act contains provisions for the general administration of the Act, including annual reporting to Parliament, inspection and enforcement, advisory committees, and public information programs.
Water management in Canada is a responsibility shared between federal, provincial, territorial, and Indigenous governments. The federal government is involved in water-related areas such as fisheries, pollution prevention, shipping and navigation, international relations, domestic transboundary waters, and the creation and management of protected areas. The federal government is also responsible for management of water on federal lands.
The Act is one piece of a legislative framework providing the federal government extensive water management authorities across Canada. Other key pieces of federal legislation with direct links to water management include the following: Department of the Environment Act; Fisheries Act; Migratory Birds Convention Act, 1994; Canadian Environmental Protection Act, 1999; Arctic Waters Pollution Prevention Act; International Boundary Waters Treaty Act; International River Improvements Act; and Canadian Navigable Waters Act.
Canadian provinces and territories have significant responsibility over areas of water management and protection within their borders, including water allocation and use, drinking water and wastewater services, source water protection, managing inland fisheries, aquatic species at risk, and invasive species.
Under many historic and modern treaties, and self-government agreements, Indigenous peoples have water-related rights. Indigenous peoples are also involved in transboundary water management, including through water management boards. Water management also intersects with Aboriginal and treaty rights recognized and affirmed by section 35 of Canada’s Constitution Act, 1982.
This report describes a wide range of federal operations conducted under the authority of the Act between April 1, 2022 and March 31, 2023. This includes participation in federal-provincial/territorial agreements and arrangements, significant water monitoring and research, and public information programs. It also includes work done under the Act to safeguard the water quality and quantity of Canada’s watersheds.
1.1 Highlights of the 2022–2023 annual report
- This year marked the successful completion of the prediction component of Environment and Climate Change Canada’s National Hydrological Service (NHS) – Transformation Initiative. As a result, the National Surface and River Prediction System (NSRPS), an integrated atmospheric, land surface and streamflow prediction system is now operational and available online. The new predictive products and services developed by ECCC are used to support modelling activities for transboundary studies and provincial/territorial water management and flood/drought forecasting.
- The Government of Canada created the Canada Water Agency to improve freshwater management in Canada by providing leadership, effective collaboration federally, and improved coordination and collaboration with provinces, territories, and Indigenous peoples to proactively address national and regional transboundary freshwater challenges and opportunities.
- The application of Canadian Aquatic Biomonitoring Network (CABIN) monitoring by non-government organizations and Indigenous groups and governments is growing. Interest in CABIN has broadened to include non-scientists and citizen scientists. In 2022-2023, ECCC focused on evolving and adapting the CABIN training and certification program and resources to be more accessible and inclusive of all participants. Participants are trained to collect data using nationally standardized protocols, share data through a web-accessible CABIN database, and assess freshwater health using specific analytical tools.
- In 2022-2023, Environment and Climate Change Canada (ECCC) completed work on 53 cableways across Canada. Since the start of the NHS Transformation Initiative in 2018, the total number of cableways requiring remedial attention has been significantly reduced. Cableway remediation has reached a stage where there can be sustainable operations, with continued and vigilant life-cycle management. It is important to note that impacts from natural disasters (e.g., floods and fires) are starting to be an imposition on regular operational life cycle management requirements.
1.2 Freshwater action
The Government of Canada remains committed to advancing the federal freshwater agenda, which includes strengthening and expanding the Freshwater Action Plan, creating a Canada Water Agency, and advancing the review of the Canada Water Act.
In Budget 2023, the Government of Canada announced a major investment in fresh water, including:
- $650 million over ten years, starting in 2023-2024, to support monitoring, assessment, and restoration work in the Great Lakes, Lake Winnipeg, Lake of the Woods, St. Lawrence River, Fraser River, Saint John River, Mackenzie River, and Lake Simcoe
- $22.6 million over three years, starting in 2023-2024, to support better coordination of efforts to protect freshwater across Canada
- $85.1 million over five years, starting in 2023-2024, and $21 million ongoing thereafter to support the creation of the Canada Water Agency
Budget 2023 also committed to the involvement of Indigenous peoples in the implementation of the Freshwater Action Plan, through greater engagement, and seeking Indigenous advisory expertise, especially from women who are the traditional “water carriers” in Indigenous communities.
Following the establishment of a Canada Water Agency, the Government of Canada has initiated review of the Canada Water Act to reflect Canada’s freshwater reality.
2 Freshwater monitoring
ECCC is the federal department responsible for collecting, interpreting, and providing critical standardized water quantity and water quality information that Canadians and their institutions need to make informed water management decisions to protect and provide stewardship of fresh water in Canada.
ECCC, in collaboration with provincial and territorial governments and others, conducts three types of monitoring in fresh water across Canada to obtain information on water quantity, freshwater quality, and biological condition. In a few cases, Indigenous peoples, institutions, or volunteers assist with monitoring. Hydrometric agreements concluded under the authority of the Canada Water Act provide the framework for these monitoring activities.
2.1 Water quantity monitoring
ECCC provides for the collection, interpretation, and dissemination of surface water quantity data and information that is vital to meet both water management and environmental needs across the country.
Hydrometric agreements
ECCC relies on agreements with the provinces and territories to support the evolution of the hydrometric network and associated services to respond to the needs of Canadian populations. These agreements have been administered cooperatively since 1975 and, except for Newfoundland and Labrador, New Brunswick, and Saskatchewan, have been renewed since 2008. In addition, ECCC is a co-signee of the annual Memorandum of Agreement on Water with the province of Prince Edward Island. The intent of the Agreement is to coordinate the efforts of the provincial and federal governments to monitor the health of aquatic ecosystems, including water quantity, on PEI to ensure that the sustainability of the province’s water resources is maintained for environmental, social, and economic benefit.
2.1.1 National hydrometric monitoring network
During 2022-2023, a number of small adjustments were made to the national hydrometric monitoring network. Detailed hydrometric monitoring network changes are provided in section “2.4 Monitoring information by region”. The national hydrometric monitoring network consisted of 2922 hydrometric monitoring stations (see Table 1 and Figure 1). During this period, ECCC operated 2256 of these hydrometric stations. Of the ECCC-operated stations, 1164 were fully or partially federally funded. The remaining stations were operated by ECCC on behalf of provincial and territorial governments or a third-party interest, and cost-sharing was based on specific needs and requirements (see Table 1). In Quebec, the Ministry of Sustainable Development, Environment and the Fight against Climate Change operated 236 stations, some funded in whole or in part by the Government of Canada. The provinces of Manitoba and Saskatchewan also operate a significant portion of the stations in their jurisdictions.
What is a cableway?
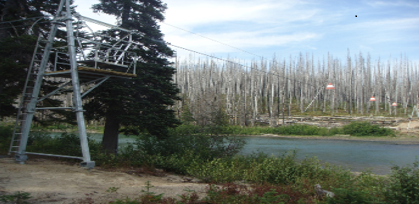
A cableway is a structure that allows technicians to conduct a streamflow measurement above a river cross section. The cable car houses the technician and their measuring equipment. The technician pulls themselves across the river cross section stopping to take streamflow measurements at defined intervals based on the width of the river.
The National Hydrometric Service Transformation Initiative, which began in 2018, received funding to address 360 deteriorating cableways and other contaminated hydrometric monitoring sites across Canada. In 2022-2023, although there were still minor lingering effects from COVID-19 on the delivery of the national work plan, ECCC was able to complete work on 53 cableways. This work included the repair/retrofitting of 38 cableways and the removal/decommissioning and site remediation at 15 locations. Significant progress has been made since 2018; to date 224 cableways have been either repaired, repurposed, or replaced with alternative technologies through the Initiative. (Note that this number has decreased since last year as a few previously repaired stations were damaged during environmental disasters and now require repair once again.)
The total number of cableways requiring remedial attention is much lower than five years ago. Currently, the status of the cableway remediation has reached a stage where there can be sustainable operations with continued and vigilant life-cycle management of the infrastructure. It is important to note, that impacts from more frequent natural disasters (e.g., floods and fires) is starting to be an imposition on managing regular operational life cycle management requirements, as infrastructure has been, and may continue to be, destroyed or damaged by these events.
In addition to the work on cableways, ECCC has remediated and decommissioned 27 sites in the past year, including legacy abandoned creosote wells and sites with residual contaminants, such as mercury and poly-aromatic hydrocarbons.
Figure 1: National hydrometric monitoring network

Long description for Figure 1
Figure 1 is a map of Canada indicating the location of 2,922 hydrometric monitoring stations.
ECCC-operated monitoring stations that are federally funded, cost-shared, and provincially or territorially funded are indicated by symbols.
| Province/territorya | Federal | Cost-sharedb | Province/territory | Third party | Non-ECCC-operated (various cost arrangements) |
Total by province or territory |
|---|---|---|---|---|---|---|
| Alberta | 80 | 159 | 159 | 42 | 57 | 497 |
| British Columbia | 50 | 186 | 216 | 1 | 6 | 459 |
| Manitoba | 31 | 81 | 112 | 0 | 178 | 402 |
| New Brunswick | 14 | 17 | 29c | 1 | 0 | 61 |
| Newfoundland & Labrador | 16 | 32 | 64 | 0 | 3 | 115 |
| Nova Scotia | 10 | 6 | 15 | 0 | 0 | 31 |
| Northwest Territories | 43 | 23 | 21 | 17 | 0 | 105 |
| Nunavut | 13 | 6 | 3 | 3 | 0 | 25 |
| Ontario | 128 | 68 | 336 | 9 | 44 | 585 |
| Prince Edward Island | 0 | 5 | 1 | 4 | 0 | 10 |
| Quebec | 15 | 0 | 0 | 0 | 236 | 251 |
| Saskatchewan | 95 | 51 | 18 | 3 | 142 | 306 |
| Yukon | 9 | 26 | 30 | 10 | 0 | 75 |
| TOTAL | 504 | 660 | 1005 | 87 | 666 | 2922 |
a Hydrometric monitoring stations located within the boundaries of each province, no matter which office operates them.
b Stations that are partially funded by the federal government, provincial/territorial governments, and third parties. The cost-share ratio varies by station.
c Nine of these stations are groundwater stations.
Notes: The actual total change in the network for 2021–2022 is +9 stations. An error in the total for 2020–2021 missed 37 stations from Alberta’s count.
The network also includes a small number of designated International Gauging Stations located in the United States that are not included here as they support International Joint Commission activities not covered under the Canada Water Act.
2.1.2 Data dissemination
In 2022-2023, the ECCC published a pre-release of the National Hydrometric Network (NHN) basin delineation polygons on the collaboration site, which can be accessed through WaterOffice. This pre-release version of the dataset contains drainage area polygons for over 7300 of the 7896 active and discontinued hydrometric stations. ECCC also released its the offline historical databases four times throughout the year in April, July, October 2022, and January 2023.
Watershed boundaries
There are more than 1382 basins covering the entire Canadian landmass. Accurate delineation of a watershed plays an extremely important role in the management of the watershed. The delineated boundaries form the nucleus around which the management efforts such as land use, land change, soil types, geology and river flows are analyzed, and appropriate conclusions drawn. It is also an important step in the study of flooding.
A drainage basin is an area that drains all precipitation received as a runoff or base flow (groundwater sources) into a particular river or set of rivers. A drainage area polygon is the geographical extent of a land surface that drains to a given point, ECCC’s Water Survey of Canada (ECCC WSC) drainage basin polygons delineate the watershed boundaries upstream of its gauges.
ECCC WSC recently updated and completed its national drainage basin polygons dataset using consistent input datasets and geographical information system (GIS) tools and methods.
ECCC strives to continually improve the dissemination of hydrometric information. This year changes were made to improve the visualization and functionality to WaterOffice Map Search. WaterOffice users can now view the drainage basin delineation of a selected station to better understand the contributing area of that station. The map symbology was also updated to provide better visualization for seasonal station operation schedules, when a seasonal station is not operating the map icon is now colored orange to indicate it is out of season. The WaterOffice Map Search functionality was improved to allow users to filter the search based on the station name, station number, province/territory, region, major basin, parameter type (water level vs. discharge), the operation schedule (seasonal vs. continuous) and the operating agencies. This change allows site users to modify the map view according to their interests and a new action button allows users to Export the Metadata for Displayed Stations based on the filter selections.
Provincial and territorial agencies are largely responsible for issuing flood forecasts and warnings in Canada. The hydrometric data provided by ECCC is critical to support the provinces and territories flood forecasting and monitoring efforts across the country. To ensure that hydrometric data were available when needed during critical high-water periods 24/7, after-hours technical support was provided during the 2022 spring freshet.
2.2 Freshwater quality monitoring
Freshwater quality monitoring has been a core ECCC program since the Department’s inception in the early 1970s. The Department’s monitoring and surveillance activities are critical for assessing and reporting on water quality status and trends, in addition to fulfilling federal domestic and international commitments and legislative obligations. ECCC monitors freshwater quality on federal lands, transboundary watersheds, and inland waters in partnership with provinces and territories, as well as contributing to the understanding of water quality of priority ecosystems and programs. Data are also used to support the water quality indicator developed under the Canadian Environmental Sustainability Indicators program (CESI) (see Section 3).
Many of the Freshwater Quality Monitoring Program’s activities are carried out through federal-provincial/territorial agreements, ensuring cost-effective and non-duplicative program delivery. ECCC has water quality monitoring agreements with British Columbia, Yukon, Manitoba, Quebec, Prince Edward Island, New Brunswick, and Newfoundland and Labrador.
The objectives of the federal-provincial/territorial water quality monitoring agreements are to:
- achieve a long-term commitment for the acquisition of water quality data;
- obtain comparable, scientifically-sound water quality data that are reliable to inform water resource management; and
- disseminate water quality information in a timely manner to the public, government agencies, industry, and the scientific community.
Additional long-term freshwater quality monitoring activities are implemented through on-going collaborations with other Government of Canada departments and agencies. ECCC partners with the Parks Canada to monitor freshwater quality on federal lands in 16 national parks and works with Crown-Indigenous Relations and Northern Affairs Canada (CIRNAC) towards understanding cumulative impacts on aquatic ecosystem health in the mainland Nunavut region. The freshwater quality monitoring program also contributes to monitoring and assessment activities in waterbodies of significant national interest including the Great Lakes, St. Lawrence River Basin, Lake Winnipeg, and Lake of the Woods (Section 5); and through participation in initiatives such as the Oil Sands Monitoring Program.
In 2022-2023, 626 sites were sampled as part of ECCC’s long-term freshwater quality monitoring networks, compared to 227 sites the previous year. The observed increase in monitoring sites in 2022-2023 is largely due to the inclusion of sites that were not previously included in the Canada Water Act report, but do provide a more complete picture of the Government of Canada’s freshwater quality monitoring activities: 1) individual sampling sites from large lake monitoring activities, which form part of water quality monitoring and surveillance program activities for the Great Lakes and Lake of the Woods, and; 2) previously established sites monitored through long-standing partnerships with other federal departments such as CIRNAC and Parks Canada.
Federal-provincial and federal-territorial water quality monitoring agreements continue to be an important element of ECCC’s freshwater quality monitoring program, accounting for roughly half of all ECCC river monitoring sites, in addition to sites that are included as part of ECCC’s primary long-term freshwater quality monitoring network in Great Lakes inter-connecting channels and rivers (Figure 2). The map also displays long-term sampling sites carried out in collaboration with Parks Canada (96 sites) and CIRNAC (five sites), as well as stations monitored at various times within priority ecosystems areas contributing to programs such as the Freshwater Action Plan and the Oil Sands Monitoring program (Table 2). Roughly one third of the 626 sites, were sampled in international (Canada-US) and domestic (inter-provincial and territorial drainage regions) transboundary watersheds and boundary waters, including those monitored in fulfillment of ECCC’s obligations to the Prairie Provinces Basin Board (Section 5.1).
Figure 2: Long-term water quality monitoring sites

Long description for Figure 2
Figure 2 is a map of Canada indicating the location of long-term water quality monitoring sites. The long-term freshwater quality monitoring network consists of federal, federal-provincial and federal-territorial sampling sites across Canada. They are situated in the following ocean drainage areas: Arctic Ocean, Atlantic Ocean, Gulf of Mexico, Hudson Bay and Pacific Ocean.
Large lakes are presented as a single marker representing a network of individual monitoring sites sampled on a rotational basis.
The Long-Term Freshwater Quality Monitoring Network consists of 180 federal, federal-provincial and federal-territorial sampling sites across Canada (see Figure 2). The map also displays 32 sites that are monitored in Canada-US Transboundary Waters, as well as the location of sites monitored at various times under the Federal Great Lakes Program. Water quality samples are routinely collected at these sites for physical and chemical water quality parameters such as temperature, pH, alkalinity, turbidity, major ions, nutrients, and metals. Pesticides, bacteria, and additional parameters of concern are also monitored where site-specific water quality issues exist. The National Long-Term Water Quality Monitoring Data are published online. ECCC’s Freshwater Quality Monitoring Program is aligned with Canada’s major watersheds (Pacific, Arctic/Athabasca, Hudson Bay, and Atlantic watersheds). This program promotes robust water resource management across Canada.
| Province/territory | ECCC | Federal- provincial/ territorial agreement |
ECCC- Parks Canada |
ECCC-CIRNAC | Canada-Alberta | Total by province or territorya | ECCC Priority Ecosystem & Program areasb |
|---|---|---|---|---|---|---|---|
| Alberta | 3 | 4 | 7 | 0 | 7 | 21 | 21 (Oil Sands, Lake Winnipeg Basin) |
| British Columbia | 0 | 47 | 0 | 0 | 0 | 47 | 0 |
| Manitoba | 22 | 3 | 0 | 0 | 0 | 25 | 25 (Lake Winnipeg Basin) |
| New Brunswick | 5 | 15 | 21 | 0 | 0 | 41 | 0 |
| Newfoundland & Labrador | 0 | 24 | 17 | 0 | 0 | 41 | 0 |
| Nova Scotia | 13 | 0 | 29 | 0 | 0 | 42 | 0 |
| Northwest Territories | 9 | 0 | 12 | 0 | 1 | 22 | 1 (Oil Sands) |
| Nunavut | 2 | 0 | 8 | 5 | 0 | 15 | 0 |
| Ontario | 296 | 0 | 0 | 0 | 0 | 296 | 296 (Lake Winnipeg, Lake of the Woods, Great Lakes, St. Lawrence River Basin) |
| Prince Edward Island | 0 | 3 | 0 | 0 | 0 | 3 | 0 |
| Quebec | 11 | 39 | 0 | 0 | 0 | 50 | 50 (St. Lawrence River Basin) |
| Saskatchewan | 1 | 7 | 0 | 0 | 0 | 8 | 6c (Lake Winnipeg Basin) |
| Yukon | 0 | 13 | 2 | 0 | 0 | 15 | 0 |
| TOTAL | 362 | 155 | 96 | 5 | 8 | 626 | 399 |
a Total number of sites by province and territory through ECCC, Federal-Provincial and Federal-Territorial agreements, Memorandums of Understanding with Parks Canada and CIRNAC, and the Joint Canada-Alberta Oil Sands Monitoring Program.
b Indicates the number of sites located in Priority Ecosystems and Program areas among long-term freshwater quality monitoring networks including riverine and lake sites.
c Only six of the Saskatchewan sites are part of the Lake Winnipeg Basin. The remaining two sites are part of the Churchill River watershed.
ECCC conducts monitoring and surveillance activities based on the level of risk to water quality in a watershed. Risk is assessed based on the nature, probability, frequency and severity of stress. Through a risk-based adaptive management framework (RBAMF), ECCC optimizes its activities to reach results that are more targeted and better adapted to the needs of users and the Canadian population. To improve reporting outcomes the RBAMF:
- defines monitoring responsibilities.
- identifies risks to water quality at monitoring sites and across Canada’s drainage basins.
- optimizes monitoring operations.
- ensures data quality and data access.
Existing long-term monitoring sites have been classified under a series of national scale networks, namely Large Rivers, Large Lakes Priority, Transboundary Rivers, Reference, and High Stress, where each network includes a set of specific national monitoring objectives. Each network was developed to improve comparability of monitoring data.
In 2021-2022, following recommendations of the Commissioner of Environment and Sustainable Development (CESD AuditFootnote 1), ECCC initiated a five-year review of the RBAMF elements as they apply to each drainage basin, to ensure continuous improvement of its freshwater monitoring approach. The freshwater quality monitoring program continued to improve and refine the RBAMF approach for the Pacific, Arctic, and Athabasca region in 2022-2023. In the first year of the review, ECCC focused on the Atlantic and Quebec region.
For more information, please consult the ECCC Freshwater Quality Monitoring website.
2.3 Biological monitoring
The Canadian Aquatic Biomonitoring Network (CABIN) is a collaborative network led and maintained by ECCC. It is a component of the Freshwater Quality Monitoring Program that assesses the health of freshwater ecosystems in Canada with standardized biomonitoring using benthic macroinvertebrates. CABIN benthic macroinvertebrate samples provide information about biological conditions that complement water quality monitoring by characterizing current health status and detect changes in types and numbers of benthic macroinvertebrates that may reflect long-term exposure to disturbances, to help Canadians assess aquatic ecosystem health. CABIN participants include federal departments, provincial and territorial governments, industry, academia, and non‑governmental organizations such as community watershed groups. They are trained to collect data using nationally standardized protocols, share data through a web-accessible CABIN database, and assess freshwater health using specific analytical tools. Participation in CABIN reduces the resources required by any single organization to perform comparable assessments of aquatic ecosystem health across Canada.
In 2022, CABIN sampling occurred at 716 sites in various sub-basins across the country, an increase of 296 sites from 2021 (Figure 3, Table 3). The increase in sites is due, in part, to the inclusion of CABIN samples collected by industry and environmental consultants, which were not previously including in Canada Water Act reporting. Thirty percent (30%) of CABIN monitoring in 2022 was conducted by federal departments and 70% of monitoring conducted by other organizations, or in partnership with ECCC. While CABIN aims to provide open data that is machine-readable, freely shared, used, and built on without restrictions, CABIN also recognizes Indigenous data sovereignty, including the First Nation principles of OCAP (ownership, control, access, and possession). Data collected by the network since the early 1990s from over 12 000 locations across the country are stored in the CABIN database.
The application of CABIN monitoring by non-government organizations and Indigenous groups and governments is growing. Interest in CABIN has broadened to include non-scientists and citizen scientists. In 2022-2023, ECCC focused on evolving and adapting the CABIN training and certification program and resources to be more accessible and inclusive of all participants. ECCC also participated in collaborative research with academia and community-based monitoring groups to evaluate the potential for new technology in biological monitoring, such as DNA metabarcoding, as well as the use of new protocols for other freshwater habitats including wetlands and large rivers.
Figure 3: 2022 CABIN monitoring sites

Note: Reference sites represent habitats that are closest to “natural” before any human impact. The data from these sites are used to create reference models. CABIN partners use these models to evaluate their test sites in an approach known as the Reference Condition Approach (RCA). The extent of the differences between the test site communities and the reference site communities allows CABIN partners to estimate the severity of the impacts at those locations.
Long description for Figure 3
Figure 3 is a map of Canada that shows the location of the CABIN monitoring sites across the country.
| Province/ territory |
Federal | Federal- provincial/ territoriala |
Provincial, territorial, and municipal governments |
Indigenous groups and governments |
Industry & environmental consultants | NGOs | Other authorityb | Total by province or territoryc |
|---|---|---|---|---|---|---|---|---|
| Alberta | 49 | 82 | 0 | 0 | 15 | 16 | 23 | 185 |
| British Columbia | 26 | 10 | 55 | 26 | 201 | 18 | 4 | 340 |
| Manitoba | 0 | 0 | 0 | 0 | 0 | 0 | 0 | 0 |
| New Brunswick | 32 | 0 | 0 | 0 | 0 | 4 | 0 | 36 |
| Newfoundland & Labrador | 10 | 7 | 0 | 0 | 0 | 0 | 0 | 17 |
| Nova Scotia | 29 | 0 | 0 | 0 | 0 | 6 | 1 | 36 |
| Northwest Territories | 17 | 0 | 0 | 0 | 0 | 0 | 0 | 17 |
| Nunavut | 0 | 0 | 0 | 0 | 0 | 0 | 0 | 0 |
| Ontario | 22 | 0 | 0 | 0 | 0 | 0 | 0 | 22 |
| Prince Edward Island | 10 | 8 | 0 | 0 | 0 | 0 | 0 | 18 |
| Quebec | 14 | 0 | 0 | 0 | 0 | 0 | 0 | 14 |
| Saskatchewan | 0 | 0 | 0 | 0 | 0 | 0 | 0 | 0 |
| Yukon | 0 | 5 | 4 | 0 | 22 | 0 | 0 | 31 |
| Total | 209 | 112 | 59 | 26 | 238 | 44 | 28 | 716d |
a Includes CABIN sampling carried out through federal-provincial and federal-territorial agreements as well as sampling through a collaborative agreement between ECCC, Alberta, and Industry (Joint Canada-Alberta Oil Sands Monitoring Program).
b Indicates CABIN sites sampled as part of academic studies or by unknown authorities.
c Total number of samples contributed to CABIN shared database by province and territory.
d A large portion of the additional 296 stations in 2022-2023, compared to 2021-2022, is due to the inclusion of samples collected by Industry and Environmental Consultants not in previous Canada Water Act annual reports.
2.4 Monitoring information by region
Summaries of the monitoring conducted in the various regions across Canada are discussed below on a region-by-region basis, noting that some jurisdictions may overlap regional boundaries (e.g., Yukon overlaps both the Pacific Coast and Northern Canada regions), as follows:
- water quantity monitoring
- water quality monitoring
- CABIN monitoring
2.4.1 Pacific coast
Water quantity monitoring
As a result of the catastrophic British Columbia (BC) flooding in November of 2021, there was an increased awareness and demand for ECCC’s water quantity monitoring data from the general public, and government/other officials.
In BC, the seasonal snowpack was slightly below normal by mid-winter 2021-2022, however, cold and wet conditions throughout March and April resulted in higher-than-normal snowpacks across the province in the lead up to the 2022 Freshet.
Figure 4a: Basin Snowpack Indices March 1st, 2022

Long description for Figure 4a
This map of BC indicates snow basin indices in: Basin Snowpack Indices March 1st, 2022 using colours to indicate levels of water contained within the snowpack. The colours range from red (indicating high snow water equivalent [SWE]) to dark green (indicating lower SWE).
The figure shows higher than normal SWE in March 2022.
Figure 4b: Basin Snowpack Indices April 1, 2022

Long description for Figure 4b
This map of BC in April 2022 indicates snow basin indices using colours to indicate levels of water contained within the snowpack. The colours range from red (indicating high snow water equivalent [SWE]) to dark green (indicating lower SWE).
The figure shows higher than normal SWE and higher-than-average spring peak flows.
Temperatures in most of BC remained moderate into the spring, prolonging seasonal melt. The above-normal snowpack resulted in higher-than-average spring peak flows in areas such as the Fraser River Valley, Skeena River Region, Fort Nelson, the Southern Interior, and the Boundary Region. Many communities issued states of emergency due to prolonged flooding as heavy rains extended the high-water level period late into the spring.
After a wet spring, the summer of 2022 was hot and dry. Many river systems recorded some of the lowest water levels on record, specifically on Vancouver Island and in the Okanagan. The province experienced very little rain over the summer months and extreme droughts persisted late into the fall in many regions.
The onset of winter was gradual across BC in 2022 and no major atmospheric rivers were recorded on the south coast of the province until late into December, for which localized flooding was minimal.
The water quantity monitoring network in BC consists of 459 hydrometric monitoring stations. Ninety-six percent of the 459 stations transmit data in real-time via telemetry. Fifteen stations have remote satellite cameras to assist operational activities.
In 2022-2023, three (3) stations were added to the network, one to reestablish monitoring on the Nicola River at a new location following the November 2021 flood. Five (5) stations were removed from the network, two due to the complete loss of infrastructure during the November 2021 flooding event.
Water quality monitoring
British Columbia
Water quality monitoring was conducted in BC under the Canada-British Columbia Water Quality Monitoring Agreement (PDF).
In 2022-2023, ECCC conducted joint monitoring with the provincial Ministry of Environment and Climate Change Strategy at 47 active sites, which include 44 sites in the Pacific watershed and three sites in the Mackenzie watershed. Twenty of these sites are co-located with hydrometric gauging stations and five of these sites are operated in cooperation with Parks Canada in Glacier, Yoho, Mount Revelstoke, and Kootenay National Parks. Twenty-one sites are in the international transboundary watersheds of the Columbia River, including the Okanagan and Similkameen Rivers, the Salmon, Sumas and Iskut Rivers. An additional four sites are located within the Mackenzie River watershed, including three in the Peace-Athabasca sub-basin and one in the Petitot River. ECCC also operates three real-time automated monitoring buoys, two in Osoyoos Lake and one on the Fraser River that provide real-time continuous water quality data.
Annual water monitoring activities were negotiated and documented in the British Columbia Water Quality Monitoring Agreement Business Plan (2022-2023). Highlights include:
- ECCC established relationships with First Nations communities in the Nechako and Fort Nelson areas, and trained community members in water quality sampling techniques.
- BC and ECCC presented data from the long-term water quality program, including trends in phosphorus and chloride in the Okanagan River, and dissolved oxygen concentrations and temperature in the Osoyoos Lake at the Osoyoos Lake Forum in October
- ECCC collaborated with BC to update the Canada-BC website hosted by British Columbia with Water Quality Index scores and new sites (Canada-B.C. Water Quality Monitoring Program – Province of British Columbia). This website aims to present water quality information, including links to data and trend results through a single ArcGIS online tool.
CABIN monitoring
British Columbia
In BC, CABIN monitoring is jointly conducted under the Canada-British Columbia Water Quality Monitoring Agreement. Under the Agreement, ECCC and the provincial Ministry of Environment and Climate Change Strategy continued to collaborate on data collection for reference model maintenance as well as development and site assessment.
In 2022-2023, ECCC conducted CABIN monitoring at 10 long-term water quality monitoring sites in BC under the Canada-BC Water Quality Monitoring Agreement. Of those, four sites were co-located with ECCC sites, four were transboundary sites, and two were in National Parks.
There are nine reference models available to all CABIN users in BC. These models provide baselines for biological assessments in nearly all watersheds across BC. The reference models were developed collaboratively by ECCC, Parks Canada, and the British Columbia Ministry of Environment and Climate Change Strategy. In 2022-2023 the Central/North Coast reference model was updated to include an additional seven years (86 samples) of reference data. The update was led by the BC Ministry of Environment and Climate Change Strategy with model review, database support and model testing from ECCC.
Twelve sites were sampled in 2022 to contribute to the maintenance and revision of reference models. In addition, four former reference sites were sampled to track the impacts of recent flooding and forestry on their condition.
2.4.2 Northern Canada
Water quantity monitoring
Northwest Territories (105 stations)
The community of Hay River and adjacent K’atl’odeeche First Nation experienced significant flooding in 2022. Peak water levels exceeded those on record since 1963Footnote 2 by over two (2) metres and were a result of river ice processes and associated snowmelt. The community was evacuated with significant damage occurring to homes and structures. Other communities along the Mackenzie River experienced high water events during break-up and were under evacuation notices at various points during the break-up period. Persistent high-water levels on Great Slave Lake returned to seasonal normals in the late summer and early fall of 2022. The return to seasonal conditions in the fall will help reduce transportation issues along the Mackenzie River, a major supply route for northern communities. The data and information collected by ECCC was used by the Government of Northwest Territories emergency response agency to issue flood advisories and evacuation notices.
The water quantity monitoring network in this region was adjusted as follows:
- Two (2) new stations were added to the NWT hydrometric network in 2022.
- Remote satellite cameras were deployed at two (2) stations to support Government of Northwest Territories flood forecasting activities.
Yukon (75 stations)
Record high snowpack conditions were again a significant contributing factor to extreme events in the Yukon. The Southern Lakes district once again experienced high water levels. Although, they did not reach 2021 levels, high water levels persisted for a longer duration in 2022 and caused significant erosion in some areas. The flow on the Yukon River at Whitehorse was elevated for a significant portion of the summer season increasing the risk of ice-related flooding at freeze up. Localized flood watches and warnings were issued in several communities – Carmacks, Ross River, Dawson City, Mayo, Teslin and Upper Liard – as a result of spring freshet and river ice processes during break-up. ECCC staff based in the Yukon were active during high water events, ensuring data were available and representative of conditions.
The water quantity monitoring network in this region was adjusted as follows:
- No stations were added or removed from the Yukon network in 2022.
- Remote satellite cameras were installed at two (2) locations to support operational activities and the Yukon Government flood forecasting.
Nunavut (25 stations)
ECCC staff based in Yellowknife were once again active in supporting the City of Iqaluit by operating a small network of gauges to support water diversion activities to replenish the city’s water supply reservoir. These activities are in accordance with a revenue agreement between ECCC and the City of Iqaluit. The hydrometric network in Nunavut is currently co-managed by ECCC and CIRNAC through a Memoradum of Understanding. Discussions have begun to transfer responsibility to the Government of Nunavut as part of the devolution process.
The water quantity monitoring network in this region is as follows:
- Within Nunavut, the 25 hydrometric stations are run by ECCC in accordance with the established cost-share agreement between ECCC, CIRNAC, Parks Canada and the City of Iqaluit. ECCC provided critical data to support the City of Iqaluit’s water supply strategy.
Water quality monitoring
Many of the High Arctic sites are considered relatively pristine and provide an important baseline and reference for comparison with respect to long-range transport of atmospheric pollutants to high-latitude areas, as well as for any potential future influences from human activities in the North. ECCC operates water quality sites on major rivers in the North, some associated with transboundary rivers (e.g. Mackenzie River, Slave River, Liard River, Yukon River) and other significant northern watersheds (e.g. Coppermine River, Thelon River, Great Bear Lake/River).
In 2022-2023, ECCC monitored 52 sites within the Arctic watershed and across the North: 22 in the Northwest Territories, 15 in Nunavut, 15 in Yukon. Twenty-eight of these sites were operated under several agreements with Parks Canada and CIRNAC and thirty-two of these sites are co-located with ECCC’s hydrometric gauge stations.
Yukon
Water quality monitoring in the Yukon is conducted under the Canada-Yukon Water Quality and Aquatic Ecosystem Monitoring Agreement.
In 2022-2023, ECCC conducted joint monitoring with the Yukon Government at 15 active stations which include 11 stations in the Pacific Watershed and 4 stations in the Arctic watershed. Eight of these sites are co-located with hydrometric gauge stations. Three sites are operated in cooperation with Parks Canada in Kluane and Ivvavik National Parks and thirteen sites are in the international transboundary watersheds including the Yukon River and two small coastal watersheds draining into the Pacific (Alsek River) and Arctic (Firth River). An additional two sites are located within the Peel and Liard River sub-basins of the Mackenzie River watershed. ECCC also operates one automated water quality station on the Klondike River.
The annual water monitoring activities were negotiated and documented in the Canada-Yukon Operational Plan (2022-2023). Highlights include:
- ECCC conducted risk-based assessments on five water quality monitoring sites in the Yukon to support ECCC’s Risk Based Adaptive Management Framework.
- Yukon Government published the South McQuesten River Cumulative Impact Study using data and trend analysis from the long-term federal-territorial site on the South Mcquesten River.
Northwest Territories
Water quality monitoring was conducted in the Northwest Territories under agreements with ECCC and Parks Canada’s Nahanni National Park Reserve and Western Arctic Parks Field Unit. Nine river sites were monitored in collaboration with ECCC-NHS and 12 river sites were monitored in three National Parks. There is also a sampling site at the mouth of the Slave River as part of the Oil Sands Monitoring Program that is co-located with a buoy that monitors in-situ parameters with a water quality sonde.Footnote 3
Nunavut
Water quality monitoring was conducted in Nunavut under agreements with ECCC, CIRNAC and Parks Canada’s Eastern Arctic Parks. Two river sites were monitored in collaboration with ECCC, five river sites were monitored in the Baker Lake Basin in collaboration with CIRNAC, and eight river sites were monitored in three National Parks in collaboration with Parks Canada.
CABIN monitoring
CABIN monitoring in Northern Canada is done where possible to complement water quality monitoring under established agreements.
Yukon
Yukon CABIN reference model is available to all Yukon CABIN users to conduct biological assessments; it was designed to assess test sites related to placer mining activities specifically. The Yukon model was developed collaboratively by federal and territorial agencies (ECCC, Department of Fisheries and Oceans, and Government of Yukon).
In 2022-2023, ECCC conducted CABIN monitoring at five long-term water quality monitoring sites in Yukon under the Canada-Yukon Water Quality Monitoring and Reporting Agreement. Of those, three (3) sites were co-located with ECCC Water Survey of Canada sites.
Northwest Territories
CABIN sampling was conducted in Nahanni National Park Reserve (NNPR) under the Nahanni National Park Reserve CABIN monitoring program. NNPR staff conducted CABIN sampling at 17 stations within the park. Many of the samples collected in 2022-2023 were reference samples to support the maintenance and revision of the South Nahanni Basin CABIN Reference model.
Nunavut
No CABIN monitoring was completed in Nunavut in 2022-2023.
2.4.3 Prairie region
Water quantity monitoring
Alberta
Sustained cold temperatures in the mountain regions resulted in a small spring freshet in the mountains. However, extended rain events in the Rocky Mountains and foothills in mid-June caused rapid and above average runoff, with some regions recording the highest observed discharge measurements in decades. Daily updates with measurement plans were provided by ECCC to Alberta Environment and Protected Areas River Forecast Center (RFC) to provide the necessary information for flow forecasts.
Northwestern Alberta and parts of the Peace River experienced significant flooding in the spring of 2022. Multiple flood warnings were issued and some areas around the town of High Level were evacuated. Local states of emergency were declared in the Paddle Prairie Métis Nation settlement, Chateh, and Little Red River Cree areas due to localized flooding.
The Birch River Basin (WSC station 07KE001 Birch River below Alice Creek) was affected by significant meltwater contribution to the basin. Water levels broke out from the steep banks and spilled onto the surrounding floodplain, resulting in levels not seen in over 30 years of ECCC operating this site.
A prolonged absence of precipitation in much of the province through the summer months caused low water conditions and associated water use challenges warranting additional surveillance from Operations. Low flow conditions were more pronounced due to a relatively dry spring. The Pine Coulee Reservoir near Stavely reached new historic lows.
At the beginning of 2023, staff installed a Nupoint satellite camera at Clearwater River above Christina River (07CD005). These cameras provide a daily photo of the area, which not only assist with data computations, but also provide an illustration of onsite conditions daily. This camera captured ice breakup in 2023.
The water quantity monitoring network in this region was adjusted as follows:
Alberta (497 stations)
- Five (5) stations were relocated to a new location.
- Seven (7) stations had improvements performed, such as new shelters installed.
- A new passenger-operated cableway was installed at McLeod River Near Whitecourt (07AG004).
- Two (2) passenger-operated cableways were retrofit to a bank-operated cableway.
- Six (6) cableways were decommissioned.
- Four (4) sites were remediated due to mercury contamination.
- Eight (8) wells were decommissioned.
- Six (6) stations were upgraded to Geostationary Operational Environmental Satellites (GOES) from cellar modem or land line communications to improve data collection.
- Data contributed from Alberta Environment and Protected Areas is available at nine (9) new stations.
Saskatchewan (306 stations)
The snowpack in most of the south and central Saskatchewan was below average to average. During the freshet there was ice jamming along the Qu’Appelle River in the Craven Area. There were also some late spring and early summer snow and rainfall events in the Eastern area of Saskatchewan that led to higher flows. This precipitation also brought an end to drought conditions in the region. However, drought conditions continued in Western areas of the province. The northern portions of the province had moderate snowpack and saw near normal to above normal runoff responses.
The water quantity monitoring network in this region was adjusted as follows:
- Twelve (12) precipitation sensors were bought by the Saskatchewan Water Security Agency (WSA) and installed at ECCC-operated stations.
- One (1) site was remediated due to mercury contamination and moved to a new location.
- One (1) station changed designation from federal to third-party and is now funded by SaskPower.
- One (1) camera was installed at a United States Geological Survey hydrometric station, the camera is operated by the WSA.
Manitoba (402 stations)
In the winter of 2021-2022, the majority of Manitoba received very high amounts of snowfall, with parts of the province seeing upwards of 156.6 cm of snow – the third highest amount since 1872. There was a relatively slow snow melt in most basins, however between April 1st to June 19, 2022, nearly all of southern Manitoba received near record precipitation resulting in a prolonged spring flood period. Much of the Red River basin received more than 330 mm of rain, which is over 200% of normal during that period. In April and May, Manitoba experienced six Colorado Low weather systems with high precipitation and strong winds, leading to major flooding across the province. A major Colorado Low that occurred in late April on top of frozen ground with substantial snow cover created major flooding in much of southern and central Manitoba. The fourth largest flood in history was recorded on the Red River while record flooding was observed on the Winnipeg River system, the Whiteshell Lakes, and Fisher River. Record flooding was also observed in the Parklands Region and along the tributaries of the Red River. The Assiniboine River saw moderate flooding this spring.
The water quantity monitoring network in this region was adjusted as follows:
- Three (3) stations’ operating schedules changed from seasonal to annual (year-round) operation
- One (1) station was added to the network at the request of Public Service and Procurement Canada
Operations were ceased at two (2) provincial stations, jointly funded by Manitoba Transportation and Infrastructure and Manitoba Hydro, at the request of Manitoba Hydro.
Water quality monitoring
Alberta
Oil Sands & Wood Buffalo National Park
ECCC collected 62 samples from 10 stations in the Lower Athabasca, Peace and Slave River watersheds in Alberta. Three of these stations have been part of ECCC’s long-term monitoring network since the 1960’s and are monitored along with the remaining seven in partnership with Alberta Environment and Protected Areas under the Oil Sands Monitoring program. Four sites are also co-located with buoys that monitor in-situ parameters with water quality sondes. The monitoring work done under this program was designed to track the cumulative effects of oil sands development in air, water, wildlife, and biodiversity to help inform government and industry decision-making.
Mountain National Parks & Waterton Lake National Park
Water quality monitoring was conducted under a Memorandum of Understanding with Parks Canada at sites in Banff, Jasper, and Waterton Lake National Parks. Two river sites were monitored in Waterton Lake National Park, two river sites were monitored in Jasper, and three river sites were monitored in Banff. These sites provided water quality information to Parks Canada and were used as reference sites as part of ECCC’s Long-term Water Quality Monitoring Program. Analysis of low-level Phosphorous was available and actual values were collected where it had been below the detection level for the previous 40 years.
Alberta/Saskatchewan/Manitoba
As part of the National Long-Term Freshwater Quality Monitoring Network and in support of the Prairie Provinces Water Board Master Agreement on Apportionment (PPWB MAA), ECCC monitors 12 sites along the main rivers crossing between the Alberta, Saskatchewan, and Manitoba provincial boundaries (Section 5.1). In 2022-2023, monthly samples were collected for 11 rivers and quarterly samples were collected from one river in this network. Water quality objectives have been established at the 12 major interprovincial eastward flowing river reaches in Schedule E of the PPWB MAA. Data from this monitoring are used to meet annual reporting obligations on water quality objectives for nutrient, metal, major ion, and pesticide parameters established by Canada, Alberta, Saskatchewan, and Manitoba under the PPWB MAA. These data are also used to support the Lake Winnipeg Basin Program (Section 6.1).
Saskatchewan
Under the International Joint Commission’s International Souris River Board (Section 5.4), ECCC monitored the Souris River at the transboundary monitoring station at Sherwood, North Dakota. A joint water quality sample with the United States Geological Survey (USGS) is taken annually for methodology comparison.
Manitoba
Under the International Joint Commission’s International Red River Watershed Board (IRRWB) (Section 5.4), ECCC monitored the Red River at the transboundary monitoring station at Emerson, Manitoba. Grab-sample monitoring for water quality parameters of interest (nutrients, metals, pesticides, salinity) was conducted at least monthly during ice-cover season and more frequently during the open water season and spring freshet. ECCC also maintains a real-time continuous water quality transboundary monitoring station for select parameters. Continuous and grab-sample monitoring data are made available through the Government of Canada Open Data Portal. Compliance against binational water quality objectives, targets, and alert levels are summarized in annual IRRWB reporting to the International Joint Commission (IJC). New in 2022-2023 are the inclusion of nutrient concentration objectives and nutrient loading targets, which were recently adopted by the Canadian and US governments.
Under the IJC’s International Souris River Board (Section 5.4), ECCC monitored the Souris River at the transboundary monitoring station at Westhope, North Dakota. Grab-sample monitoring for water quality parameters of interest (nutrients, metals, pesticides, salinity) was conducted eight times per year and a joint water quality sample with USGS is taken annually for methodology comparison. Compliance against binational water quality objectives and alert levels are summarized in annual IRRWB reporting to the IJC and regular monitoring updates were provided to the Board in 2022-2023.
As part of the Canada-Manitoba Agreement and under the Science Subsidiary Arrangement made pursuant to the Canada-Manitoba Memorandum of Understanding Respecting Lake Winnipeg and the Lake Winnipeg Basin, ECCC conducted transboundary monitoring on the Pembina River at the Canada-US boundary and the Winnipeg River near the Ontario-Manitoba border. These rivers were monitored 8-12 times per year in 2022-2023 for parameters of concern including nutrients, metals, pesticides, and salinity.
Under the Lake Winnipeg Basin Program, Lake Winnipeg nearshore monitoring was carried out in three seasonal surveys in 2022. Each survey included water quality and aquatic biota monitoring (phytoplankton, zooplankton, benthic macroinvertebrates) at 20 sites within the littoral zone and coastal wetlands. Nearshore aquatic monitoring data had been identified as a gap in knowledge after the previous phase of the Lake Winnipeg Basin Program (Section 6.1).
CABIN monitoring
Alberta
In partnership with Alberta Environment and Protected Areas under the Oil Sands Monitoring program, 82 CABIN samples were collected. The monitoring work done under this program was designed to track the cumulative effects of oil sands development in air, water, wildlife, and biodiversity to help inform government and industry decision-making.
CABIN is also conducted by Parks Canada at other long-term physical-chemical monitoring sites. There is a reference model available to all CABIN users to conduct biological assessments in the Rocky Mountain Parks watersheds developed by Parks Canada which overlaps the British Columbia-Alberta border.
The Alberta Eastern Slopes collaborative (AES) is a partnership of non-governmental organizations, Indigenous groups, ECCC, and Parks Canada working towards the development of a CABIN reference model for the head waters of the Peace, Athabasca, North and South Saskatchewan watersheds. AES obtained the Alberta EcoTrust Funding grant and have established a three-year action plan. Partner organizations will complete necessary training, identify local study objectives and sites, and collect data from streams using CABIN.
Saskatchewan
No CABIN monitoring was completed in Saskatchewan in 2022-2023. The Water Security Agency has its own water quality monitoring and biomonitoring programs and protocols.
Manitoba
No CABIN monitoring was completed in Manitoba in 2022-2023.
2.4.4 Ontario region
Water quantity monitoring
Ontario (544 stations)
There were significant high-water events in 2022-2023 in both southern and northern Ontario. High water in north-west Ontario and the far north of Ontario persisted from March to late May 2022 during the spring freshet. This required emergency flying contracts and additional travel for staff across the province to see several areas operated out of the Thunder Bay sub-office. Southern Ontario saw multiple rain-driven events in the early spring (March) of 2023. This allowed for many opportunities to confirm historical high and medium high flows and determination of stage-discharge relationships.
In 2022-2023, with the lifting of most local public health and federal government restrictions and directives due to COVID, operations gradually returned to pre-pandemic processes. Construction and infrastructure continued to focus on decommissioning of legacy sites, decontamination of remaining mercury gauge locations, and gauge reinstallations to support lifecycle maintenance in addition to planning for large weir rehabilitation projects.
The water quantity monitoring network in this region was adjusted as follows:
- Nine (9) new provincially funded gauges were installed to provide real-time flood warning data within the Trent-Severn and Rideau River Watersheds in 2021-2022, were switched to 100% operations in 2022-2023.
- Four (4) stations changed operational schedules.
- Three (3) gauges were discontinued.
Water quality monitoring
Ontario
In Ontario, coordination of federal-provincial and Canada-United States water quality monitoring is supported through the Canada-Ontario Agreement on Great Lakes Water Quality and Ecosystem Health and the Great Lakes Water Quality Agreement (GLWQA) between Canada and the United States (Section 6.2). Monitoring results generated by ECCC contributed to indicators as part of the State of the Great Lakes 2022 ReportFootnote 4 assessing the status of toxic chemicals in water, sediments and fish, as well as indicators on the status of nutrients, water quality and algae. The core monitoring programs in the Great Lakes also serve as a foundation which supports other federal programs such as the Chemicals Management Plan and the Freshwater Action Plan. In 2022-2023, ECCC water quality monitoring activities continued to be impacted by the pandemic as outbreaks resulted in the interruption of the spring surveillance cruises on Lake Erie and Lake Huron and no annual survey for Lake Superior. Full water quality surveillance cruises on board the CCGS LIMNOS were completed on Lake Ontario (spring) and lakes Erie and Huron (summer). Monitoring of the connecting channels (St. Clair River, Niagara River, and at Wolfe Island) was conducted throughout the year characterizing nutrient transport between Lake Huron, Erie, and Ontario, as well as monitoring for toxic pollutant releases along the St. Clair and Niagara River, and a monitoring site in the St. Lawrence River at Cornwall.
Rainy River – Lake of the Woods
Lake of the Woods water quality monitoring was supported through the Freshwater Action Plan and informed by the International Rainy - Lake of the Woods Watershed Board (Section 5.4). Water quality was monitored at three locations on the Rainy River, and one location on the Winnipeg River at the outflow of Lake of the Woods. A summer lake-wide survey of 21 locations and a winter lake-wide water quality survey of 9 locations were conducted, contributing data to the long-term monitoring database, and supporting various research projects, such as EO Lake Watch. (EOLakeWatch: Satellite earth observations for lake monitoring - Canada.ca).
CABIN monitoring
CABIN monitoring in Ontario region occurred at 22 sites in both stream and wetland habitats. Sampling by Department of National Defense was done at 16 locations (stream and wetland), at Canadian Forces Training Area Burwash and 4th Canadian Division Support Base Petawawa, while Parks Canada sampled six stream stations in Pukaskwa National Park.
The Ontario Ministry of the Environment, Conservation, and Parks has its own water quality monitoring and biomonitoring programs and protocols.
2.4.5 Quebec region
Water quantity monitoring
Quebec (251 stations)
There are 15 stations in Quebec operated by the NHP (see Ontario region for details) and the remaining 236 are operated by Environnement et Lutte contre les changements climatiques Québec. ECCC cost shares stations operated by the province. Streamflow amount and water level for 2022-2023 were generally near normal for the stations operated by ECCC in Quebec.
The water quantity monitoring network in this region was adjusted as follows:
- no major changes to the network, with extra travel to the Ungava as a special project, as well as continued isotope sampling
Water quality monitoring
In 2022-2023, the Quebec region's activities under the Canada Water Act were largely carried out under the aegis of the following agreements:
- Agreement between the Government of Canada and the Government of Quebec concerning water quality monitoring in Quebec - Canada-Quebec Agreement on the St. Lawrence (2011-2026) (St. Lawrence Action Plan 2011-2026)
In addition, the region has a Memorandum of Understanding between the Direction de la Politique en matière de durabilité and the Direction Sciences et technologie de l'Eau concerning water quality in the Canadian rivers of the Canadian Environmental Sustainability Indicators.
2022-2023 was a year of transition, with the resumption of sampling activities following the cessation of field activities due to the COVID-19 pandemic, and the implementation of recommendations arising from the Risk-Based Adaptive Management Framework. In this respect, the aquatic ecosystem quality monitoring network has been modified to be more optimal. This transition will continue over the next few years.
In 2022-2023, 50 stations located along the St. Lawrence River corridor (from Beauharnois to Lévis) and in the main tributaries were sampled monthly. Sampling began in May rather than April, due to the pandemic. Thirty-nine of these stations were sampled by the province of Quebec, in collaboration with ECCC, as part of the Agreement between the Government of Canada and the Government of Quebec concerning water quality monitoring in Quebec. At nine of these stations, physical parameters, nutrients, chlorophyll, fecal coliforms, and metals were analyzed. The remaining eleven stations, including six new ones, were sampled by ECCC to better identify certain environmental issues related to the St. Lawrence River, such as discharges from major riverside urban agglomerations and pesticide concentrations in tributary rivers draining agricultural land.
The latest analytical results for certain perfluoroalkyl compounds and bisphenols, as well as metals and pesticides, show that water quality in the river section is good in relation to water quality guidelines for the protection of aquatic life. Although pesticides, metals, perfluorooctane sulfonates and perfluorooctanoic acids were detected in over 98% of samples, no exceedance of guidelines was observed in 2022.
Activities carried out in 2022-2023 led to the publication of a fact sheet entitled "Freshwater Wetlands" (PDF), and to the drafting of the Global Portrait of the State of the St. Lawrence River 2024 (as part of ECCC's commitments under the St. Lawrence Action Plan 2011-2026 (Section 5.3). In addition, these activities will enable the calculation of Water Quality Indicators for Canadian rivers, including the calculation of trends and the drafting of a report covering the period between 2019 and 2021.
CABIN monitoring
In the St. Lawrence River Priority Ecosystem, six (6) macroinvertebrates samples were collected by ECCC in Lake St-Pierre wetlands using the CABIN protocol. Eight small tributaries in soft-bottom agricultural streams were sampled for macroinvertebrates by ECCC around Lake St. Pierre as part of the Living Lab Quebec Initiative.
The Quebec Ministry of the Environment and the Fight Against Climate Change has its own water quality monitoring and biomonitoring programs and protocols.
2.4.6 Atlantic region
Water quantity monitoring
Water level and flow conditions in Atlantic Canada for the year were within the normal ranges expected seasonally, with no significant flooding events or historic records set. What remained of the spring freshet at the beginning of 2022-2023 fiscal year was very typical for the entire region. Summer period low water flows were on the low side of normal on the island of Newfoundland during the summer months. Conditions during the winter of 2022-2023 were drier than average in Nova Scotia, with New Brunswick having a normal/slightly above normal snowpack. Low to moderate snowpack was recorded on the island of Newfoundland, with Labrador experiencing typical snowpack amounts.
The noteworthy storm event of the year in Atlantic Canada was Hurricane Fiona, which hit the region in September 2022. It is worth mentioning that Fiona was more damaging from a wind and storm surge perspective along the coast and did not result in historic flow rates in any location. In Newfoundland, Hurricane Fiona made landfall in the Port aux Basque region. There were no major network issues and water levels did rise but not to annual peak or historic levels. In New Brunswick, the hurricane again had some devastating wind damage and ocean surges, which caused widespread coastal flooding and damage. Prince Edward Island and Nova Scotia saw more rain from this event than other regions, and flows were high in several locations but not historic.
An area of focus in 2022-2023 was the ongoing implementation of the continuous data production initiative, which resulted in better data being available to the public sooner. Discussions and planning also began for some relatively significant planned hydrometric network expansion in Nova Scotia, anticipating future investments by the province as well as a third party.
The water quantity monitoring network in this region was adjusted as follows:
New Brunswick (61 stations)
- One (1) federal water level station in New Brunswick was decommissioned shortly after the end of the 2022-2023 fiscal year.
Newfoundland & Labrador (115 stations)
- Three (3) federal-provincial stations and one (1) provincially funded station were not used for the year in Newfoundland and Labrador.
Nova Scotia (31 stations)
- No major changes.
Prince Edward Island (10 stations)
- No major changes.
Water quality monitoring
Prince Edward Island
Water Quality Monitoring was conducted in Prince Edward Island under the Canada-Prince Edward Island Memorandum of Agreement. The annual water monitoring activities were negotiated and documented in the 2022-2023 Work Plan under that Agreement.
The PEI Department of Environment, Energy and Climate Action (EECA) conducted monitoring on behalf of ECCC at three sites in the province, and joint ECCC-EECA sampling was conducted at one real time (automated) site on the Wilmot River, which was co-located with a hydrometric station. Data are available on the Government of Prince Edward Island’s website.
Nova Scotia
Water quality monitoring was conducted in Nova Scotia under numerous initiatives and partners including Parks Canada and the Nova Scotia Department of Environment and Climate Change (NSECC).
In 2022-2023, ECCC managed the collection of water quality samples at 13 federal sites (including two automated sites) in Nova Scotia in support of the Canadian Environmental Sustainability Indicator (CESI) pertaining to water quality. NSECC provided support on data collection at three (3) additional sites in support of the Canadian Environmental Sustainability Indicator. The sites are located across the province and cover major watersheds within the Maritime Major Drainage Area, including two (2) rivers flowing into the Bay of Fundy. Samples were collected in all four (4) seasons. In addition, pesticide surveillance was conducted at four (4) high risk sites within the province during the growing season (May to October) as part of the regional freshwater quality monitoring program. A sampling collaboration occurred in both of Nova Scotia’s National Parks with ECCC providing laboratory funding for samples at 29 sites twice a year.
Newfoundland and Labrador
Water Quality Monitoring was conducted in Newfoundland and Labrador under the Canada-Newfoundland and Labrador Water Quality Agreement. The annual water monitoring activities were negotiated and documented in the 2022-2023 Work Plan under that Agreement.
Twenty-four federal-provincial sites across the major drainage areas were sampled four to ten times in 2022-2023, including transboundary sites in tributaries of the Saint Augustine and Petit Mécatina Rivers that flow south into Quebec. Data and station information from the sites are available on the Newfoundland and Labrador Water Resources website. Water quality sampling was also carried out in collaboration with Parks Canada in Terra Nova National Park (6 sites) and Gros Morne National Park (11 sites).
New Brunswick
Under the Canada-New Brunswick Water Quality Agreement during 2022-2023, annual water monitoring activities were negotiated and documented in the 2022-2023 Work Plan.
Fifteen federal-provincial sites were monitored on international and inter-provincial transboundary rivers or their tributaries in the Saint John River (Wolastoq) and Restigouche River watersheds. Three (3) additional real-time automated sites in the Saint John River (Wolastoq) watershed were also maintained by ECCC at the borders of the transboundary Big Presque Isle Stream, Aroostook River and Meduxnekeag River. There is also a buoy deployed seasonally (May-October) in the Saint John River (Wolastoq) near Musquash Island that collects in-situ data using a water quality sonde. Water quality sampling was also conducted in Fundy National Park (15 sites) and Kouchibouguac National Park (5 sites) in collaboration with Parks Canada.
The International St. Croix River Watershed Board, under the IJC, plays an important role in managing water levels, water quality, and fisheries between Maine and New Brunswick (Section 4.4). The Board works collaboratively with stakeholders within the watershed by preventing and resolving disputes. ECCC monitored water levels at seven stations in the watershed and real time (automated) water quality at two (2) stations and provided input to the Board’s annual report.
CABIN monitoring
In the Atlantic Provinces, 107 stream and river sites were monitored by ECCC and CABIN-certified partners in 2022, including other federal departments or Parks Canada, provincial governments (Newfoundland and Labrador; Prince Edward Island) and non-governmental organizations. This work supported federal-provincial water quality monitoring agreements with New Brunswick, Prince Edward Island, and Newfoundland and Labrador. The monitoring allowed partners to conduct assessments in transboundary watersheds and federal lands.
To help with the interpretation of CABIN data collected in the maritime provinces, ECCC produced a reference document entitled “Atlantic Benthic Normal Range Metrics (2002-2021), Metric Reference Values for use in CABIN Assessments”, shared with Atlantic CABIN participants. The Atlantic Reference Model is also available to assist participants with assessing CABIN data.
Prince Edward Island
In Prince Edward Island (PEI), 18 macroinvertebrates samples using CABIN protocol were collected. CABIN sampling was conducted by the Province of PEI in eight sites as part of a Federal-Provincial agreement between ECCC and the provincial government. Ten other sites were monitored in the Prince Edward Island National Park by Parks Canada.
Nova Scotia
In Nova Scotia, 36 macroinvertebrates samples using CABIN protocol were collected. CABIN sampling was conducted by ECCC in 11 sites. Parks Canada also collected five samples in Kejimkujik National Park and 13 samples in Cape Breton Highlands National Park. Six other samples were collected by a non-governmental organization (ACAP Cape Breton) and one under an academic study.
Newfoundland and Labrador
In Newfoundland and Labrador, 17 macroinvertebrates samples using CABIN protocol were collected. CABIN sampling was conducted by the Province Newfoundland and Labrador in seven sites as part of a Federal-Provincial agreement between ECCC and the provincial government. Ten other sites were monitored by Parks Canada in the Terra Nova National Park.
New Brunswick
In New Brunswick, 36 macroinvertebrates samples using CABIN protocol were collected. CABIN sampling was conducted by ECCC in 13 sites. Parks Canada also collected eight samples in Fundy National Park and eleven samples in Kouchibougouac National Park. Four other samples were also collected by two non-governmental organizations.
3 Water quantity and quality indicators
The Canadian Environmental Sustainability Indicators (CESI)Footnote 5 program provides data and information to track Canada's performance on key environmental sustainability issues including climate change and air quality, water (including water quality and quantity), biodiversity and pollution. The program updates many of its indicators annually, with others on an occasional basis based on data availability. Due to the time required to collect and analyze the data, and draft the indicators, the data used in the indicators are from timeframes before the indicator’s publication. Much of the data used to develop these water indicators derives from monitoring activities conducted pursuant to hydrometric agreements concluded under the Canada Water Act.
3.1 Water quantity in Canadian rivers indicator
The water quantity in Canadian rivers indicator is published every two (2) years. The last publication was in April 2022. It provides a summary of trends in water quantity in rivers across Canada from 2001 to 2019. The general trends illustrated in Figures 5a and 5b are as follows.
From 2001 to 2019:
- Most Canadian rivers had normal water quantity.
- Since 2010, there has been an increase in sites with a higher-than-normal water quantity.
- The percentage of stations with a lower-than-normal water quantity has declined since 2001.
Figure 5a: Water quantity at monitoring stations, Canada, 2001 to 2019

Note: The water quantity classification for a station is based on a comparison of the most frequently observed flow condition in a given year with typical water quantity at that station between 1981 and 2010. Data from Alberta from 2015-2017, as well as recent data from northern Canada are missing for 2019 because of delays in getting data into the database. The results for this indicator vary slightly from those in the Trends in annual water quantity in Canadian rivers indicator and the Trends in the number of flood days in Canadian rivers indicator because of differences in the methods used to calculate the indicators. For more information, please see Data sources and methods (PDF).
Source: Environment and Climate Change Canada (2021) National Water Data Archive (HYDAT).
Long description for Figure 5a
| Year | Total number of stations | High quantity (percentage of stations) |
Normal quantity (percentage of stations) |
Low quantity (percentage of stations) |
|---|---|---|---|---|
| 2001 | 1 358 | 5 | 70 | 25 |
| 2002 | 1 349 | 5 | 79 | 17 |
| 2003 | 1 369 | 2 | 77 | 21 |
| 2004 | 1 369 | 9 | 85 | 7 |
| 2005 | 1 360 | 23 | 74 | 3 |
| 2006 | 1 357 | 12 | 77 | 11 |
| 2007 | 1 355 | 13 | 79 | 8 |
| 2008 | 1 351 | 10 | 86 | 4 |
| 2009 | 1 354 | 8 | 83 | 9 |
| 2010 | 1 345 | 22 | 70 | 7 |
| 2011 | 1 318 | 28 | 66 | 6 |
| 2012 | 1 319 | 17 | 70 | 13 |
| 2013 | 1 305 | 25 | 69 | 6 |
| 2014 | 1 305 | 29 | 64 | 8 |
| 2015 | 1 249 | 21 | 66 | 13 |
| 2016 | 1 191 | 32 | 57 | 12 |
| 2017 | 1 085 | 22 | 70 | 7 |
| 2018 | 1 198 | 10 | 76 | 15 |
| 2019 | 1 027 | 19 | 74 | 7 |