
Turkey Lakes watershed: lake chemistry
Four lakes and their interconnecting stream (see map) have been monitored year-round by Environment Canada to determine how they respond to acid rain.
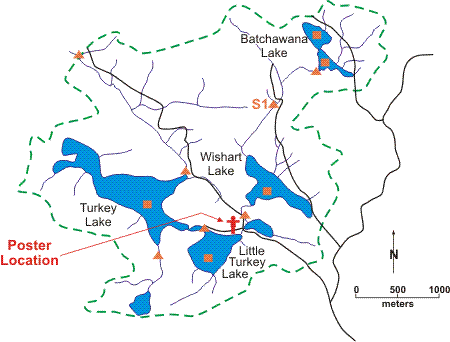
Environment Canada sampling sites
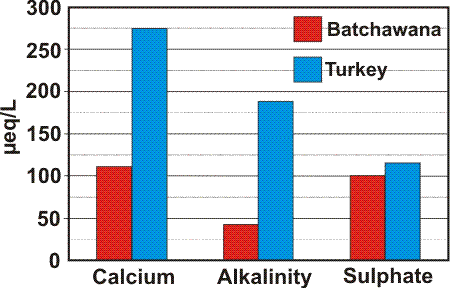
Due to differences in the surrounding forest soils, the higher elevation lake (Batchawana) has calcium and alkalinity concentrations that are less than half those observed in the lower elevation lake, Turkey Lake, (see bar graph). Alkalinity is a measure of a lake's ability to neutralize acid. The “softer” water of Batchawana Lake is therefore more sensitive to acid rain than Turkey Lake water. Sulphate (an indicator of acid rain input) is similar in the two lakes.
Long Description
Average concentration of three important chemicals in Batchawana and Turkey Lakes. Due to differences in the surrounding forest soils, the higher elevation lake (Batchawana) has calcium and alkalinity concentrations that are less than half those observed in the lower elevation lake, Turkey Lake. Sulphate (an indicator of acid rain input) is similar in the two lakes.
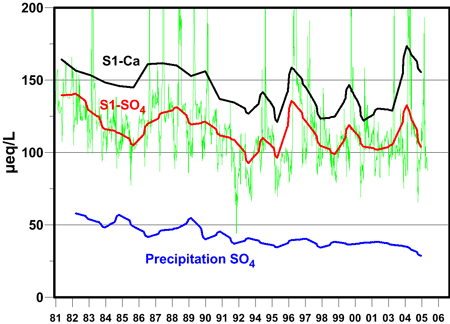
Since 1981, acid rain has decreased by about 40% which is reflected in declining average sulphate in precipitation (see blue line in graph). This has caused a downward trend in the average lake concentration of both sulphate (red line) and calcium (black line). Short-term variations (e.g. for sulphate, green line) occur in response to climatic or other factors. For example, very high sulphate levels are observed following drought conditions. This prolongs the “de-acidification” process.
Long Description
Calcium (Ca) and sulphate (SO4) observed at stream station S1 and sulphate measured in precipitation. The thick lines are average annual concentrations. The thin green line shows weekly sulphate concentrations to illustrate the short-term variability normally present in monitoring data.