
2020 Annual Report - Occupational Injuries in the Canadian Federal Jurisdiction
On this page
- List of abbreviations
- List of charts
- Overview
- Industry sectors under federal jurisdiction
- Highlights of the federal jurisdiction work injury and fatality rates in 2020
- Occupational injuries in the Canadian federal jurisdiction by industry sector in 2020
- Disabling injuries
- Disabling Injury Frequency Rate (DIFR)
- Fatal injuries
- Fatal Injury Frequency Rate (FIFR)
- Occupational injuries in the Canadian federal jurisdiction by province or territory in 2020
- Disabling injuries
- Disabling Injury Frequency Rate (DIFR)
- Fatal injuries
- Fatal Injury Frequency Rate (FIFR)
- Annex 1: List of terms
- Annex 2: Data charts
Alternate formats

Large print, braille, MP3 (audio), e-text and DAISY formats are available on demand by ordering online or calling 1 800 O-Canada (1-800-622-6232). If you use a teletypewriter (TTY), call 1-800-926-9105.
List of abbreviations
- AIRT
- Air Transportation
- BANK
- Banking and Banks
- BRID
- Interprovincial Infrastructure (Bridges, Tunnels, Canals, and Causeways)
- BROAD
- Broadcasting (Television, Radio, and Internet)
- COMM
- Communications
- DIFR
- Disabling Injury Frequency Rate
- EAHOR
- Employer's Annual Hazardous Occurrence Report
- ENER
- Energy, Mining and Mineral Processing
- FEED
- Feed, Flour and Seed
- FIFR
- Fatal Injury Frequency Rate
- GRAIN
- Grain Handling and Grain Elevators
- INDG
- Indigenous, Aboriginal and First Nations
- LONG
- Longshoring, Stevedoring, Port, Harbour Operations and Pilotage
- OHS
- Occupational Health and Safety
- PIPE
- Pipeline Transportation
- POST
- Postal Services and Postal Contractors
- PUBS
- Federal Public Services, Public Service Departments and Crown Corporations
- RAIL
- Rail Transportation
- ROAD
- Road Transportation
- WATER
- Water Transportation (Shipping and Ferries)
List of charts
- Chart 1.1: Percentages of occupational disabling injuries and total hours worked by federally regulated industry sector in 2020
- Chart 1.2: Disabling Injury Frequency Rates (DIFR) by federally regulated industry sector in 2020
- Chart 1.3: Percentages of fatal work injuries by federally regulated industry sector in 2020
- Chart 1.4: Fatal Injury Frequency Rates (FIFR) by federally regulated industry sector in 2020
- Chart 2.1: Percentages of occupational disabling injuries and total hours worked by province/territory in 2020
- Chart 2.2: Disabling Injury Frequency Rates (DIFR) by province/territory in 2020
- Chart 2.3: Percentages of fatal work injuries by province/territory in 2020
- Chart 2.4: Fatal Injury Frequency Rates (FIFR) by province/territory in 2020
- Chart 3.1 (a): Federally regulated industry sectors with the 3 highest 2020 DIFR values from 2016 to 2020
- Chart 3.1 (b): Federally regulated industry sectors with the fourth to sixth highest 2020 DIFR values from 2016 to 2020
- Chart 3.2 (a): Federally regulated industry sectors with the 3 highest 2020 FIFR values from 2016 to 2020
- Chart 3.2 (b): Federally regulated industry sectors with the fourth and fifth highest 2020 FIFR values from 2016 to 2020
Overview
The data reported in this publication comes from the Employer's Annual Hazardous Occurrence Report (EAHOR) submitted by federally regulated employers to the Labour Program. The Occupational Health and Safety (OHS) Regulations under the Canada Labour Code require employers that subject to federal jurisdiction submit the EAHOR each year by March 1 for the period from January 1 to December 31 of the preceding calendar year. The EAHOR must reference:
- number of disabling injuries
- number of deaths
- number of minor injuries
- number of other hazardous occurrences
- total number of employees
- number of office employees
- total number of hours worked
- workplace status (active/inactive)
- date when the workplace status became inactive, if applicable
This publication presents both information and analysis on the Disabling Injury Frequency Rate (DIFR) and the Fatal Injury Frequency Rate (FIFR) for 2020. It also provides the statistics at the level of the industry sector and province/territory. The List of terms explains the definitions of injury rates and other relevant terms. Historical data on all injury rates dating back to 2008 are available at the Government of Canada’s Open Data Portal.
Industry sectors under federal jurisdiction
According to the Canada Labour Code, federal jurisdiction encompasses any work and/or undertaking or business that is within the legislative authority of the Parliament of Canada. This includes all work deemed to be for the common good of at least 2 provinces and outside the exclusive authority of provincial legislatures. For a detailed list of federally regulated industries and workplaces visit the webpage.
Highlights of the federal jurisdiction work injury and fatality rates in 2020
- In 2020, there were notable decreases in the total number of injuries, as well as in DIFR and FIFR values. The COVID-19 pandemic restrictions and related public health measures may largely explain these changes
- There was a total of 37,024 injuries (disabling injuries, fatal injuries and minor injuries) reported in 2020, 21.7% decrease from 2019 (47,299)
- Of the total number of injuries in 2020, 15,799 (42.7%) were disabling injuries, 49 (0.1%) were fatal injuries and 21,176 (57.2%) were minor injuries. All 3 types of injuries declined from 2019
- The 2020 DIFR for the federal jurisdiction is 7.29. This is a drop of 22.4% compared to the 2019 DIFR (9.39). It is the lowest DIFR recorded to date
- The 2020 DIFR values from 6 industry sectors were greater than the federal jurisdiction rate. All 6 of these sectors’ DIFR values were lower than the year before. Postal Services and Postal Contractors showed the highest DIFR value among the federally regulated sectors in both 2019 and 2020. However, its 2020 DIFR decreased by 34.0% compared to 2019. This is because the total number of disabling injuries in 2020 dropped by 33.1% compared to the previous year. See Chart 1.2, Chart 3.1(a) and (b)
- Overall, 9 of the 16 federally regulated industry sectors reported fatalities in 2020. The Road, Air, and Rail Transportation, Public Service Departments and Crown Corporations reported fatalities every year from 2010 to 2020
- The 2020 FIFR for the federal jurisdiction is 22.54. It decreased by 23.9% from the 2019 FIFR (29.64). The 2020 federal jurisdiction FIFR is the third-lowest value in the past 10 years (from 2011 to 2020)
- The 3 industry sectors with the highest FIFR values in 2020 were: Road Transportation (101.44), Feed, Flour and Seed (48.09), and Longshoring, Stevedoring, Port, Harbour Operations and Pilotage (41.92)
- The historical FIFR values of Road Transportation have been consistently higher than the federal jurisdiction rates since 2008. See Chart 1.4 and Chart 3.2 (a) and (b)
Note: More detailed and historical injury data is available at the Government of Canada’s Open Data Portal.
Occupational injuries in the Canadian federal jurisdiction by industry sector in 2020
Disabling injuries
In 2020, there was a total of 15,799 disabling injuries in the federal jurisdiction. 80.5% of these injuries came from the following 4 industry sectors (see Chart 1.1):
- Road Transportation (ROAD)
- Federal Public Services, Public Service Departments and Crown Corporations (PUBS)
- Postal Services and Postal Contractors (POST)
- Air Transportation (AIRT)
These 4 industry sectors contributed 59.1% of the total reported hours worked in the federal jurisdiction. When comparing between 2019 and 2020, AIRT had the largest decrease in both disabling injuries and total hours worked. The disabling injuries in AIRT fell by 49.4% from 3,511 in 2019 to 1,775 in 2020. Meanwhile, the hours worked in AIRT fell by 41.8% from 228.7 million hours in 2019 to 133.2 million hours in 2020. The travel restrictions during the COVID-19 pandemic likely explain these declines.
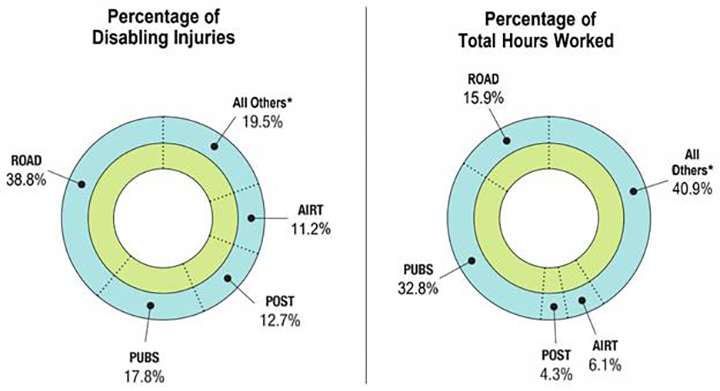
*Refer to table 1.1.
Text description of chart 1.1
| Industry sector | Percentage of disabling Injuries (%) | Percentage of total hours worked (%) |
|---|---|---|
| Road transportation | 38.8 | 15.9 |
| Federal public services, public service departments and crown corporations | 17.8 | 32.8 |
| Postal services and postal contractors | 12.7 | 4.3 |
| Air transportation | 11.2 | 6.1 |
| All others* | 19.5 | 40.9 |
| All Others | Percentage of Disabling Injuries (%) | Percentage of Total Hours Worked (%) |
|---|---|---|
| Banking and Banks | 5.5 | 20.8 |
| Communications | 4.3 | 8.6 |
| Rail Transportation | 2.6 | 2.9 |
| Broadcasting (Television, Radio, and Internet) | 1.6 | 1.9 |
| Water Transportation (Shipping and Ferries) | 1.5 | 1.3 |
| Longshoring, Stevedoring, Port, Harbour Operations and Pilotage | 1.3 | 1.1 |
| Feed, Flour and Seed | 1.2 | 1.0 |
| Grain Handling and Grain Elevators | 0.7 | 0.7 |
| Indigenous, Aboriginal and First Nations | 0.6 | 1.8 |
| Energy, Mining and Mineral Processing | 0.1 | 0.2 |
| Pipeline Transportation | 0.1 | 0.5 |
| Interprovincial Infrastructure (Bridges, Tunnels, Canals, and Causeways) | 0.0 | 0.02 |
Disabling Injury Frequency Rate (DIFR)
The DIFR is the total number of disabling and fatal injuries per one million hours worked. It is one of the primary performance measures for the OHS program in the federal jurisdiction. In 2020, 6 of the 16 federally regulated industry sectors reported DIFRs higher than the federal jurisdiction rate of 7.29 (see Chart 1.2). These industry sectors were:
- POST
- ROAD
- AIRT
- Feed, Flour and Seed (FEED)
- Longshoring, Stevedoring, Port, Harbour Operations and Pilotage (LONG)
- Water Transportation (Shipping and Ferries) (WATER)
The data from these 6 sectors show greater DIFR values than the federal jurisdiction rates in both 2019 and 2020. However, their DIFR values were lower in 2020 than the year before. POST showed the biggest DIFR value among the federally regulated sectors in both 2019 and 2020. Notably, its 2020 DIFR decreased by 34.0% compared to 2019. This is because the total number of disabling injuries in 2020 dropped by 33.1% compared to the previous year, while total hours worked only decreased by 1.4% over the same period. Grain Handling and Grain Elevators (GRAIN), Broadcasting (Television, Radio, and Internet) (BROAD), Indigenous, Aboriginal and First Nations (INDG), Banking and Banks (BANK), and Pipeline Transportation (PIPE) each showed a slight DIFR increase in 2020 compared to 2019 (see Chart 3.1 (a) and Chart 3.1 (b)).
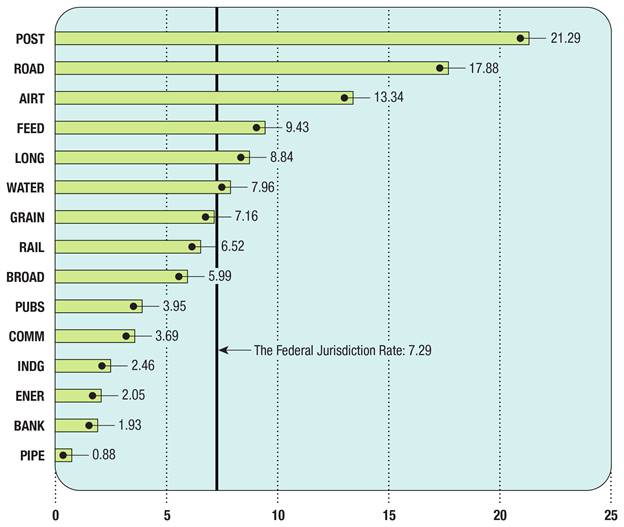
Text description of chart 1.2
| Industry sector | Disabling Injury Frequency Rate |
|---|---|
| Postal services and postal contractors | 21.29 |
| Road transportation | 17.88 |
| Air transportation | 13.34 |
| Feed, flour and seed | 9.43 |
| Longshoring, stevedoring, port, harbour operations and pilotage | 8.84 |
| Water transportation (shipping and ferries) | 7.96 |
| Grain handling and grain elevators | 7.16 |
| Rail transportation | 6.52 |
| Broadcasting (television, radio, Internet) | 5.99 |
| Federal public services, public service departments and crown corporations | 3.95 |
| Communications | 3.69 |
| Indigenous | 2.46 |
| Energy, mining and mineral processing | 2.05 |
| Banking and banks | 1.93 |
| Pipeline transportation | 0.88 |
| Interprovincial Infrastructure (bridges, tunnels, canals, causeways) | 0.00 |
| The federal jurisdiction rate | 7.29 |
Fatal injuries
The total number of occupational fatalities decreased by 25.8%, from 66 in 2019 to 49 in 2020. Nearly 53% of this drop came from AIRT, whose fatality count reduced from 11 in 2019 to 2 in 2020. The COVID-19 pandemic travel restrictions and other pandemic-related public health measures may have contributed to this decrease.
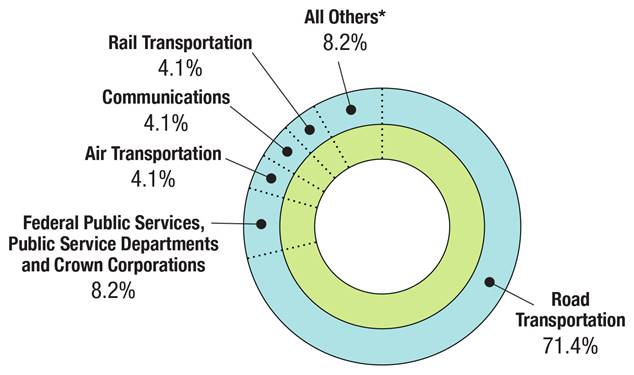
Text description of chart 1.3
| Industry sector | Percentage of fatal work injuries (%) |
|---|---|
| Road transportation | 71.4 |
| Federal public services, public service departments and crown corporations | 8.2 |
| Air transportation | 4.1 |
| Communications | 4.1 |
| Rail transportation | 4.1 |
| *All others | 8.2 |
*All others includes the following industry sectors, each sector having reported 1 fatality in 2020:
- BROAD
- FEED
- LONG
- POST
Fatal Injury Frequency Rate (FIFR)
The FIFR is the total number of reported fatal injuries per one billion hours worked. In 2020, 9 of the 16 federally regulated industry sectors reported fatalities. Amongst these, the following 5 industry sectors reported higher FIFR values than the federal jurisdiction rate (22.54):
- ROAD
- FEED
- LONG
- Rail Transportation (RAIL)
- BROAD
These 5 industry sectors had higher FIFR values than the federal jurisdiction rate in 2019 as well. LONG is the only one that had an increase in FIFR value, from 32.54 in 2019 to 41.92 in 2020. This industry sector reported 1 fatal injury in both 2019 and 2020. However, due to the decrease in hours worked in 2020, the FIFR value increased. Since 2008, ROAD has consistently showed higher FIFR values than the federal jurisdiction rates (see Chart 3.2 (a)).
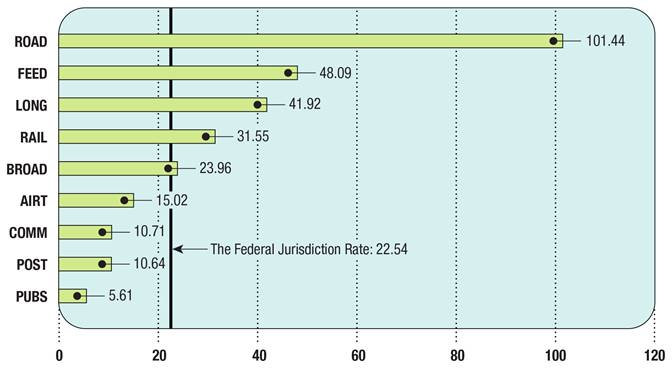
Text description of chart 1.4
| Industry sector | Fatal Injury Frequency Rate |
|---|---|
| Road transportation | 101.44 |
| Feed, flour and seed | 48.09 |
| Longshoring, stevedoring, port, harbour operations and pilotage | 41.92 |
| Rail transportation | 31.55 |
| Broadcasting (television, radio, Internet) | 23.96 |
| Air transportation | 15.02 |
| Communications | 10.71 |
| Postal services and postal contractors | 10.64 |
| Federal public services, public service departments and crown corporations | 5.61 |
| The federal jurisdiction rate | 22.54 |
Occupational injuries in the Canadian federal jurisdiction by province or territory in 2020
Disabling injuries
In 2020, amongst the total reported 15,799 disabling injuries, 82.1% of these injuries took place in 4 provinces (Ontario, Quebec, British Columbia and Alberta). Correspondingly, these 4 provinces had a combined share of 83.7% of all the reported total hours worked in the federal jurisdiction (see Chart 2.1). The regional shares of disabling injuries and total hours worked were relatively stable from 2019 to 2020.
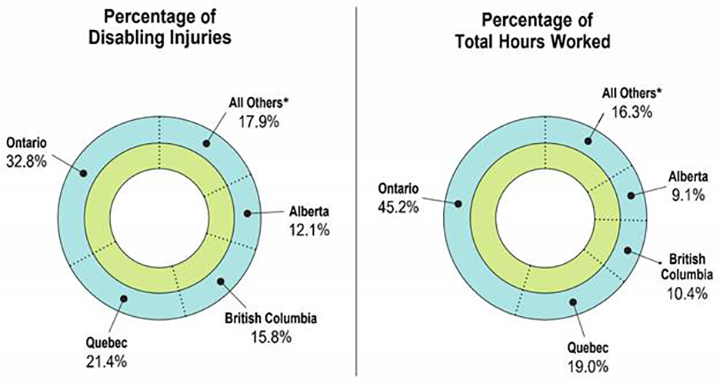
*Refer to table 2.1.
Text description of chart 2.1
| Province | Percentage of disabling injuries (%) | Percentage of total hours worked (%) |
|---|---|---|
| Ontario | 32.8 | 45.2 |
| Quebec | 21.4 | 19.0 |
| British Columbia | 15.8 | 10.4 |
| Alberta | 12.1 | 9.1 |
| All others* | 17.9 | 16.3 |
| All Others | Percentage of disabling injuries | Percentage of total hours worked |
|---|---|---|
| Manitoba | 6.1% | 4.3% |
| Saskatchewan | 3.8% | 3.0% |
| Nova Scotia | 3.4% | 2.7% |
| New Brunswick | 2.3% | 3.0% |
| Newfoundland and Labrador | 1.5% | 1.5% |
| Prince Edward Island | 0.3% | 0.6% |
| Nunavut | 0.2% | 0.1% |
| Northwest Territories | 0.1% | 0.2% |
| Yukon | 0.1% | 0.2% |
| Foreign (employees working outside Canada ) | 0.1% | 0.7% |
Disabling Injury Frequency Rate (DIFR)
In 2020, 6 provinces and 1 territory reported DIFR values higher than the federal jurisdiction (7.29) (see Chart 2.2). However, each of these 7 regions reported a lower DIFR value in 2020 than the year before. As in 2019, Nunavut and British Columbia continued to have the highest DIFR values in 2020.
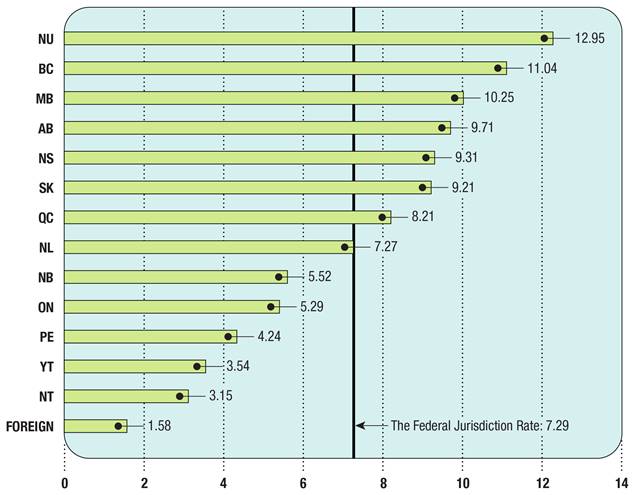
Text description of chart 2.2
| Province/Territory | Disabling Injury Frequency Rate |
|---|---|
| Nunavut | 12.95 |
| British Columbia | 11.04 |
| Manitoba | 10.25 |
| Alberta | 9.71 |
| Nova Scotia | 9.31 |
| Saskatchewan | 9.21 |
| Quebec | 8.21 |
| Newfoundland and Labrador | 7.27 |
| New Brunswick | 5.52 |
| Ontario | 5.29 |
| Prince Edward Island | 4.24 |
| Yukon | 3.54 |
| Northwest Territories | 3.15 |
| Foreign | 1.58 |
| The federal jurisdiction rate | 7.29 |
Fatal injuries
In 2020, there was a total of 49 fatal injuries reported in the federal jurisdiction. Five provinces (Ontario, Quebec, British Columbia, Alberta and Saskatchewan) accounted for 85.7% of all the reported fatal injuries in the federal jurisdiction (see Chart 2.3). Among these 5 provinces, only Saskatchewan reported 2 more fatal injuries in 2020 than in 2019. Ontario, Quebec, British Columbia and Alberta reported fewer fatal injuries in 2020 than the year before.
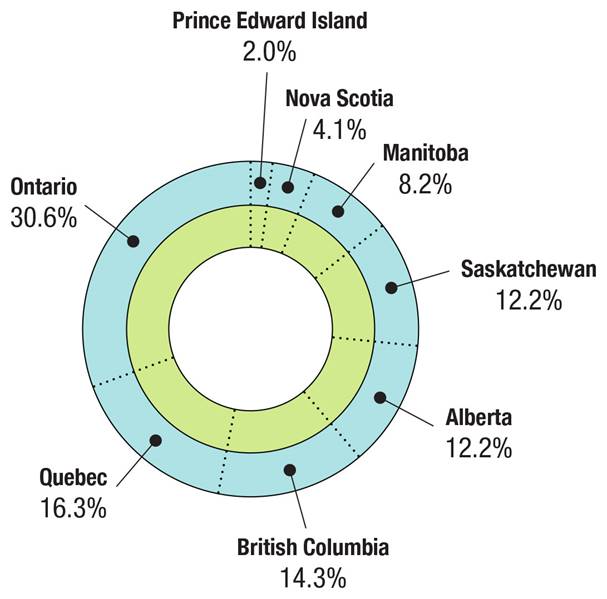
Text description of chart 2.3
| Province/Territory | Percentage of fatal work injuries (%) |
|---|---|
| Ontario | 30.6 |
| Quebec | 16.3 |
| British Columbia | 14.3 |
| Alberta | 12.2 |
| Saskatchewan | 12.2 |
| Manitoba | 8.2 |
| Nova Scotia | 4.1 |
| Prince Edward Island | 2.0 |
Fatal Injury Frequency Rate (FIFR)
New Brunswick, Newfoundland and Labrador, the Northwest Territories, Nunavut and Yukon reported no fatalities in 2020, thus the FIFRs for these provinces/territories were 0. Of note, the Northwest Territories and Yukon had the 2 highest FIFR values in 2019 (376.4 and 333.6, respectively). The FIFRs from Saskatchewan, Manitoba, Nova Scotia, British Columbia and Alberta remained above the federal jurisdiction FIFR in both 2019 and 2020 (see Chart 2.4).
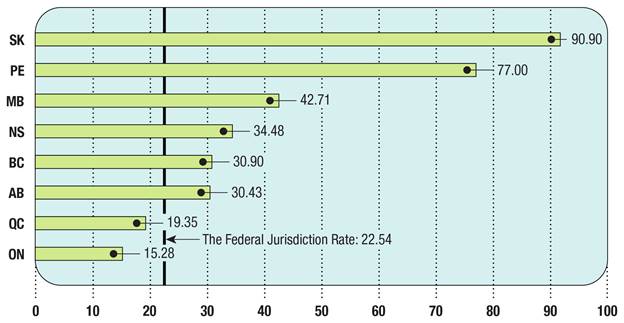
Text description of chart 2.4
| Province/Territory | Fatal Injury Frequency Rate |
|---|---|
| Saskatchewan | 90.90 |
| Prince Edward Island | 77.00 |
| Manitoba | 42.71 |
| Nova Scotia | 34.48 |
| British Columbia | 30.90 |
| Alberta | 30.43 |
| Quebec | 19.35 |
| Ontario | 15.28 |
| The federal jurisdiction rate | 22.54 |
Annex 1: List of terms
The following definitions are used in this publication.
Disabling injury
“Disabling injury” means an employment injury or an occupational disease that:
- prevents an employee from reporting for work or from effectively performing all the duties connected with the employee's regular work on any day subsequent to the day on which the injury or disease occurred, whether or not that subsequent day is a working day for that employee
- results in the loss by an employee of a body member or part thereof or in the complete loss of the usefulness of a body member or part thereof
- results in the permanent impairment of a body function of an employee
Disabling Injury Frequency Rate (DIFR)
The total number of disabling and fatal occupational injuries per one million hours worked. The calculation is: (Total Disabling Injuries + Total Fatal Injuries)*1,000,000/Total Hours Worked.
Employee
Any person who has entered into or is employed under a contract of service or apprenticeship, written or oral, expressed or implied, whether by way of manual labour or otherwise. An employee is also any other person subject to the provisions of a workers’ compensation board act or any direction or order of a board.
Employment
Employment is defined as:
- all work or activities performed in carrying out assignments or requests made by the employer. It includes related activities not specifically covered by an assignment or request
- any voluntary work or activities undertaken while on duty for the benefit of the employer
- any activities undertaken while on duty with the consent or approval of the employer
Fatal injury
An occupational injury or disease resulting in death.
Fatal Injury Frequency Rate (FIFR)
The total number of fatal occupational injuries per one billion hours worked. The calculation is: Total fatal injuries*1,000,000,000/Total hours worked.
Federal jurisdiction
Federal jurisdiction covers:
- any work, undertaking or business that is within the legislative authority of Parliament
- any work deemed to be for the common good of two or more provinces and outside the exclusive authority of provincial legislatures
Full-time equivalent (FTE)
Refers to the employment of one person full time. It may also refer to more than one person part time whose total working time is the equivalent of one person working full time. For example:
- 100 people employed full time equals 100 FTEs
- 10 people employed half time equals 5 FTEs
- all 110 people combined represent 105 FTEs
Minor injury
“Minor injury” means an employment injury or an occupational disease for which medical treatment is provided and excludes a disabling injury.
Note: Medical treatment means medical care provided at a medical treatment facility, such as a hospital, medical clinic or doctor's office where a patient in need of emergency care can be treated. Not to be confused with first aid.
Occupational injury
Any injury, disease or illness incurred by an employee in the performance of, or in connection with, his or her work.
Annex 2: Data charts
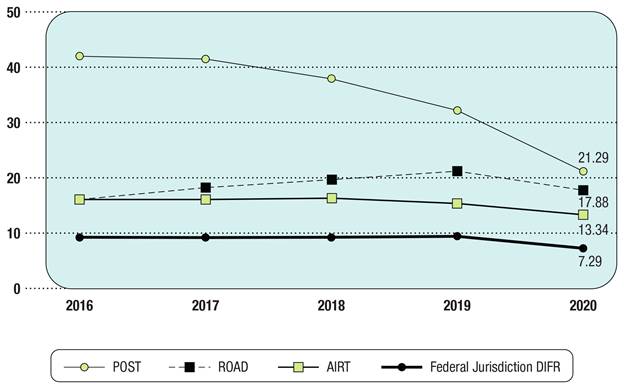
Text description of chart 3.1(a)
| Industry sector | 2016 | 2017 | 2018 | 2019 | 2020 |
|---|---|---|---|---|---|
| Postal services and postal contractors | 41.88 | 41.39 | 37.82 | 32.26 | 21.29 |
| Road transportation | 16.26 | 18.32 | 19.76 | 21.20 | 17.88 |
| Air transportation | 15.92 | 16.03 | 16.29 | 15.40 | 13.34 |
| Federal jurisdiction DIFR | 9.13 | 9.17 | 9.30 | 9.39 | 7.29 |
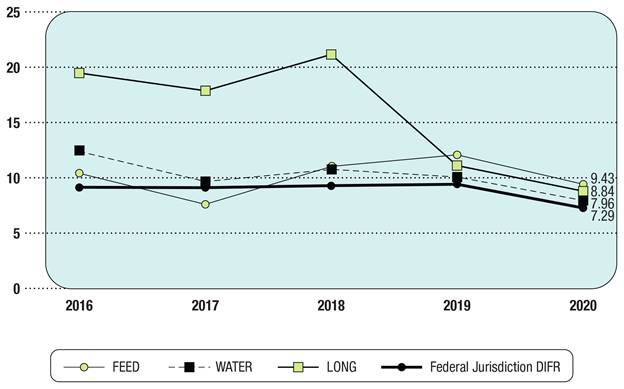
Text description of chart 3.1(b)
| Industry sector | 2016 | 2017 | 2018 | 2019 | 2020 |
|---|---|---|---|---|---|
| Feed, flour and seed | 10.50 | 7.62 | 11.02 | 12.10 | 9.43 |
| Longshoring, stevedoring, port, harbour operations and pilotage | 19.46 | 17.89 | 21.13 | 11.16 | 8.84 |
| Water transportation (shipping and ferries) | 12.39 | 9.68 | 10.76 | 10.11 | 7.96 |
| Federal jurisdiction DIFR | 9.13 | 9.17 | 9.30 | 9.39 | 7.29 |
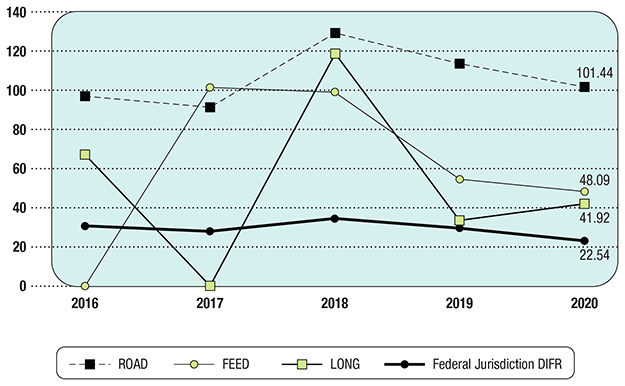
Text description of chart 3.2(a)
| Industry sector | 2016 | 2017 | 2018 | 2019 | 2020 |
|---|---|---|---|---|---|
| Road transportation | 96.43 | 91 | 128.66 | 112.93 | 101.44 |
| Feed, flour and seed | 0 | 101.62 | 98.81 | 54.02 | 48.09 |
| Longshoring, stevedoring, port, harbour operations and pilotage | 66.88 | 0.00 | 118.39 | 32.54 | 41.92 |
| Federal jurisdiction FIFR | 30.33 | 28.08 | 34.24 | 29.64 | 22.54 |
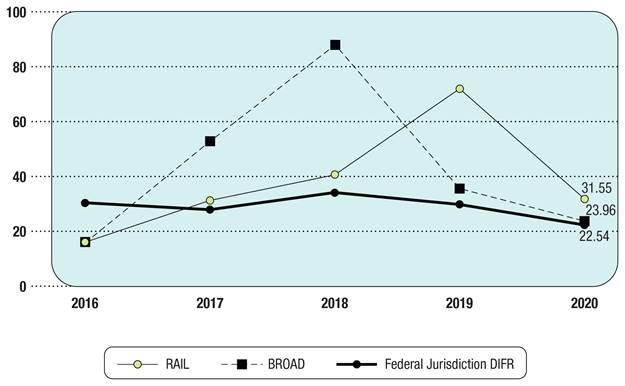
Text description of chart 3.2(b)
| Industry sector | 2016 | 2017 | 2018 | 2019 | 2020 |
|---|---|---|---|---|---|
| Rail transportation | 16.11 | 31.62 | 40.43 | 71.77 | 31.55 |
| Broadcasting (television, radio, Internet) | 16.35 | 52.54 | 87.80 | 35.90 | 23.96 |
| Federal jurisdiction FIFR | 30.33 | 28.08 | 34.24 | 29.64 | 22.54 |