
Annex 4: Key program administration data and results
From: Employment and Social Development Canada
Official title: Employment Insurance Monitoring and Assessment Report for the fiscal year beginning April 1, 2020 and ending March 31, 2021: Annex 4: Key program administrative data and results
On this page
- List of abbreviations
- Annex 4.2.2a – Electronic services: partially or fully automated claims (%)
- Annex 4.3.1a – Electronic services: claimants receiving benefits through direct deposit (%)
- Annex 4.3.1b – Points of service for EI Program delivery (number)
- Annex 4.3.1c – Service delivery: in-person Employment Insurance requests (in millions)
- Annex 4.3.1d – Service delivery: eServiceCanada Employment Insurance requests (in thousands)
- Annex 4.3.1e – Community Outreach & Liaison Services: all Employment Insurance information sessions – Citizens (Number)
- Annex 4.3.1f – Community Outreach and Liaison Services: workers facing mass layoffs reached (number)
- Annex 4.3.1g – Community Outreach and Liaison Services: employers reached (number)
- Annex 4.3.1h – Community Outreach and Liaison Services: work-sharing sessions – Citizens (number)
- Annex 4.3.1i – Community Outreach and Liaison Services: outreach support centre Employment Insurance requests1 (in thousands)
- Annex 4.3.2a – 1 800 O-Canada Employment Insurance related calls: (in thousands)
- Annex 4.3.2b – 1 800 O-Canada Employment Insurance related calls: first call resolution - (%)
- Annex 4.3.2c – Call centres: Enquiries resolved via Employment Insurance voice response system (in millions)
- Annex 4.3.2d – Call centres: calls answered (Employment Insurance call centre) (in millions)
- Annex 4.3.2e – Call centres: client attempts to contact a call centre agent
- Annex 4.3.2f – Call Centres: first contact resolution – Employment Insurance call centre
- Annex 4.3.3a – Electronic services: applications submitted online (%)
- Annex 4.3.3b – Service delivery: My Service Canada Account logins (in millions)
- Annex 4.3.3c – Service delivery: EI Claimants who accessed My Service Canada Account (%)
- Annex 4.4.1a – Electronic records of employment (eROEs): % distribution of paper records of employment versus electronic records of employment (%)
- Annex 4.4.1b – Electronic records of employment (eROEs): new record of employment web registrations (number)
- Annex 4.4.1c – Electronic records of employment (eROEs): records of employment submitted electronically by employers (number)
- Annex 4.4.2a – Employment Insurance claims processing: claims processed (number)
- Annex 4.5.1a – Employment Insurance claims processing: speed of payment (%)
- Annex 4.5.2a – CX Survey – evolution CX1 to CX 4 overall service channel satisfaction
- Annex 4.5.2b – CX Survey – evolution EI overall satisfaction
- Annex 4.6.1a – EI payment accuracy review: estimated financial impact of errors and estimated error rate, by sources (based on PAAR sample)
- Annex 4.6.1b – 15-year overview of claimant errors
- Annex 4.6.1c – 15-year overview of employer errors
- Annex 4.6.1d – 15-year overview of ESDC errors
- Annex 4.6.3a – Number of Claimant Information Sessions over the last 4 fiscal years
- Annex 4.7.2a - SST General Division - EI appeals - EI appeals
- Annex 4.7.2b – SST General Division service standards
- Annex 4.7.2c – SST General Division decisions disputed at the Appeal Division
- Annex 4.7.2d – SST Appeal Division Leave to Appeal service standard
- Annex 4.7.2e – SST Appeal Division final decision service standard
- Annex 4.7.2f – SST General Division - EI allowed rate - appeals with and without representation
- Annex 4.7.2g – SST Appeal Division - allowed rate – EI appeals with and without representation
- Annex 4.7.2h – SST Appeal Division - allowed rate – EI appeals with and without representation (groups excluded)
List of abbreviations
This is the complete list of abbreviations for the Employment Insurance Monitoring and Assessment Report for the fiscal year beginning April 1, 2020 and ending March 31, 2021.
| Region | FY1617 | FY1718 | FY1819 | FY1920 | FY2021 | % Change1 |
|---|---|---|---|---|---|---|
| Atlantic | 78.9 | 79.2 | 80.1 | 81.4 | 89.5 | 10.0% |
| Quebec | 71.3 | 72.2 | 72.4 | 76.0 | 88.6 | 16.6% |
| Ontario | 72.1 | 72.5 | 72.3 | 77.0 | 89.3 | 16.0% |
| Western | 71.9 | 69.1 | 69.6 | 74.6 | 88.5 | 18.6% |
| Canada | 72.7 | 72.4 | 72.6 | 76.6 | 88.9 | 16.1% |
- Source: Service Canada, Employment Insurance (EI) administrative data.
- 1 Percentage change between 2019 to 2020 and 2020 to 2021.
| Region | FY1617 | FY1718 | FY1819 | FY1920 | FY2021 | % Change1 |
|---|---|---|---|---|---|---|
| Atlantic | 96.7 | 97.0 | 97.5 | 97.7 | 96.9 | -0.8% |
| Quebec | 96.0 | 96.2 | 96.5 | 96.6 | 94.5 | -2.2% |
| Ontario | 95.3 | 95.7 | 96.4 | 96.6 | 95.4 | -1.2% |
| Western | 95.1 | 95.3 | 95.7 | 96.0 | 94.9 | -1.1% |
| Canada | 95.6 | 95.9 | 96.4 | 96.6 | 95.2 | -1.4% |
- Source: Service Canada, Employment Insurance (EI) administrative data.
- 1 Percentage change between 2019 to 2020 and 2020 to 2021
| Region | FY1617 | FY1718 | FY1819 | FY1920 | FY20212 | % Change3 |
|---|---|---|---|---|---|---|
| Atlantic | 84 | 84 | 84 | 84 | 84 | 0.0% |
| Quebec | 94 | 93 | 92 | 92 | 93 | 1.1% |
| Ontario | 167 | 167 | 165 | 163 | 162 | -0.6% |
| Western | 213 | 214 | 238 | 240 | 240 | 0.0% |
| Canada | 558 | 558 | 579 | 579 | 579 | 0.0% |
- Note: Totals may not add up due to rounding.
- Source: Service Canada, Employment Insurance (EI) administrative data.
- 1 The values represent existing points of service as of March 31st for each fiscal year. The 579 total for FY2021 represent the points of service including: Service Canada Centres, Scheduled Outreach sites, Service Delivery Partners and Service Canada Community Offices. The total does not include the Service Canada Centre - Passport Service sites.
- 2 As a result of the pandemic, the Service Canada Centres were closed in March 2020. EI Volumes for 2020 to 2021 only include activities that occurred in Service Canada Centres as a result of an appointment or since they're reopening in July 2020. In response to the pandemic, eServiceCanada was launched in March 2020, enabling clients to request assistance for EI via an online form. Once a form was submitted, an officer would call the client within 2 business days to either provide the client assistance or, if necessary, make an appointment to see an officer in a Service Canada Centre; note that eServiceCanada volumes are not included in this table.3Percentage change between 2019 to 2020 and 2020 to 2021.
| Region | FY1617 | FY1718 | FY1819 | FY1920 | FY20212 | % Change3 |
|---|---|---|---|---|---|---|
| Atlantic | 0.7 | 0.6 | 0.6 | 0.6 | 0.09 | -85.0% |
| Quebec | 1.3 | 1.2 | 1.2 | 1.2 | 0.28 | -76.7% |
| Ontario | 1 | 0.9 | 0.9 | 1.04 | 0.16 | -84.0% |
| Western | 1.4 | 1.2 | 1.1 | 1.1 | 0.18 | -83.6% |
| Canada | 4.4 | 3.9 | 3.8 | 3.9 | 0.7 | -82% |
- Note: Totals may not add up due to rounding.
- Source: Service Canada, Employment Insurance (EI) administrative data.
- 1 These values could reflect multiple requests by the same client. Statistics include clients assisted face to face and those serving themselves at a Client Access Work Station (CAWS) computer.
- 2 As a result of the pandemic, the Service Canada Centres were closed in March 2020. EI Volumes for 2020 to 2021 only include activities that occurred in Service Canada Centres as a result of an appointment or since they're reopening in July 2020. In response to the pandemic, eServiceCanada was launched in March 2020, enabling clients to request assistance for EI via an online form. Once a form was submitted, an officer would call the client within 2 business days to either provide the client assistance or, if necessary, make an appointment to see an officer in a Service Canada Centre; note that eServiceCanada volumes are not included in this table.
- 3 Percentage change between 2019 to 2020 and 2020 to 2021.
- 4 Number rounded up to avoid discrepancies
| Region | FY20213 |
|---|---|
| Atlantic | 556 |
| Quebec | 353 |
| Ontario | 528 |
| Western | 160 |
| Canada | 1,603 |
- Note: Totals may not add up due to rounding.
- Source: Service Canada, eServiceCananda, Employment Insurance (EI) administrative data from Microsoft Dynamics.
- 1 These values could reflect multiple requests by the same client. Data include all EI services requested by clients as they complete the eServiceCanada form on Canada.ca.
- 2 The total for Canada includes over 5,000 requests from outside of Canada.
- 3 The service request totals correspond to requests made by nearly 1.3 million EI clients.
| Region | FY1617 | FY1718 | FY1819 | FY1920 | FY2021 | % Change1 |
|---|---|---|---|---|---|---|
| Atlantic | 115 | 106 | 115 | 155 | 116 | -25.2% |
| Quebec | 277 | 274 | 197 | 271 | 381 | 40.6% |
| Ontario | 381 | 440 | 228 | 380 | 208 | -45.3% |
| Western | 152 | 216 | 156 | 170 | 121 | -28.8% |
| Canada | 925 | 1,036 | 696 | 976 | 826 | -15.4% |
- Source: Service Canada, Employment Insurance (EI) administrative data.
- 1 Percentage change between 2019 to 2020 and 2020 to 2021.
| Region | FY1617 | FY1718 | FY1819 | FY1920 | FY2021 | % Change1 |
|---|---|---|---|---|---|---|
| Atlantic | 769 | 807 | 781 | 1,437 | 249 | -82.7% |
| Quebec | 2,408 | 3,603 | 2,800 | 2,983 | 5,848 | 96% |
| Ontario | 2,596 | 3,659 | 2,363 | 3,718 | 1,141 | -69.3% |
| Western | 2,318 | 2,431 | 1,247 | 2,458 | 1,624 | -33.9% |
| Canada | 8,091 | 10,500 | 7,191 | 10,596 | 8,862 | -16.4% |
- Source: Service Canada, Employment Insurance (EI) administrative data.
- 1 Percentage change between 2019 to 2020 and 2020 to 2021.
| Region | FY1617 | FY1718 | FY1819 | FY1920 | FY2021 | % Change1 |
|---|---|---|---|---|---|---|
| Atlantic | 46 | 70 | 21 | 109 | 156 | 43.1% |
| Quebec | 221 | 134 | 120 | 272 | 1704 | 526.5% |
| Ontario | 305 | 284 | 105 | 298 | 1943 | 552.0% |
| Western | 183 | 47 | 32 | 86 | 498 | 479.1% |
| Canada | 755 | 535 | 278 | 765 | 4,301 | 462.2% |
- Source: Service Canada, Employment Insurance (EI) administrative data.
- 1 Percentage change between 2019 to 2020 and 2020 to 2021.
| Region | FY1617 | FY1718 | FY1819 | FY1920 | FY2021 | % Change1 |
|---|---|---|---|---|---|---|
| Atlantic | 18 | 7 | 4 | 12 | 84 | 600.0% |
| Quebec | 118 | 57 | 49 | 65 | 240 | 269.2% |
| Ontario | 58 | 23 | 19 | 49 | 39 | -20.4% |
| Western | 4 | 0 | 0 | 10 | 3 | -70.0% |
| Canada | 198 | 87 | 72 | 136 | 366 | 169.1% |
- Source: Service Canada, Employment Insurance (EI) administrative data.
- 1 Percentage change between 2019 to 2020 and 2020 to 2021.
| Region | FY2021 |
|---|---|
| Atlantic | 1.4 |
| Quebec | 3.3 |
| Ontario | 4.2 |
| Western | 20.4 |
| Canada | 29.3 |
- Note: Totals may not add up due to rounding.
- Source: Service Canada, Outreach Support Centre, Employment Insurance (EI) administrative data from ATOM.
- 1 These values could reflect multiple requests by the same client.
| Region | FY1617 | FY1718 | FY1819 | FY1920 | FY2021 | % Change2 |
|---|---|---|---|---|---|---|
| Atlantic | 46 | 43 | 41 | 50 | 47 | -4.4% |
| Quebec | 94 | 93 | 109 | 137 | 159 | 16.3% |
| Ontario | 138 | 114 | 114 | 155 | 169 | 8.7% |
| Western | 161 | 133 | 133 | 170 | 152 | -10.2% |
| Canada | 440 | 383 | 397 | 511 | 528 | 3.2% |
- Note: Totals may not add up due to rounding.
- Source: Service Canada, Employment Insurance (EI) administrative data.
- 1 Data includes calls from within Canada only.
- 2 Percentage change between 2019 to 2020 and 2020 to 2021.
| Region | FY1617 | FY1718 | FY1819 | FY1920 | FY20212 | % Change3 |
|---|---|---|---|---|---|---|
| Atlantic | 17.6% | 18.6% | 20.2% | 21.0% | 16.6% | -21.0% |
| Quebec | 17.0% | 17.5% | 19.8% | 20.7% | 16.9% | -18.4% |
| Ontario | 17.7% | 18.9% | 20.8% | 22.5% | 18.1% | -19.6% |
| Western | 18.4% | 19.2% | 21.6% | 22.9% | 18.3% | -20.1% |
| Canada | 17.8% | 18.7% | 21.0% | 22.3% | 18.0% | -19.3% |
- Note: Totals may not add up due to rounding.
- Source: Service Canada, Employment Insurance (EI) administrative data.
- 1 EI Related Calls received on 1 800 O-Canada are based on program activities (enquiries) and more than one program activity may apply to a call. First Call Resolution was derived from program activity statistics that indicated only program information was provided to a caller to satisfy an EI related enquiry and a referral to the program was not required. While one enquiry may have been resolved at first contact, a caller may still have additional enquiries related to EI or other Government of Canada programs and services.
- 2 The lower first contact resolution can be attributed to several pandemic related benefits and measures, as noted below, which by necessity required us to provide more referrals to the EI program for assistance that was more than general in nature.
- The pandemic year introduced new measures to Employment Insurance that affected the eligibility of applicants.
- New benefits became available as a result of the pandemic which also required agents to provide details on other programs at the same time as providing information on Employment Insurance.
- Service delivery methods changed with the in-person channel which may have created enquiries and referrals with 1 800 O-Canada that would not otherwise have existed.
- 3 Percentage change between 2019 to 2020 and 2020 to 2021.
| Fiscal year | FY1617 | FY1718 | FY1819 | FY1920 | FY2021 | % Change1 |
|---|---|---|---|---|---|---|
| Canada | 18.6 | 16.6 | 15.9 | 19.8 | 25.6 | 29.3% |
- Source: Service Canada, Employment Insurance (EI) administrative data.
- 1 Percentage change between 2019 to 2020 and 2020 to 2021.
| Fiscal year | FY1617 | FY1718 | FY1819 | FY1920 | FY2021 | % Change1 |
|---|---|---|---|---|---|---|
| Canada | 4.0 | 4.6 | 4.6 | 4.4 | 5.6 | 27.5% |
- Source: Service Canada, Employment Insurance (EI) administrative data.
- 1 Percentage change between 2019 to 2020 and 2020 to 2021.
| Fiscal year | FY1819 | FY1920 | FY2021 |
|---|---|---|---|
| Attempts to speak to an agent | 8,817,886 | 14,006,552 | 21,580,151 |
| Calls for which a client could not access an agent | 3,189,609 | 8,298,993 | 10,816,735 |
| Abandoned calls | 979,761 | 1,303,770 | 5,150,382 |
| Call answered by an agent | 4,648,516 | 4,403,789 | 5,613,034 |
- Source: Employment and Social Development Canada.
| Fiscal year | FY1617 | FY1718 | FY1819 | FY1920 | FY2021 | Change1 |
|---|---|---|---|---|---|---|
| Canada | 83.5% | 80.7% | 81.5% | 77.3% | 84.9% | 7.6 percentage points |
- Source: Service Canada, Employment Insurance (EI) administrative data.
- 1 Percentage point change between 2019 to 2020 and 2020 to 2021.
| Region | FY1617 | FY1718 | FY1819 | FY1920 | FY2021 | % Change1 |
|---|---|---|---|---|---|---|
| Atlantic | 98.6 | 99.2 | 99.3 | 99.2 | 98.6 | -0.6% |
| Quebec | 98.2 | 98.5 | 98.6 | 98.9 | 98.1 | -0.8% |
| Ontario | 98.7 | 98.9 | 98.8 | 99.2 | 98.6 | -0.6% |
| Western | 98.3 | 98.9 | 99 | 99.2 | 98.6 | -0.6% |
| Canada | 98.4 | 98.8 | 98.9 | 99.1 | 98.5 | -0.6% |
- Source: Service Canada, Employment Insurance (EI) administrative data.
- 1 Percentage change between 2019 to 2020 and 2020 to 2021.
| Fiscal year | FY1617 | FY1718 | FY1819 | FY1920 | FY2021 | % Change2 |
|---|---|---|---|---|---|---|
| Canada | 29.3 | 28.8 | 32.2 | 37.2 | 80.1 | 115.3% |
- Note: Totals may not add up due to rounding.
- Source: Service Canada, Employment Insurance (EI) administrative data.
- 1 Regional breakdowns for My Service Canada Account (MSCA) logins are not available. The data tracking system used for MSCA is a secure information portal; hence, Service Canada does not track personal identifying client information through this portal. Personal identifying client information would be needed in order to capture regional data. 2Percentage change between 2019 to 2020 and 2020 to 2021.
| Fiscal year | FY1617 | FY1718 | FY1819 | FY1920 | FY2021 | % Change1 |
|---|---|---|---|---|---|---|
| Canada | 36.8% | 35.2% | 38.0% | 39.1% | 34.8% | -11.0% |
- Note: Totals may not add up due to rounding.
- Source: Service Canada, Employment Insurance (EI) administrative data.
- 1 Percentage change between 2019 to 2020 and 2020 to 2021.
| Fiscal year | eROEs – Canada % total | Paper – Canada % total |
|---|---|---|
| FY1617 | 88.1 | 11.9 |
| FY1718 | 90.4 | 9.6 |
| FY1819 | 92.3 | 7.7 |
| FY1920 | 94.6 | 5.4 |
| FY2021 | 95.6 | 4.4 |
| Year-by-Year comparison1 | 1.1 | - |
- Source: ROE Single Database, Corporate Client Information Service (CCIS or Easy Access) - Employer Summary Table (Note: 2nd copy paper ROEs loaded in CCIS).
- 1 This figure represents the percentage point increase over the percentage of ROEs submitted electronically the previous fiscal year.
| Fiscal year | FY1617 | FY1718 | FY1819 | FY1920 | FY2021 | % Change2 |
|---|---|---|---|---|---|---|
| Canada | 51,625 | 42,411 | 39,949 | 45,849 | 84,699 | 84.7% |
- Source: Record of Employment (ROE) Single Database, Corporate Client Information Service (CCIS or Easy Access) - Employer Summary Table (Note: 2nd copy paper ROEs loaded in CCIS).
- 2 Percentage change between 2019 to 2020 and 2020 to 2021.
| Fiscal year | FY1617 | FY1718 | FY1819 | FY1920 | FY2021 | % Change2 |
|---|---|---|---|---|---|---|
| Canada | 8,726,202 | 9,290,983 | 9,800,954 | 12,808,991 | 12,237,632 | -4.5% |
- Source: ROE Single Database, Corporate Client Information Service (CCIS or Easy Access) - Employer Summary Table (Note: 2nd copy paper ROEs loaded in CCIS).
- 1 Electronic Records of Employment (eROEs) consist of Web eROEs and Secure Automated Transfer (SAT) eROEs.
- 2 Percentage change between 2019 to 2020 and 2020 to 2021.
| Region | FY1617 | FY1718 | FY1819 | FY1920 | FY2021 | % Change1 |
|---|---|---|---|---|---|---|
| Atlantic | 380,477 | 375,846 | 382,382 | 404,778 | 678,144 | 67.5% |
| Quebec | 777,249 | 764,175 | 767,231 | 914,938 | 2,014,639 | 120.2% |
| Ontario | 868,584 | 865,308 | 875,406 | 1,066,065 | 2,873,316 | 169.5% |
| Western | 942,287 | 778,727 | 786,678 | 939,753 | 2,392,358 | 154.6% |
| Canada | 2,968,597 | 2,784,056 | 2,811,697 | 3,325,534 | 7,958,457 | 139.3% |
- Source: Service Canada, Employment Insurance (EI) administrative data.
- 1 Percentage change between 2019 to 2020 and 2020 to 2021.
| Region | FY1617 | FY1718 | FY1819 | FY1920 | FY2021 | % Change1 |
|---|---|---|---|---|---|---|
| Atlantic | 89.5 | 88.0 | 86.6 | 86.8 | 93.1 | 7.3% |
| Quebec | 83.0 | 82.4 | 80.2 | 79.5 | 89.0 | 11.9% |
| Ontario | 82.1 | 81.3 | 79.3 | 79.7 | 88.8 | 11.4% |
| Western | 81.7 | 80.3 | 77.2 | 77.4 | 87.5 | 13.0% |
| Canada | 83.2 | 82.2 | 80 | 80.0 | 88.8 | 11.0% |
- Source: Service Canada, Employment Insurance (EI) administrative data.
- 1 Percentage change between 2019 to 2020 and 2020 to 2021.
| EI Service channel satisfaction | FY1718 | FY1819 | FY1920 | FY2021 | % Change1 |
|---|---|---|---|---|---|
| In-person channel satisfaction | 80% | 80% | 82% | 77% | -5% |
| Online channel satisfaction | 79% | 79% | 71% | 77% | 6% |
| Specialized Call Centre channel satisfaction | 85% | 74% | 59% | 70% | 11% |
- Source: Service Canada Client Experience Survey 2020-21
- 1 Percentage change between 2019 to 2020 and 2020 to 2021.
| Overall EI program satisfaction | FY1718 | FY1819 | FY1920 | FY2021 | % Change1 |
|---|---|---|---|---|---|
| Atlantic | 92% | 83% | 74% | 89% | 15% |
| Quebec | 88% | 85% | 84% | 81% | -3% |
| Ontario | 82% | 79% | 75% | 86% | 11% |
| Western | 75% | 77% | 74% | 81% | 7% |
| Canada | 83% | 80% | 77% | 84% | 7% |
- Source: Service Canada Client Experience Survey 2020 to 2021
- 1 Percentage change between 2019 to 2020 and 2020 to 2021.
| Fiscal year | FY1920 (not weighted) | FY2021 (weighted) |
|---|---|---|
| Total EI Benefit Payout | 17.9B | 31.0B |
| EI Payment Accuracy Rate | 94.5% | 96.0% |
| Errors by Sources | Estimated Financial Impact ($M) FY1920 (not weighted) | Estimated error rate FY1920 (not weighted) | Estimated Financial Impact ($M) FY2021 (weighted) | Estimated error rate FY2021 (weighted) |
|---|---|---|---|---|
| Client | $537.9 | 3.0% | $702.6 | 2.3% |
| Employer | $149.2 | 0.8% | $281.6 | 0.9% |
| ESDC | $296.6 | 1.7% | $245.8 | 0.8% |
| Total | $981.7 | 5.5% | $1.2B | 4.0% |
- Note: The error rate is calculated as the sum of projected overpayment and projected underpayment divided by gross total payout. The projected most likely errors are generated by means of the Monetary Unit Sampling (MUS) method.
- Source: Employment and Social Development Canada
March fiscal year-end results include both confirmed and potential monetary errors for overpayments and underpayments identified through the course of the payment accuracy review. Potential errors require additional actions to confirm whether an error has occurred. Until those actions are completed, they are captured as errors. Although Quality Services works diligently to resolve all potential errors by fiscal year-end, it is not always possible. The results presented in annex 4.6.1 reflect the most current results for both FY1920 and FY2021.
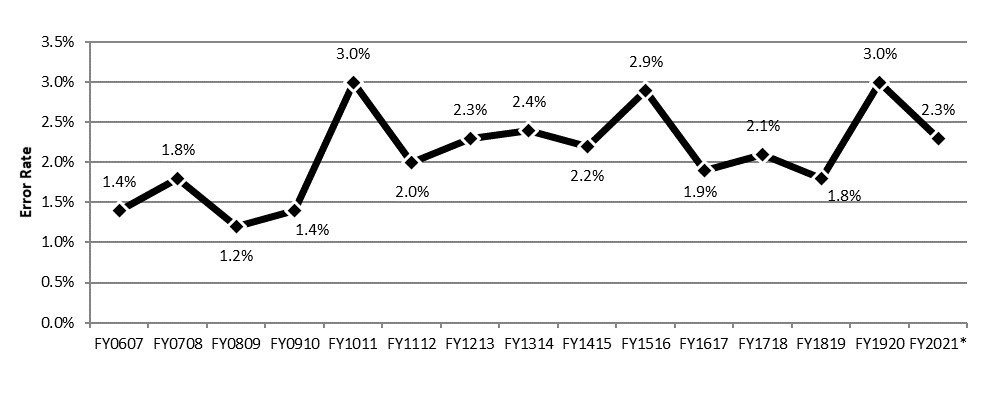
Text description of Annex 4.6.1b
| Fiscal year | Error rate |
|---|---|
| FY0607 | 1.4% |
| FY0708 | 1.8% |
| FY0809 | 1.2% |
| FY0910 | 1.4% |
| FY1011 | 3.0% |
| FY1112 | 2.0% |
| FY1213 | 2.3% |
| FY1314 | 2.4% |
| FY1415 | 2.2% |
| FY1516 | 2.9% |
| FY1617 | 1.9% |
| FY1718 | 2.1% |
| FY1819 | 1.8% |
| FY1920 | 3.0% |
| FY2021 | 2.3% |
- Note: The error rate is calculated as the sum of projected overpayment and projected underpayment divided by gross total payout. The projected most likely errors are generated by means of the Monetary Unit Sampling (MUS) method.
- Source: Employment and Social Development Canada.
- *FY2021 results are weighted by month to reflect monthly variations in total payout, sample size, workload and associated processing.
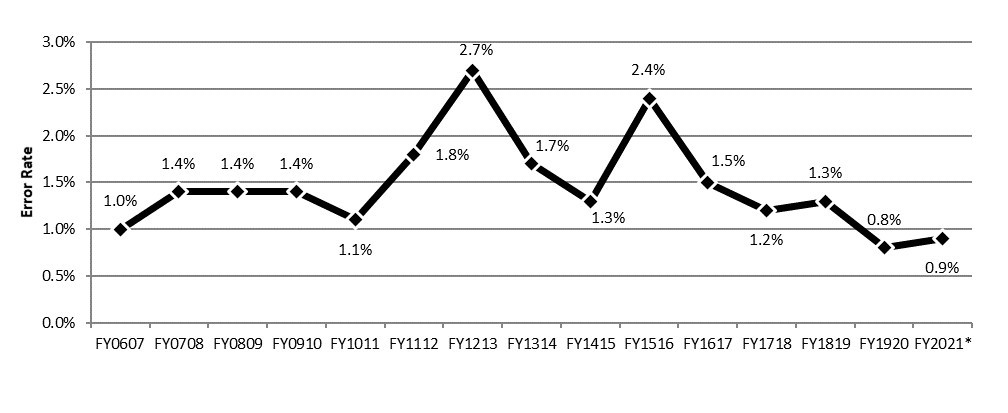
Text description of Annex 4.6.1.c
| Fiscal year | Error rate |
|---|---|
| FY0607 | 1.0% |
| FY0708 | 1.4% |
| FY0809 | 1.4% |
| FY0910 | 1.4% |
| FY1011 | 1.1% |
| FY1112 | 1.8% |
| FY1213 | 2.7% |
| FY1314 | 1.7% |
| FY1415 | 1.3% |
| FY1516 | 2.4% |
| FY1617 | 1.5% |
| FY1718 | 1.2% |
| FY1819 | 1.3% |
| FY1920 | 0.8% |
| FY2021 | 0.9% |
- Note: Note: The error rate is calculated as the sum of projected overpayment and projected underpayment divided by gross total payout. The projected most likely errors are generated by means of the of the Monetary Unit Sampling (MUS) method.
- Source: Employment and Social Development Canada.
- *FY2021 results are weighted by month to reflect monthly variations in total payout, sample size, workload and associated processing.
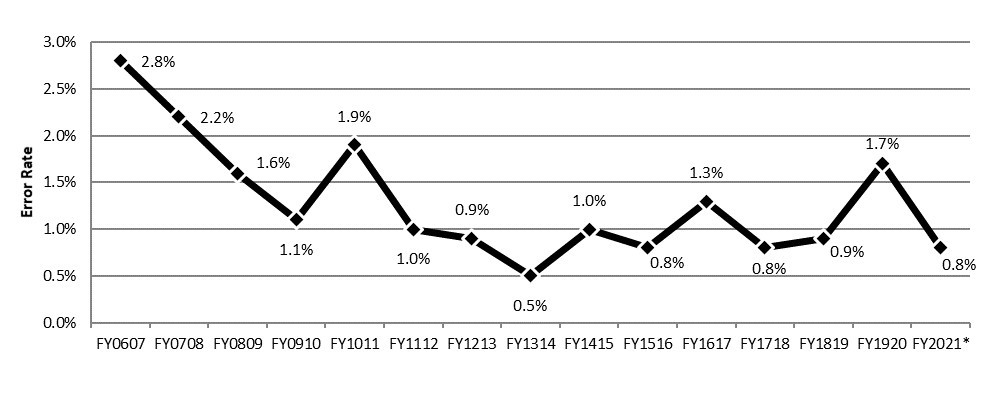
Text description of Annex 4.6.1d
| Fiscal year | Error rate |
|---|---|
| FY0607 | 2.8% |
| FY0708 | 2.2% |
| FY0809 | 1.6% |
| FY0910 | 1.1% |
| FY1011 | 1.9% |
| FY1112 | 1.0% |
| FY1213 | 0.9% |
| FY1314 | 0.5% |
| FY1415 | 1.0% |
| FY1516 | 0.8% |
| FY1617 | 1.3% |
| FY1718 | 0.8% |
| FY1819 | 0.9% |
| FY1920 | 1.7% |
| FY2021 | 0.8% |
- Note: The error rate is calculated as the sum of projected overpayment and projected underpayment divided by gross total payout. The projected most likely errors are generated by means of the Monetary Unit Sampling (MUS) method.
- Source: Employment and Social Development Canada.
- *FY2021 results are weighted by month to reflect monthly variations in total payout, sample size, workload and associated processing.
| Claimant Information Session | FY1617 | FY1718 | FY1819 | FY1920 |
|---|---|---|---|---|
| Number of Claimant Information Sessions | 11,012 | 10,978 | 10,772 | 9,691 |
| Percentage change in the number of Claimant Information Sessions from the previous fiscal year | +2% | -0.31% | -1.88% | -10% |
- Source: Employment and Social Development Canada.
| Appeal information | Number of regular files | Number of group files | Total number of files |
|---|---|---|---|
| Appeals in progress March 31,2020 | 501 | 208 | 709 |
| Appeals received | 1669 | 163 | 1832 |
| Appeals concluded | 1905 | 49 | 1954 |
| Appeals in progress March 31, 2021 | 265 | 322 | 587 |
| Month | Apr 2020 | May 2020 | June 2020 | July 2020 | Aug 2020 | Sept 2020 | Oct 2020 | Nov 2020 | Dec 2020 | Jan 2021 | Feb 2021 | Mar 2021 | FY2021 |
|---|---|---|---|---|---|---|---|---|---|---|---|---|---|
| Average Days | 40 | 42 | 37 | 38 | 40 | 37 | 29 | 35 | 37 | 25 | 36 | 32 | 36 |
| Met % | 73 | 73 | 71 | 75 | 74 | 73 | 86 | 87 | 80 | 92 | 91 | 92 | 80 |
- Note: The goal is to complete 80% of decision within 45 days from the date the appeal is filed with the Tribunal
| Appeal information | Number of regular files | Number of group files | Total number of files |
|---|---|---|---|
| Appeals in progress March 31,2020 | 72 | 461 | 533 |
| Appeals received | 199 | 0 | 199 |
| Appeals concluded | 232 | 461 | 693 |
| Appeals in progress March 31, 2021 | 39 | 0 | 39 |
| Month | Apr 2020 | May 2020 | June 2020 | July 2020 | Aug 2020 | Sept 2020 | Oct 2020 | Nov 2020 | Dec 2020 | Jan 2021 | Feb 2021 | Mar 2021 | FY2021 |
|---|---|---|---|---|---|---|---|---|---|---|---|---|---|
| Average Days | 25 | 18 | 34 | 16 | 15 | 23 | 14 | 23 | 13 | 17 | 10 | 15 | 20 |
| Met % | 100 | 100 | 80 | 100 | 100 | 100 | 100 | 100 | 100 | 100 | 100 | 100 | 98 |
- Note: The service standard is to make Leave to Appeal decisions within 45 days 80% of the time
| Month | Apr 2020 | May 2020 | June 2020 | July 2020 | Aug 2020 | Sept 2020 | Oct 2020 | Nov 2020 | Dec 2020 | Jan 2021 | Feb 2021 | Mar 2021 | FY2021 |
|---|---|---|---|---|---|---|---|---|---|---|---|---|---|
| Average Days | 58 | 77 | 86 | 89 | 84 | 70 | 71 | 79 | 82 | 66 | 112 | 69 | 77 |
| Met % | 100 | 92 | 94 | 100 | 100 | 100 | 100 | 100 | 100 | 100 | 100 | 100 | 99 |
- Note: Final decisions are made within 150 days of the Leave to Appeal decision, 80% of the time
- As of July 1, 2020, the service standard was updated from 210 days 85% of the time to 150 days 80% of the time.
- The percentage met for FY2021 is a combination of Q1 at 210 days and Q2 onwards at 150 days.
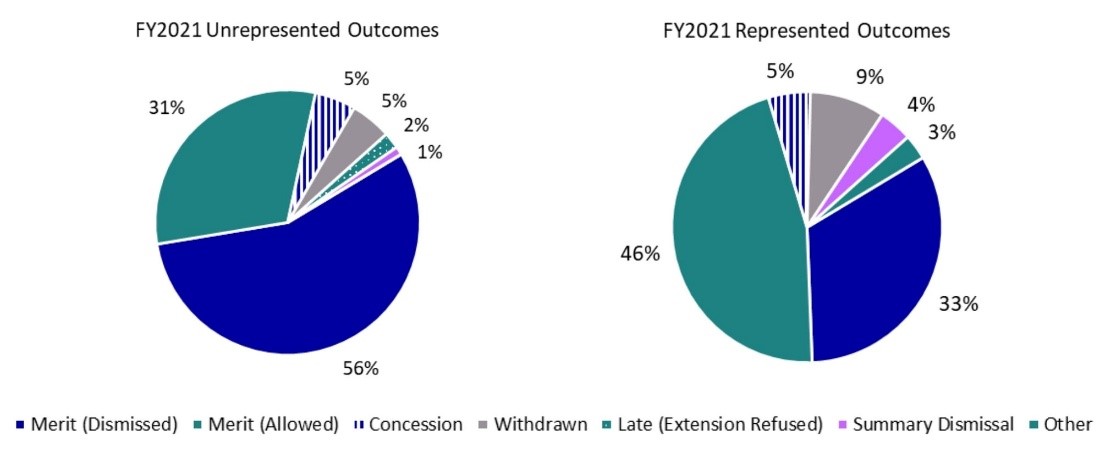
Text description of Annex 4.7.2f
| Outcome | % Share |
|---|---|
| Merit-Dismissed | 56% |
| Merit-Allowed | 31% |
| Concession | 5% |
| Withdrawn | 5% |
| Late-Extension of time refused | 2% |
| Summary Dismissal | 1% |
| Other | 0% |
| Outcome | % Share |
|---|---|
| Merit-Dismissed | 33% |
| Merit-Allowed | 46% |
| Concession | 5% |
| Withdrawn | 9% |
| Late-Extension of time refused | 0% |
| Summary Dismissal | 4% |
| Other | 3% |
- Note on charts: Percentage allowed rate is based on final decisions (allowed and dismissed) only.
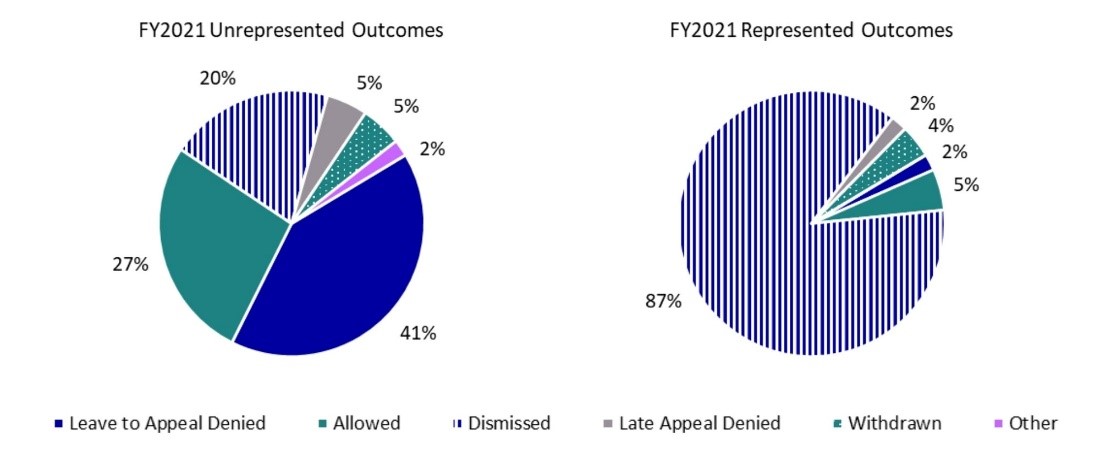
Text description of Annex 4.7.2g
| Outcome | % Share |
|---|---|
| Leave to Appeal Denied | 41% |
| Allowed | 27% |
| Dismissed | 20% |
| Late Appeal Denied | 5% |
| Withdrawn | 5% |
| Other | 2% |
| Outcome | % Share |
|---|---|
| Leave to Appeal Denied | 2% |
| Allowed | 5% |
| Dismissed | 87% |
| Late Appeal Denied | 2% |
| Withdrawn | 4% |
| Other | 0% |
- Note on charts: Percentage allowed rate is based on final decisions (allowed and dismissed) only.
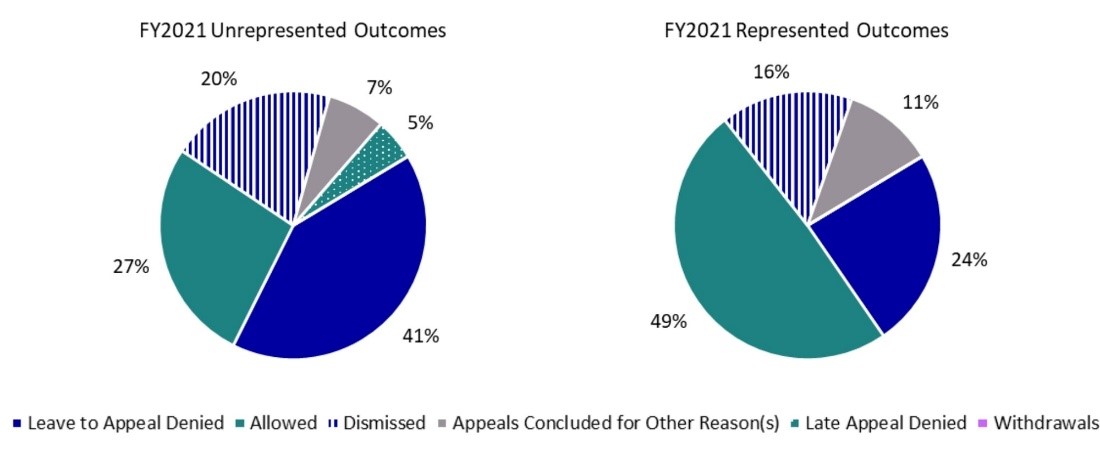
Text description of Annex 4.7.2h
| Outcome | % Share |
|---|---|
| Leave to Appeal Denied | 41% |
| Allowed | 27% |
| Dismissed | 20% |
| Appeals Concluded for other reasons | 7% |
| Late Appeal Denied | 5% |
| Withdrawals | 0% |
| Outcome | % Share |
|---|---|
| Leave to Appeal Denied | 24% |
| Allowed | 49% |
| Dismissed | 16% |
| Appeals Concluded for other reasons | 11% |
| Late Appeal Denied | 0% |
| Withdrawals | 0% |
- Note on charts: Percentage allowed rate is based on final decisions (allowed and dismissed) only.