
11. Canadian Indicators for the United Nations Convention on the Rights of Persons with Disabilities (CRPD) - article 29: participation in political and public life
On this page
- 11.1 Voted in the 2019 federal election
- 11.2 Voted in provincial elections held before the end of 2020
- 11.3 Voted in municipal or local elections held before the end of 2020
- 11.4 Membership or participation in a political party or group
Alternate formats
A PDF version of the Canadian Indicators for the United Nations Convention on the Rights of Persons with Disabilities is available on the index page.
11.1 Voted in the 2019 federal election
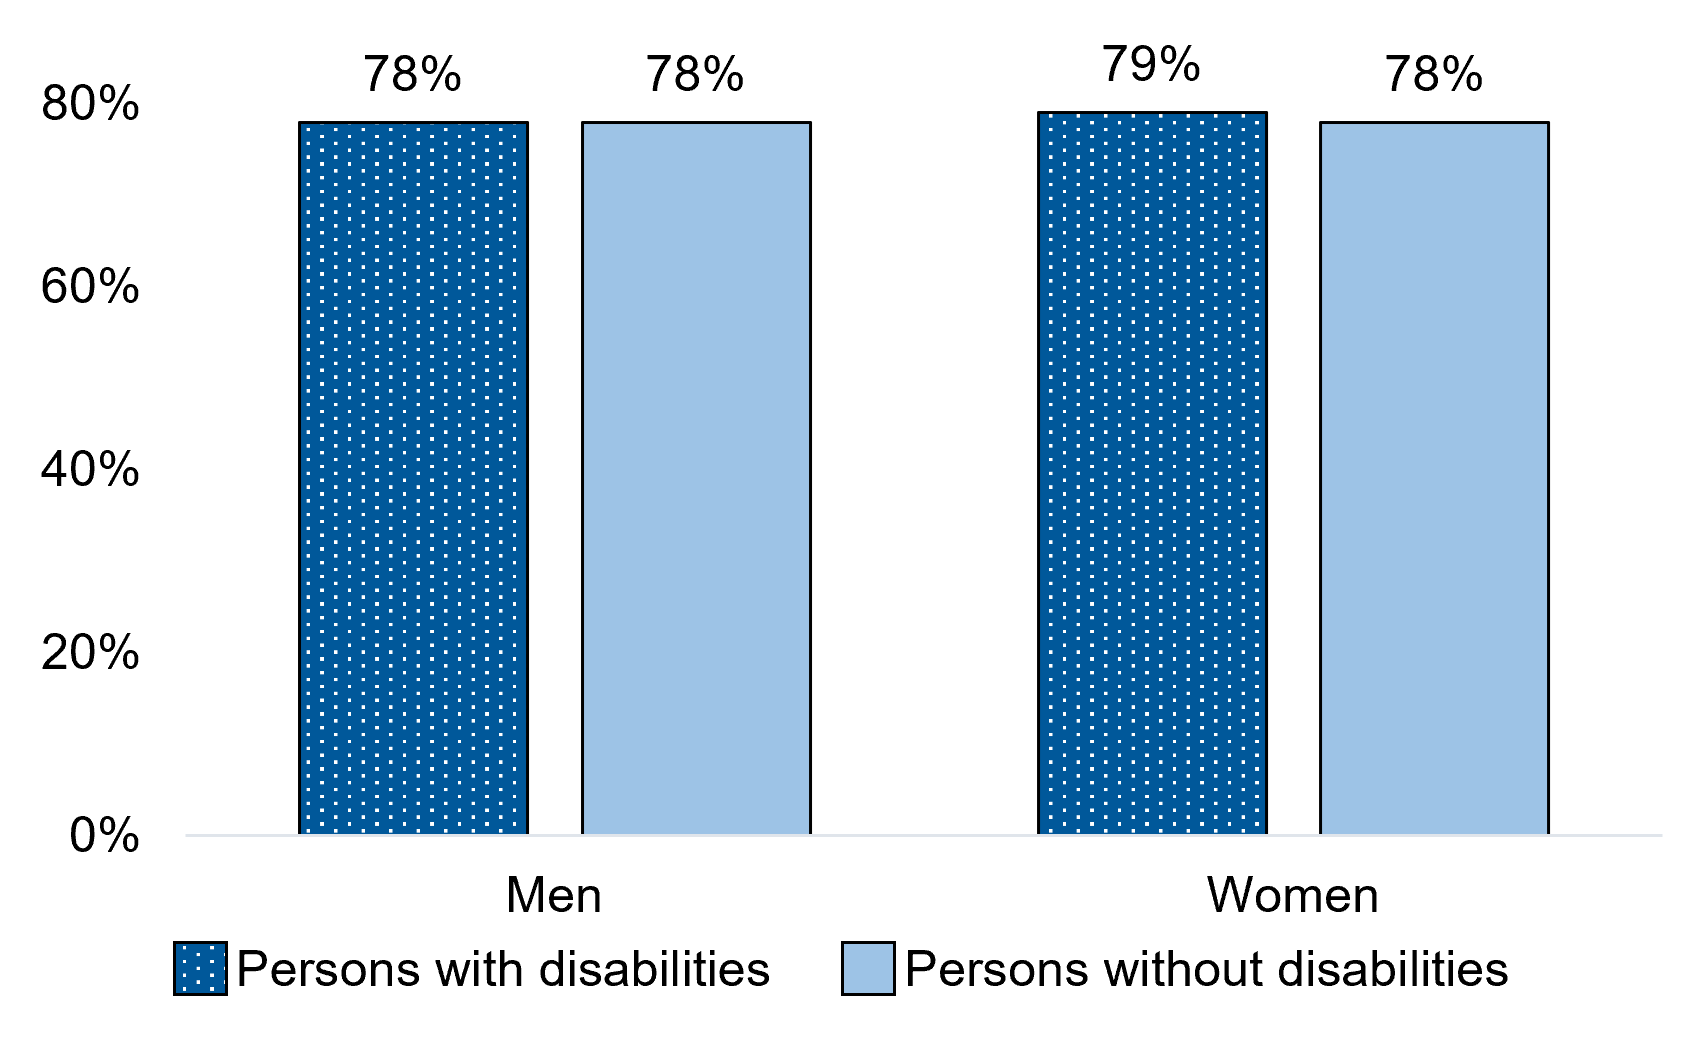
Figure 11.1 – Text description
| Gender | Persons with disabilities | Persons without disabilities |
|---|---|---|
| Men+ | 78% | 78% |
| Women+ | 79% | 78% |
- Notes: Respondents aged 18 years and over were asked if they had voted in the last federal election, which was held on October 21, 2019.
- To protect the confidentiality of non-binary persons, a two-category gender variable was used, given the relatively small size of this population in Canada. Non-binary respondents were redistributed into the men and women categories, denoted as "men+" and "women+" in charts and tables.
- Differences by disability status and by gender are not statistically significant (p<0.05).
- Source: Statistics Canada, General Social Survey - Social Identity, 2020 (Social Research Division calculations).
Similar proportions of men and women, with and without disabilities, aged 18 years and over indicated they had voted in the 2019 federal election – ranging from 78% to 79%.
11.2 Voted in provincial elections held before the end of 2020
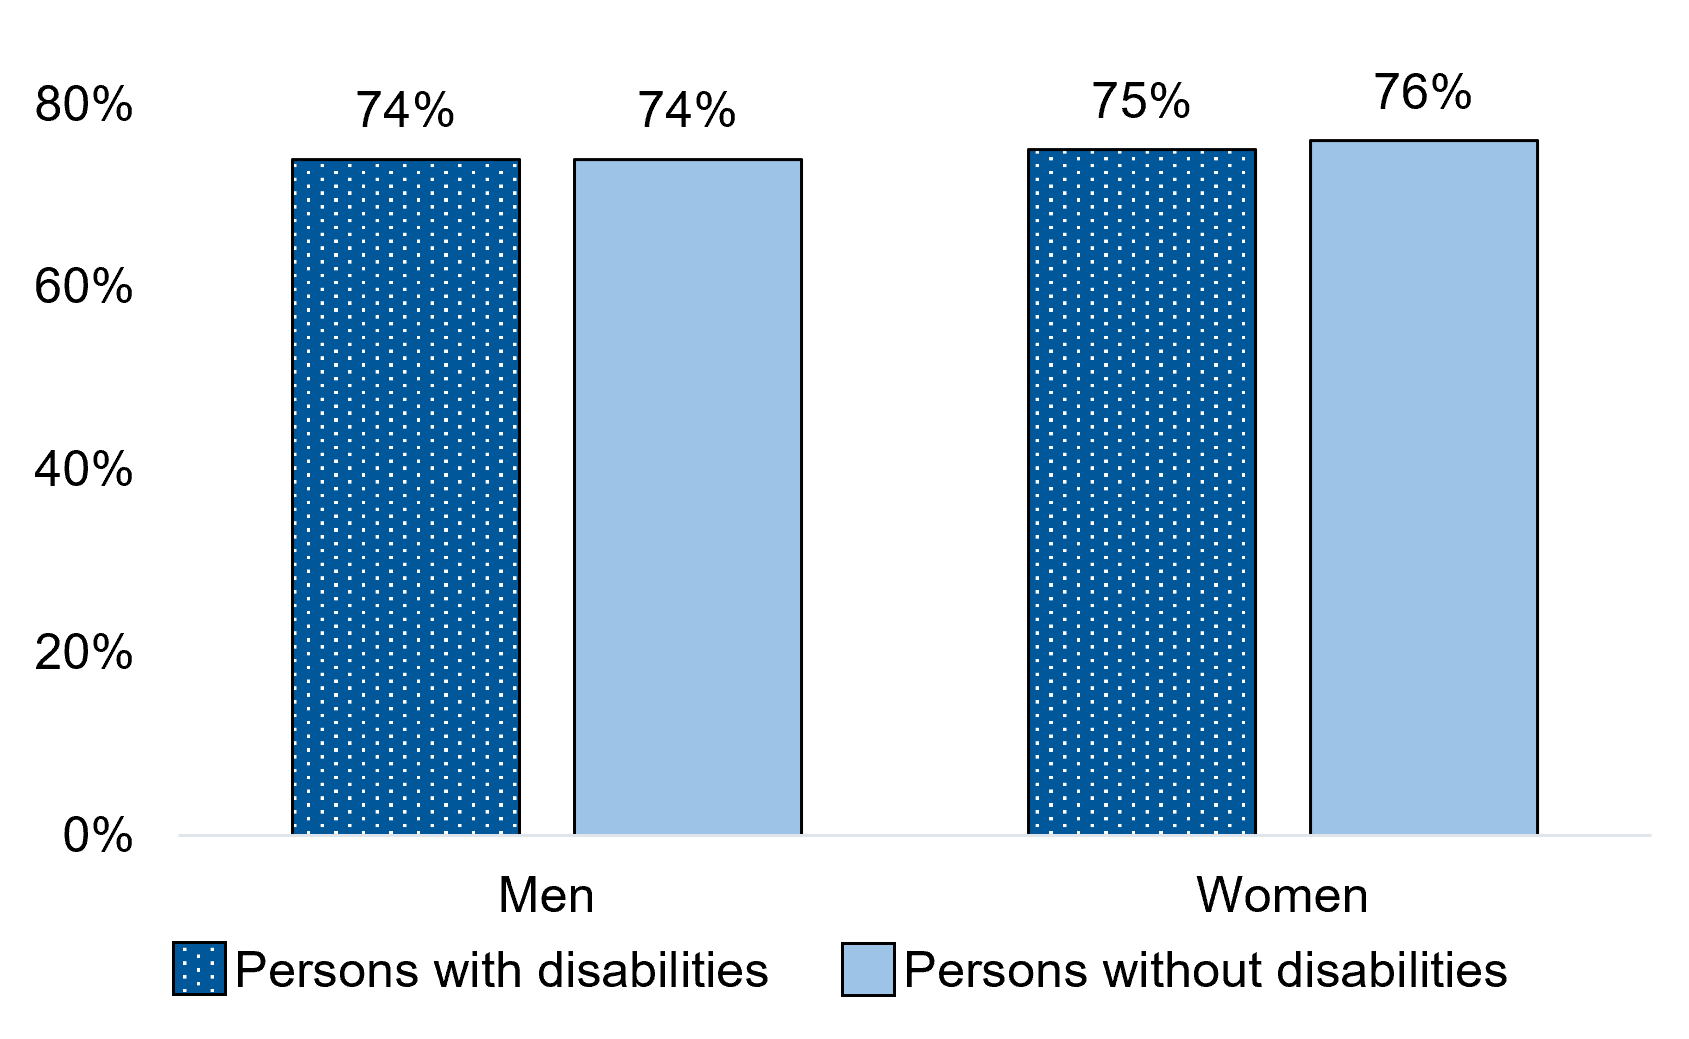
Figure 11.2 – Text description
| Gender | Persons with disabilities | Persons without disabilities |
|---|---|---|
| Men+ | 74% | 74% |
| Women+ | 75% | 76% |
- Notes: Respondents aged 18 years and over were asked whether they had voted in the last provincial election, prior to their participation in the survey. The 2020 General Social Survey was conducted between August 17, 2020 and December 16, 2020.
- To protect the confidentiality of non-binary persons, a two-category gender variable was used, given the relatively small size of this population in Canada. Non-binary respondents were redistributed into the men and women categories, denoted as “men+” and “women+” in charts and tables.
- Differences by disability status and by gender are not statistically significant (p<0.05).
- Source: Statistics Canada, General Social Survey - Social Identity, 2020 (Social Research Division calculations).
Similar proportions of men and women, with and without disabilities, aged 18 years and over indicated they had voted in their last provincial election – ranging from 74% to 76%.
11.3 Voted in municipal or local elections held before the end of 2020
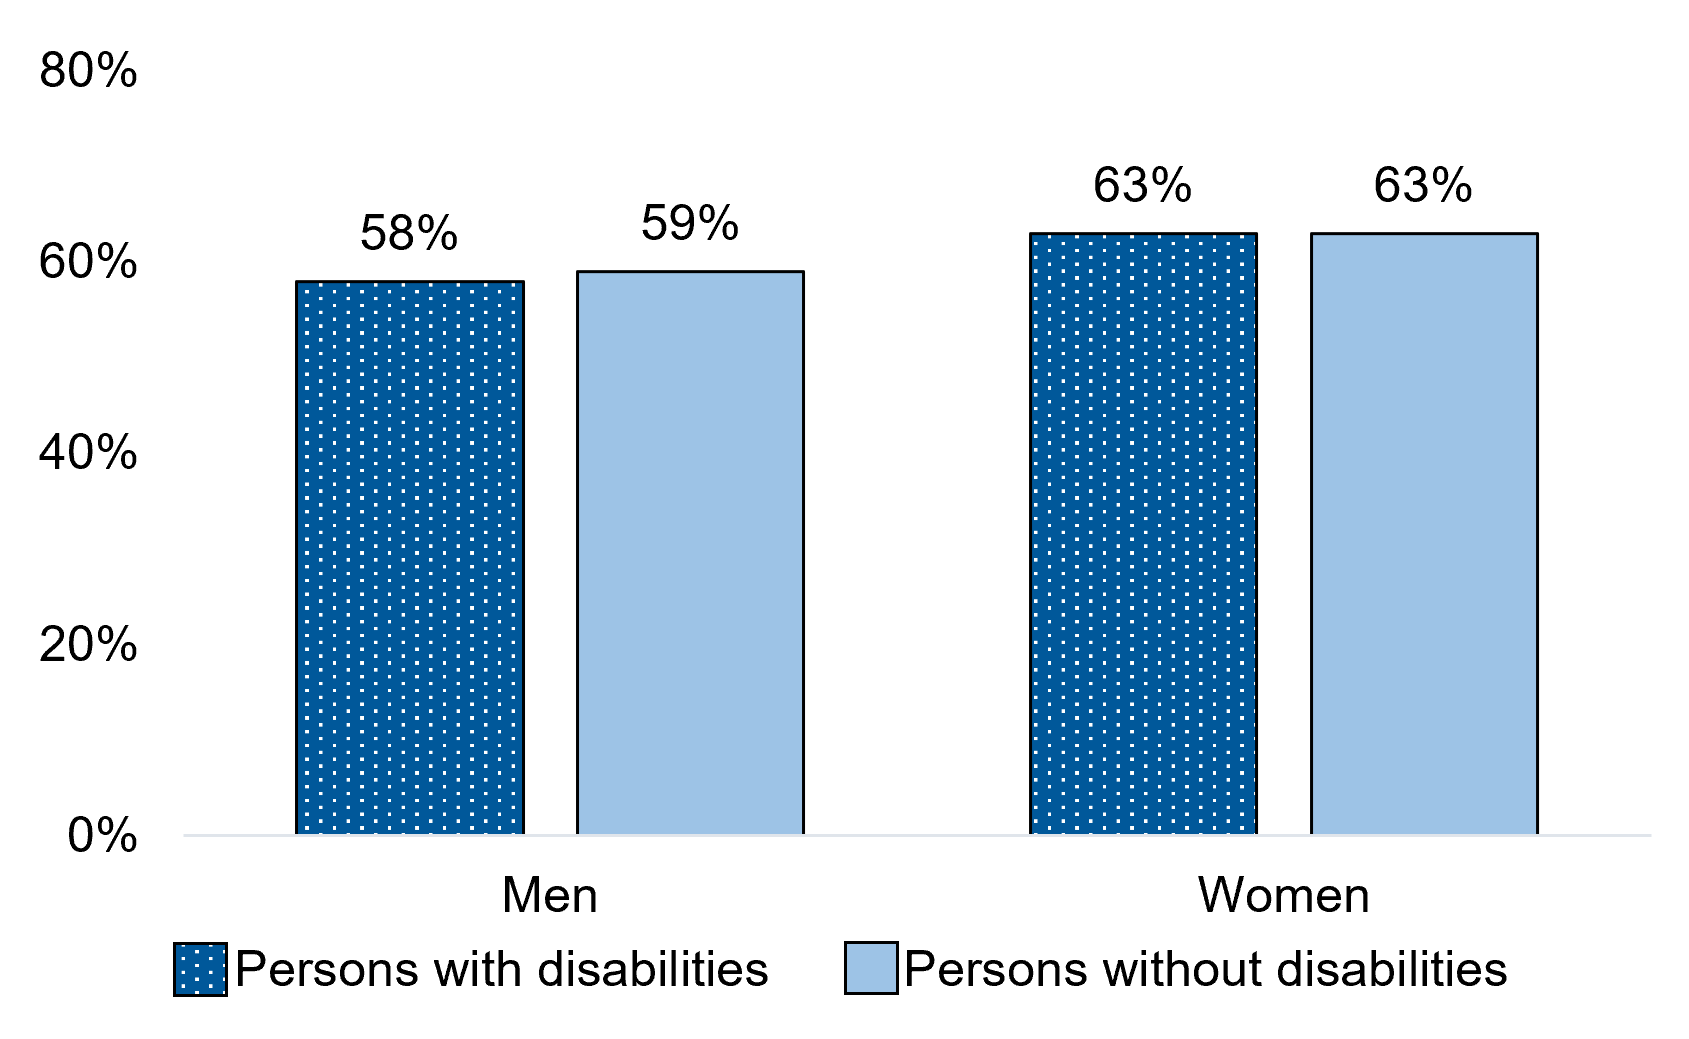
Figure 11.3 – Text description
| Gender | Persons with disabilities | Persons without disabilities |
|---|---|---|
| Men+ | 58% | 59% |
| Women+ | 63% | 63% |
- Notes: Respondents aged 18 years and over were asked whether they had voted in the last municipal or local election, prior to their participation in the survey. The 2020 General Social Survey was conducted between August 17, 2020 and December 16, 2020.
- To protect the confidentiality of non-binary persons, a two-category gender variable was used, given the relatively small size of this population in Canada. Non-binary respondents were redistributed into the men and women categories, denoted as “men+” and “women+” in charts and tables.
- Differences between persons with and without disabilities are not statistically significant for both men and women (p<0.05).
- Differences by gender are statistically significant for both persons with and without disabilities (p<0.05).
- Source: Statistics Canada, General Social Survey - Social Identity, 2020 (Social Research Division calculations).
Similar proportions of persons with and without disabilities, aged 18 years and over indicated they had voted in their last municipal or local election. Women were slightly more likely than men to indicate they had voted, for both persons with disabilities (63% versus 58%) and persons without disabilities (63% versus 59%).
11.4 Membership or participation in a political party or group
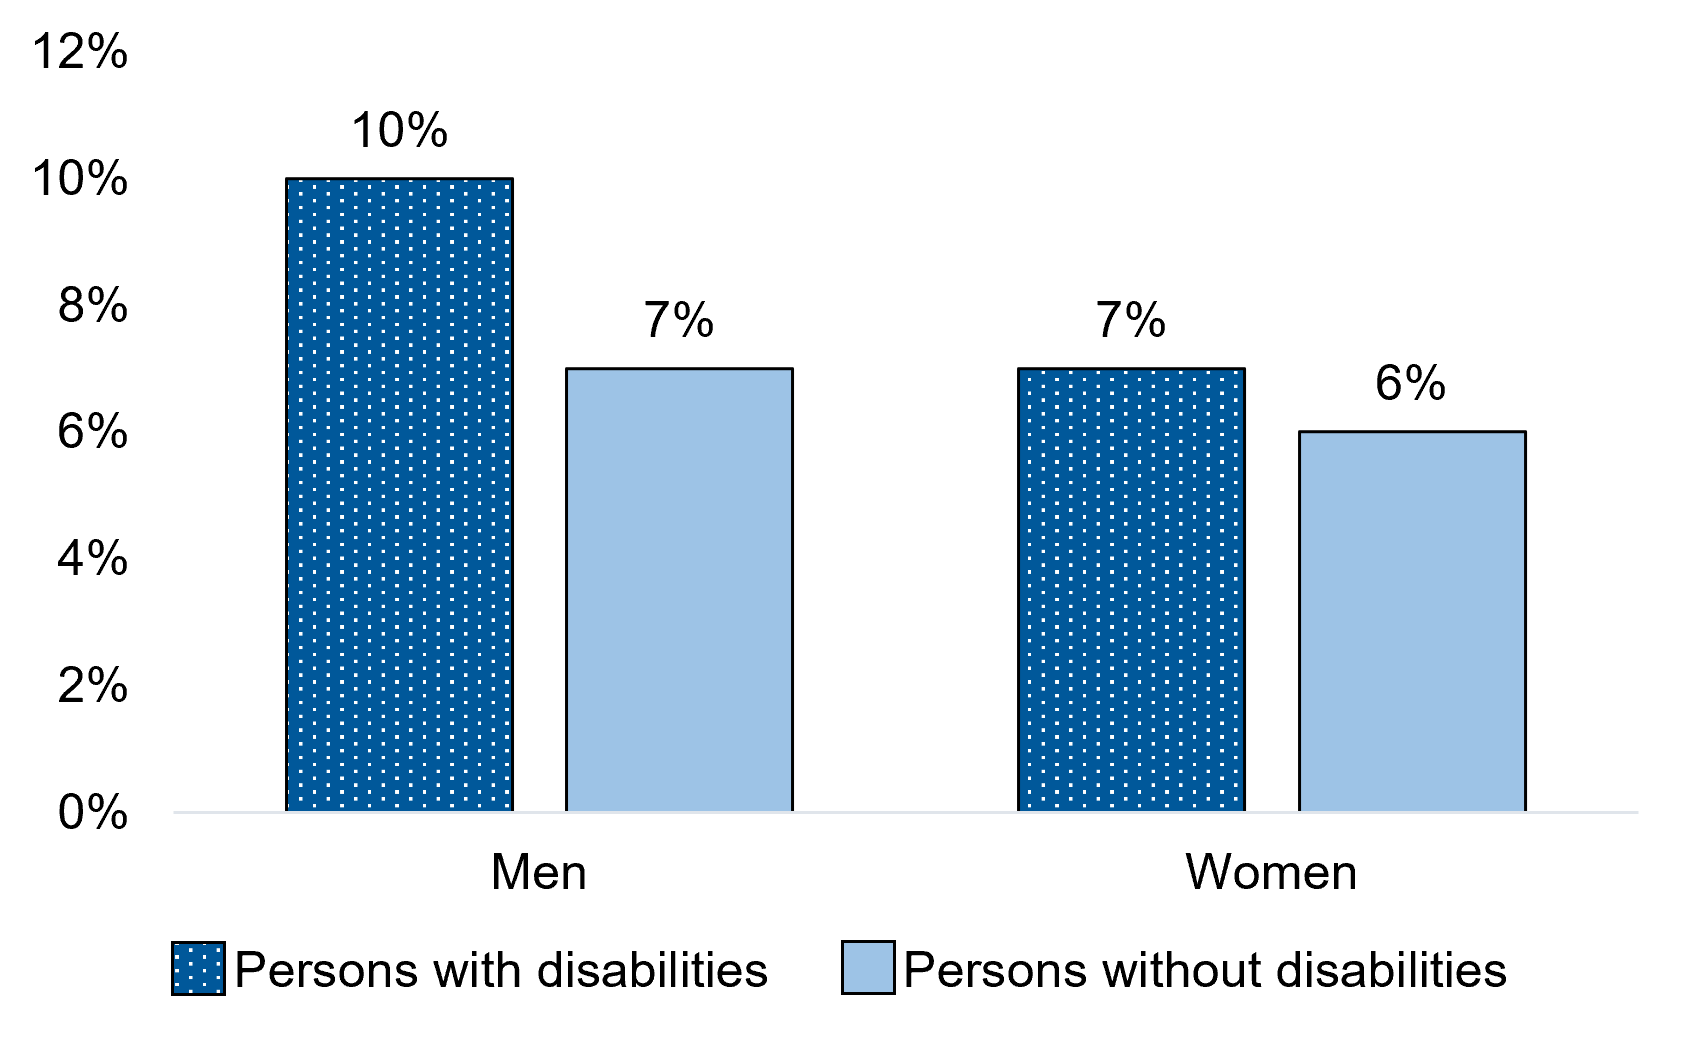
Figure 11.4 – Text description
| Gender | Persons with disabilities | Persons without disabilities |
|---|---|---|
| Men+ | 10% | 7%* |
| Women+ | 7% | 6% |
- * significantly different from estimate for persons with disabilities in the same gender category (p<0.05)
- Notes: Respondents were asked if, in the past 12 months, they were a member or participant in a political party or group.
- To protect the confidentiality of non-binary persons, a two-category gender variable was used, given the relatively small size of this population in Canada. Non-binary respondents were redistributed into the men and women categories, denoted as “men+” and “women+” in charts and tables.
- * significantly different from estimate for persons with disabilities in the same gender category (p<0.05)
- Differences between men and women are statistically significant for both persons with and without disabilities (p<0.05).
- Source: Statistics Canada, General Social Survey - Social Identity, 2020 (Social Research Division calculations).
Among men aged 15 years and over, those with disabilities were more likely than those without disabilities to be members or participants in a political party or group in the previous 12 months (10% versus 7%). Among women aged 15 years and over, similar proportions of those with and without disabilities reported membership or participation in a political party or group (7% and 6% respectively).