
Evaluation of the Canada Education Savings Program: Part 1
On this page
- List of figures
- List of tables
- List of abbreviations
- Executive summary
- Introduction
- Program background
- Key findings
- Management response action plan
- Annexes
- Annex A: Evaluation questions
- Annex B: Revised logic model – CESP
- Annex C: International findings
- Annex D: Previous key evaluation findings
- Annex E: Methodology
- References
- Glossary
Alternate formats

Large print, braille, MP3 (audio), e-text and DAISY formats are available on demand by ordering online or calling 1 800 O-Canada (1-800-622-6232). If you use a teletypewriter (TTY), call 1-800-926-9105.
List of figures
- Figure 1: Canada Learning Bond transactional partnerships
- Figure 2: Canada Learning Bond cumulative take-up rate as of 2020
- Figure 3: Canadian undergraduate tuition fees ($)
- Figure 4: Total value of the Direct Loan Portfolio in Canada at the end of academic year ($ millions)
- Figure 5: Registered Education Savings Plan contributions by year
- Figure 6: Educational Assistance Payments and Post-Secondary Education Withdrawals
- Figure 7: New beneficiaries
- Figure 8: Canada Education Saving Grant and Canada Learning Bond payments by family income
- Figure 9: Families with registered savings plans by parental income group in 2016
- Figure 10: Gender of Canada Education Savings Grant beneficiaries
- Figure 11: Gender of Canada Learning Bond beneficiaries
- Figure 12: Registered Education Savings Plan subscribers
- Figure 13: Families with Registered Savings Plans by family type in 2016
- Figure 14: Families with Registered Education Savings Plans by Indigenous status in 2016
- Figure 15: Families with Registered Education Savings Plans by immigration status of main income earner in 2016
- Figure 16: Number of Canada Learning Bond beneficiaries
- Figure 17: Cumulative national take-up of the Canada Learning Bond
- Figure 18: Percent of eligible children receiving the Canada Learning Bond in urban and rural areas and difference
- Figure 19: Number of Canada Learning Bond beneficiaries with and without Registered Education Savings Plan contribution
- Figure 20: Logic model
List of tables
- Table 1: Eligibility criteria for the Canada Education Savings Grant, Additional Amount of the Canada Education Savings Grant and the Canada Learning Bond
- Table 2: Canada Learning Bond adjusted income eligibility
- Table 3: Canada Education Savings Program incentives, total disbursements and number of beneficiaries, 2020
- Table 4: Impact of COVID-19 on number of new Canada Education Savings Program beneficiaries
- Table 5: Impact of COVID-19 on total number of Canada Education Savings Program beneficiaries
- Table 6: Postsecondary savings among children aged 17 and under, by household income quintile, 2020
- Table 7: 2020 Canada Learning Bond take-up rate: by province and territory
- Table 8: Parent/Caregiver focus groups breakdown
List of abbreviations
CCB
Canada Child Benefit
CESG
Canada Education Savings Grant
CESP
Canada Education Savings Program
CLB
Canada Learning Bond
CRA
Canada Revenue Agency
EAP
Educational Assistance Payments
ESDC
Employment and Social Development Canada
PSE
Post-secondary education
RESP
Registered Education Savings Plan
SIN
Social Insurance Number
Executive summary
Key findings
- The CESP serves its function by providing an incentive for parents, family and friends of children to save for their PSE, including those from low- and middle-income families. In 2020, $3.9 billion in funds were withdrawn from RESPs to assist students with their PSE expenses. This has increased by 102% from approximately $1.95 billion in 2010
- At the end of 2020, the total number of children who had ever received the CLB represented 41.9% of the eligible population. This figure indicates a need for greater awareness and easier access to the bond
- The education savings gap between children from low and middle-income families (such as, those eligible for the Additional Canada Education Saving Grant and/or CLB) and those from high-income families has narrowed significantly over time. The education savings gap diminished from over 33% in 2010 to approximately 3% in 2019. However, this trend reversed in 2020 when the gap grew to approximately 8% during the COVID-19 pandemic
- Barriers such as a lack of awareness, lack of understanding, and the complexity of the RESP opening process still exist. These barriers prevent potential beneficiaries from receiving the Canada Learning Bond
Recommendation
Explore options to simplify the process to access the Canada Learning Bond, and consider targeted strategies to increase CLB take-up among marginalized groups and populations in remote areas.
Introduction
This formative evaluation focuses primarily on the CLB but covers both federal education savings incentives administered by the CESP.
In recent years, numerous initiatives promoting the benefits of early savings in RESPs and improving access and take up of the CLB were undertaken. However, important knowledge gaps around how to achieve full participation remain.
Following the 2015 summative evaluation, this evaluation addresses the key outstanding questions related to challenges or barriers to take-up of the CLB among low-income families.
An upcoming impact evaluation of the overall program will follow this evaluation. It will examine CLB’s financial relevancy within the context of rising education and living costs for students.
CESP:
- CESG (not covered by the evaluation, but analyzed for comparison or context)
- Additional Amount of the CESG (Additional CESG) (not covered by the evaluation, but analyzed for comparison or context)
- CLB (covered by the evaluation)
ESDC’s Performance Measurement and Evaluation Committee approved the Evaluability Assessment on June 11, 2018, including the evaluation questions in Annex A.
This evaluation used 4 lines of evidence, including:
- a document and literature review
- an administrative data analysis
- 7 focus groups
- 24 key informant interviews
Annex E provides more details on the evaluation methodology, the lines of evidence and their limitations.
Program background
The CESP administers 2 federal education savings incentives:
- the CESG, which includes the Additional CESG
- the CLB
Timeline of program development
- 1972: RESP established
- 1998: CESG launched
- 2003: CESP formative evaluation
- 2004: CLB introduced
- 2005: Additional CESG introduced
- 2015: CESP (CESG + CLB) summative evaluation
- 2021: CESP evaluation focused on the CLB
- Forthcoming: CESP (CESG + CLB) impact evaluation
Established in 1972, RESPs allow subscriber contributions to grow tax-free until beneficiaries enter a post-secondary program.
The CESG was launched in 1998 to encourage Canadians to build savings for a child’s post-secondary education in RESPs. It provides a 20% grant on the first $2,500 in annual contributions to the child’s RESP until the end of the calendar year in which the child turns 17 years old.
A formative evaluation of the CESG in 2003 found that low-income families were not making full use of the program. In light of this finding, the Additional CESG was introduced in January 2005 to help low- and middle-income families build savings faster. The Additional CESG is a payment of 10% or 20% on the first $500 of contributions made each year on or after January 1, 2005, up to the end of the calendar year in which the beneficiary turns 17 years old.
The CLB was introduced in the 2004 Budget. The CLB is a government payment to an eligible child’s RESP:
- $500 for the first year of eligibility
- $100 for each subsequent benefit year of eligibility
- up to the benefit year in which the beneficiary turns 15
- maximum of $2,000
Contributions are not required to receive the CLB. Beneficiaries can also claim the CLB for previous years during which the child was eligible, until they turn 21, even if they held no RESP during those years.
- Frenette (2017) finds that having access to a RESP account at age 15 was associated with higher post-secondary enrolment rates by age 19, independent of family income
- Statistics Canada's Labour Force Survey found that the employment rate is consistently higher among those with post-secondary education
- In 2020, 419,898 students were able to continue their post-secondary education with funds withdrawn from an RESP
- Table 1 shows the eligibility criteria for the 3 incentives of the CESP
- Table 2 presents the CLB adjusted family income eligibility criteria
| Canada Education Savings Grant | Additional Amount of the Canada Education Savings Grant | Canada Learning Bond |
|---|---|---|
| Universal grant, regardless of family income | In 2020, adjusted family income of $48,535 or less = 20% (max per year: $100) | Born on or after January 1, 2004 |
| Maximum per year: $500 | In 2020, adjusted family income between $48,535 and $97,069 = 10% (max per year: $50) | Until the benefit year in which the beneficiary turns 15 years old |
| Up to the calendar year in which the beneficiary turns 17 years old | In 2020, adjusted family income over $97,069 = ineligible | Eligibility is limited to low-income families, based on number of children (see Table 2), or to children in the care of a public primary caregiver and receiving special allowance under the Children’s Special Allowances Act |
| Lifetime maximum a beneficiary can receive is $7,200 | Up to the calendar year in which the beneficiary turns 17 years old |
|
| Number of children | Adjusted income 2020 |
|---|---|
| 1 to 3 | Less than or equal to $48,535 |
| 4 | Less than $54,764 |
| 5 | Less than $61,016 |
Canada Learning Bond transactional partnerships
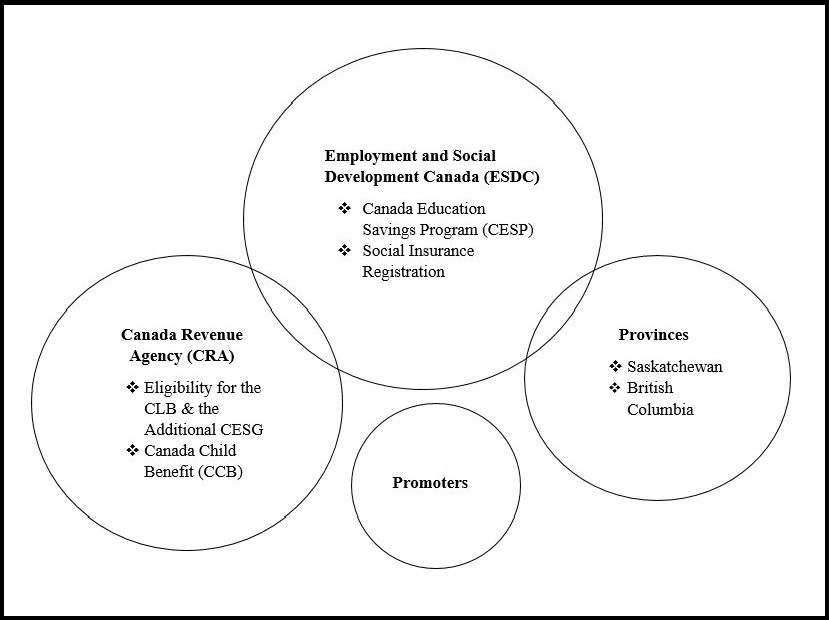
Figure 1 - Text version
- Employment and Social Development Canada (ESDC)
- Canada Education Savings Program (CESP)
- Social Insurance Registration
- Canada Revenue Agency (CRA)
- Eligibility for the CLB and the Additional CESG
- Canada Child Benefit (CCB)
- Provinces
- Saskatchewan
- British Columbia
- Promoters
Promoters are organizations that arrange and administer RESPs. There are 2 main types of providers (promoters) for RESPs:
- financial institutions such as banks, credit unions and investment firms
- group scholarship providers
Note: Most provinces do not have provincial savings incentives. However, the federal government helps Saskatchewan and British Columbia administer provincial savings incentives. Quebec administers its own provincial savings incentives.
Accessing the Canada Learning Bond
Opening an account in an RESP is a prerequisite for accessing the CLB.
In order to open an RESP, a subscriber must follow these steps:
- get a SIN for their child, and get one themselves if they do not already have one. There is no fee for a Social Insurance Number; however, certain documents, such as birth certificates, are required
- choose a suitable promoter for their needs. Most financial institutions (such as banks and credit unions) provide RESPs, as do certified financial planners and group plan dealers
Children are eligible if they are:
- from a low-income family
- born on or after January 1, 2004
- a Canadian resident
- holder of a valid Social Insurance Number, and
- named in an RESP
Once the child (RESP beneficiary) has graduated from high school and enrolled full-time or part-time in a qualifying post-secondary educational program, the subscriber can request, on his or her behalf, to withdraw money from the plan to help pay for their studies.
EAP include the interest earned in the plan as well as any CESG, provincial grants and CLB received.
EAP can be used to assist with post-secondary school expenses like tuition, books and transportation.
PSE withdrawals are withdrawals of contributions made by the subscriber without penalty if the beneficiary is enrolled in PSE. Although not required, they can be used to assist with PSE-related expenses.
Note that if the beneficiary does not attend a post-secondary educational program:
- contributions are returned tax-free to the subscriber
- all grants and bonds must be repaid to the federal government
Individuals who are eligible for the CLB, but have not yet received it, can apply for the incentive for themselves as soon as they turn 18. They will have up until the day before they turn 21 to apply.
The cumulative number of CLB beneficiaries increased to 1.6 million in 2020 and the take-up rate was 41.9%. In the same year, the overall take-up rate for the CESG was estimated at 53.9% (Figure 2).Footnote 4
Children from middle- and high-income families continue to receive the majority of federal education savings incentives. This means children from low-income families may face challenges accessing post-secondary education, and graduate with higher debt levels (Table 3)
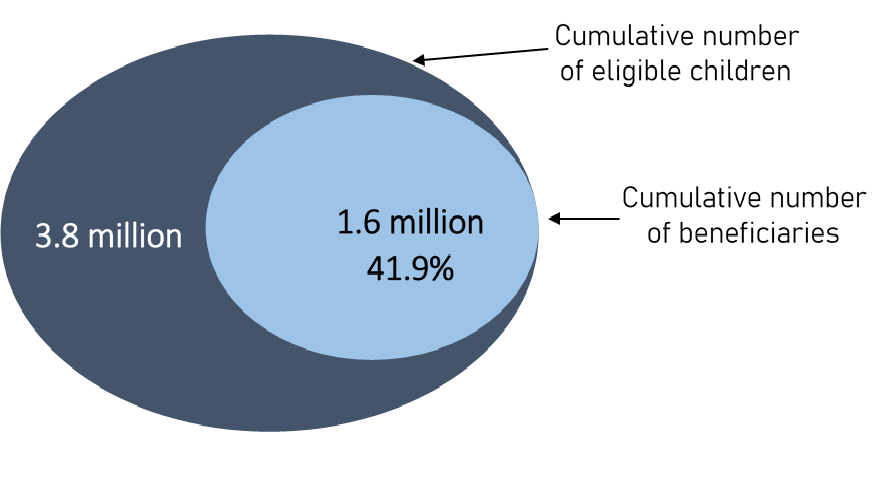
Figure 2 – Text version
Cumulative number of eligible children: 3.8 million
Cumulative number of beneficiaries: 1.6 million (41.9%)
| Savings incentives | Family income group | Total disbursements | Number of beneficiaries |
|---|---|---|---|
| Beneficiaries receiving the basic grant only (not qualified for the Additional CESG) | High-income families | $641 million | 1.8 million |
| Beneficiaries receiving both the Basic and the Additional CESG | Middle and low-income families | $393 million | 1.2 million |
| Beneficiaries receiving the CLB | Low-income families | $152 million | 728,088 |
The average Canadian undergraduate tuition fee per year has risen 28% from approximately $5,200 to $6,500 from 2010 to 2020.
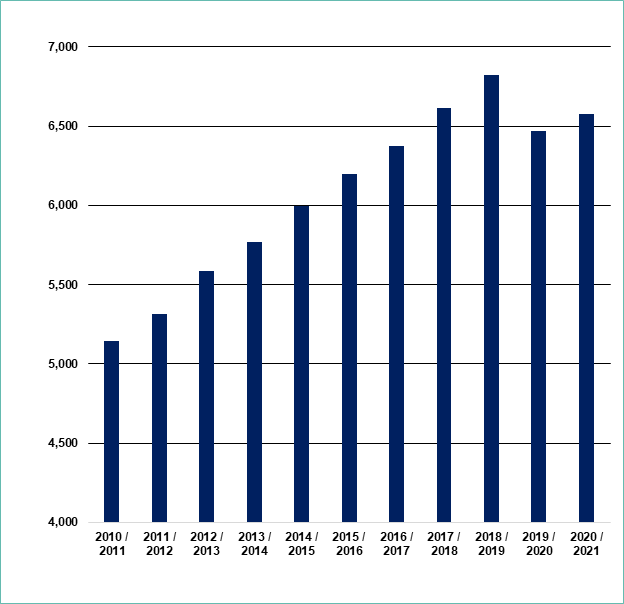
Figure 3 – Text version
| Year | 2010 to 2011 | 2011 to 2012 | 2012 to 2013 | 2013 to 2014 | 2014 to 2015 | 2015 to 2016 | 2016 to 2017 | 2017 to 2018 | 2018 to 2019 | 2019 to 2020 | 2020 to 2021 |
| Canadian Undergraduate Tuition Fees ($) | 5,146 | 5,313 | 5,586 | 5,767 | 5,998 | 6,201 | 6,375 | 6,618 | 6,822 | 6,468 | 6,580 |
In 2020, the trend of rising tuition fees reversed during the COVID-19 pandemic.
The total value of financial assistance received by students in the form of direct loans has grown 77%. The value increased from about $12.59 billion in 2009 to 2010 to about $22.34 billion in 2019 to 2020.
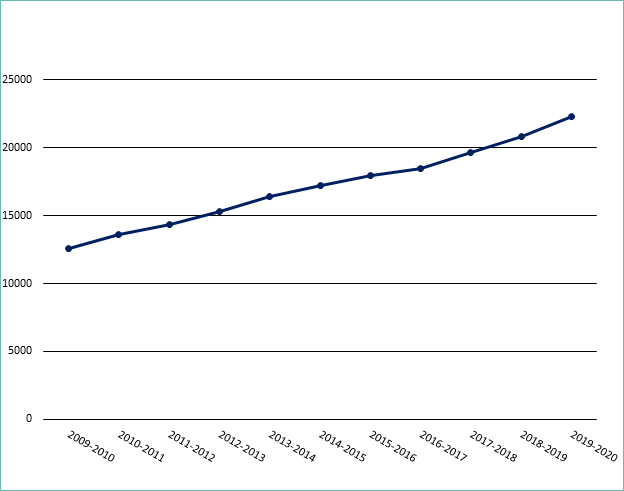
Figure 4 – Text version
| Year | 2009 to 2010 | 2010 to 2011 | 2011 to 2012 | 2012 to 2013 | 2013 to 2014 | 2014 to 2015 | 2015 to 2016 | 2016 to 2017 | 2017 to 2018 | 2018 to 2019 | 2019 to 2020 |
| Direct Loan Portfolio-Total ($ millions) | 12,598.7 | 13,647.4 | 14,372.1 | 15,284.8 | 16,447.4 | 17,206.6 | 17,996 | 18,488.3 | 19,623.3 | 20,808 | 22,342.2 |
There has been a steady increase in Student Financial Assistance over the last decade.
Over the same period, average student grant through the Canada Student Finance Assistance Program has increased by 54% (source: CSFA Administrative Data).
Research suggests that both non-repayable student grants and early supports for PSE planning and savings (such as the CLB) can significantly contribute to reduce inequalities in PSE participation (Annex C). Student grants provide targeted support based on a student’s financial need. Education savings motivate children to aspire to PSE, and help them afford PSE.
Key findings
Payments and contributions
The amount of contributions has increased 53% from approximately $3.4 billion in 2010 to around $5.2 billion in 2020.
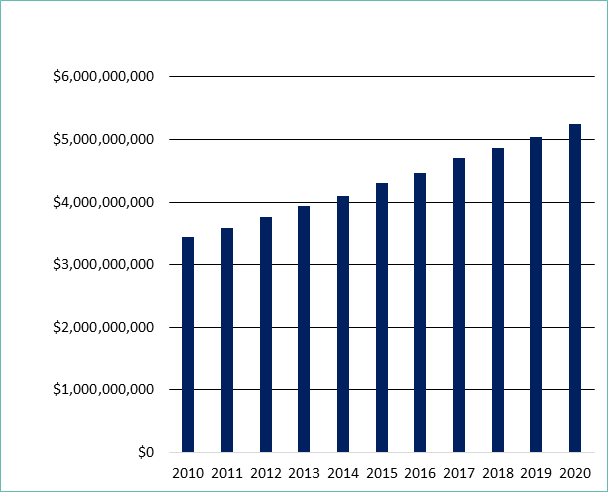
Figure 5 – Text version
| Year | 2010 | 2011 | 2012 | 2013 | 2014 | 2015 | 2016 | 2017 | 2018 | 2019 | 2020 |
| $ billions | $3.44 | $3.59 | $3.76 | $3.94 | $4.11 | $4.31 | $4.47 | $4.70 | $4.87 | $5.04 | $5.24 |
Canadians are contributing to RESPs, reflecting their desire to save for future education.
Government payments and interest earnings were $1.8 billion in 2020, having increased 71% from approximately $700 million in 2010. Individuals withdrew over $3.9 billion dollars in 2020.
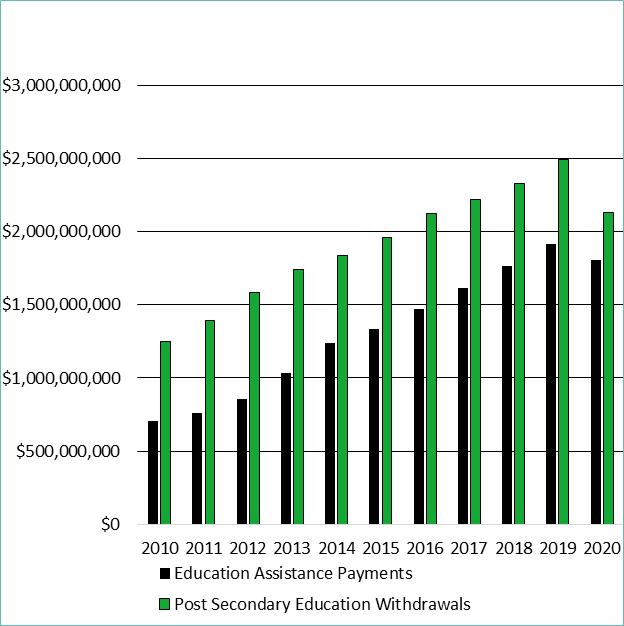
Figure 6 – Text version
| Year | 2010 | 2011 | 2012 | 2013 | 2014 | 2015 | 2016 | 2017 | 2018 | 2019 | 2020 |
| Educational Assistance Payments ($ billions) | 0.7 | 0.8 | 0.9 | 1.0 | 1.2 | 1.3 | 1.5 | 1.6 | 1.8 | 1.9 | 1.8 |
| Post Secondary Education Withdrawals ($ billions) | 1.2 | 1.4 | 1.6 | 1.7 | 1.8 | 2.0 | 2.1 | 2.2 | 2.3 | 2.5 | 2.1 |
Post-secondary Education Withdrawals are withdrawals from an RESP of previously contributed monies excluding, grants, bonds and interest. They could indicate spending by the parent/student towards post-secondary education expenses. There has been a 71% increase from 2010 to 2020.
Educational Assistance Payments are grants, bonds, and accumulated interest in an RESP. They represent support given by the program to help an eligible beneficiary cover expenses associated with PSE. These include federal and provincial education savings incentives paid into RESPs and accumulated returns over time. There has been a 157% increase in EAP withdrawals from 2010 to 2020.
Program take-up
The number of new CESP beneficiaries has decreased 9.3% from approximately 275,000 per year in 2010 to approximately 250,000 in 2020.
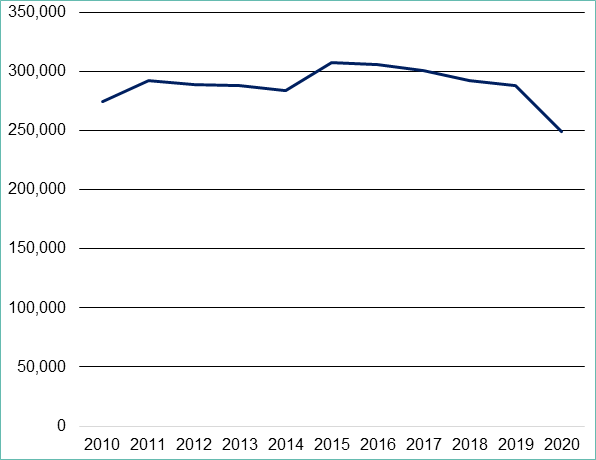
Figure 7 – Text version
| Year | 2010 | 2011 | 2012 | 2013 | 2014 | 2015 | 2016 | 2017 | 2018 | 2019 | 2020 |
| New beneficiaries | 274,605 | 292,765 | 288,953 | 288,275 | 284,106 | 307,498 | 305,820 | 301,106 | 292,897 | 288,540 | 248,978 |
The number of new beneficiaries has been relatively stable from 2010 to 2019, as Canadians continue to access post-secondary education incentives.
The recent decrease (13.7%) in number of new participants (288,540 in 2019 to 248,978 in 2020) could have been due to the coronavirus pandemic.
The number of new CLB beneficiaries has decreased 30.7% from 2019 to 2020 during the COVID-19 pandemic. The number of Basic CESG beneficiaries decreased 9.2% over the same period.
| New beneficiaries | 2019 | 2020 | Change between 2019 and 2020 |
|---|---|---|---|
| New CLB beneficiaries | 196,796 | 136,460 | -30.70% |
| New 20% Additional CESG beneficiaries | 76,956 | 58,364 | -24.20% |
| New 10% Additional CESG beneficiaries | 68,390 | 60,545 | -11.50% |
| New Basic CESG only beneficiaries | 143,194 | 130,069 | -9.20% |
| Total beneficiaries | 2019 | 2020 | Change between 2019 and 2020 |
|---|---|---|---|
| CLB beneficiaries | 780,549 | 728,088 | -6.70% |
| 20% Additional CESG beneficiaries | 558,121 | 540,239 | -3.20% |
| 10% Additional CESG beneficiaries | 678,950 | 691,833 | 1.90% |
| Basic CESG only beneficiaries | 1,752,178 | 1,772,916 | 1.20% |
Basic CESG beneficiaries (high-income) make up 47.5% of the population while all others (low/middle-income) make up 52.5%.
The number of CLB beneficiaries and 20% Additional CESG beneficiaries decreased the most during the pandemic. These beneficiaries comprise the lowest income population.
High-income families continue to receive the majority of CESG funding.
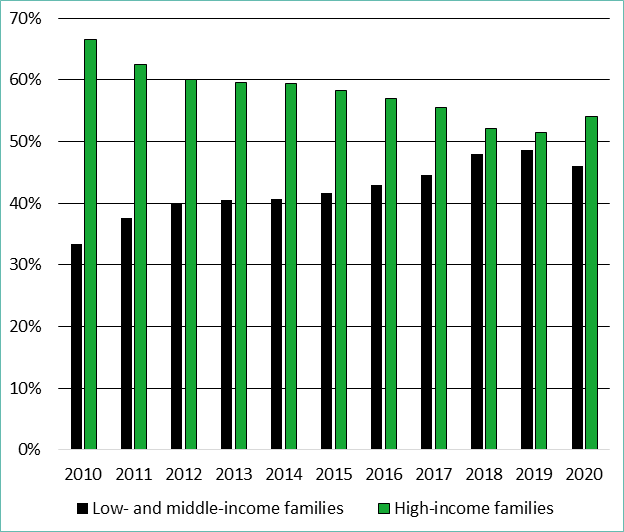
Figure 8 – Text version
| Year | 2009 | 2010 | 2011 | 2012 | 2013 | 2014 | 2015 | 2016 | 2017 | 2018 | 2019 | 2020 |
| Low- and middle-income families | 31.90% | 33.4% | 37.6% | 40.0% | 40.4% | 40.6% | 41.7% | 43.0% | 44.6% | 47.9% | 48.5% | 45.9% |
| High-income families | 68.10% | 66.6% | 62.4% | 60.0% | 59.6% | 59.4% | 58.3% | 57.0% | 55.4% | 52.1% | 51.5% | 54.1% |
The education savings gap between children from low- and middle-income families and those from higher-income families was closing until last year. Then it widened during the coronavirus pandemic.Footnote 15
In 2010, CESG and CLB payments made to RESPs of children from low- and middle-income families accounted for 33.4% of all incentives paid. By 2019, that figure had increased to 48.5%, but subsequently fell to 45.9% in 2020.
Families with incomes below $20,000 per year had an especially low level of RESP take-up.
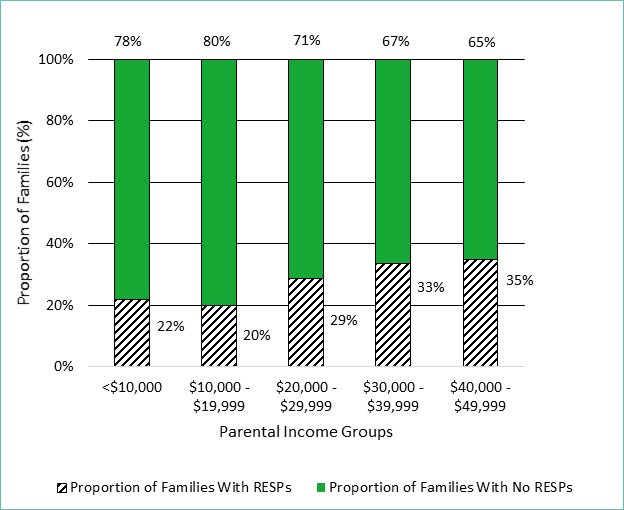
Figure 9 – Text version
| Income group | Less than $10,000 | $10,000 to $19,000 | $20,000 to $29,999 | $30,000 to $39,000 | $40,000 to $49,000 |
| Proportion of families with RESP | 22% | 20% | 29% | 33% | 35% |
| Proportion of families with no RESP | 78% | 80% | 71% | 67% | 65% |
In 2016, the bottom 2 quintiles ($0 to $19,999) were the least likely to have an RESP.
Education savings in Canada are growing, but savings remain low amongst the lowest income households.
Approximately 85% of children with education savings had an RESP in 2020, increased from 77% in 2013.
In 2020, only 48.4% of families in the first income quintile (less than $45,000) had education savings.
| Income quintile | Proportion with savings (%) | Proportion of savers with a RESP (%) | Average value of RESP at the end of 2019, current $ |
|---|---|---|---|
| First income quintile (Less than $45,000) | 48.4 | 75 | 8,454 |
| Second income quintile ($45,000 to less than $76,000) | 60.8 | 78.7 | 8,560 |
| Third income quintile ($76,000 to less than $105,000) | 70 | 85.5 | 11,662 |
| Fourth income quintile ($105,000 to less than $150,000) | 80.2 | 87.1 | 15,027 |
| Fifth income quintile ($150,000 and over) | 86.6 | 91 | 23,034 |
Average RESP dollar holdings increased for families in all income quintiles throughout the period. But holdings grew faster among families in the top income quintile in both absolute terms and relative terms. Footnote 19 This pattern held for both years examined—1999 and 2012.
In addition, Frenette (2017) finds that having access to an RESP account at age 15 was associated with higher post-secondary enrolment rates by age 19, independent of family income.
Beneficiaries of the CESG are almost evenly divided between males and females.
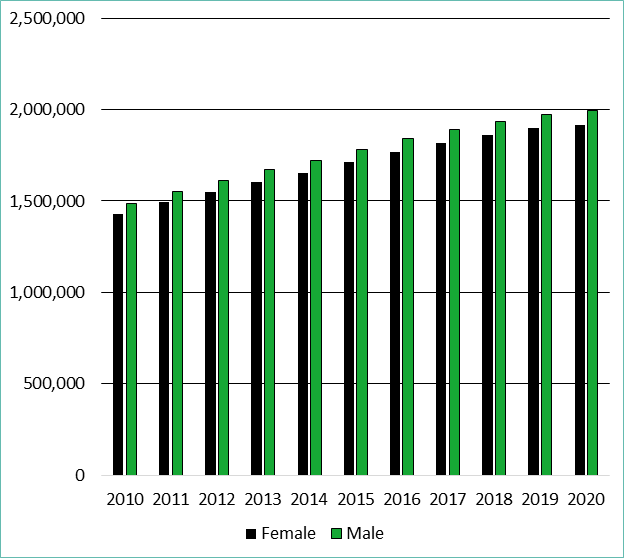
Figure 10 – Text version
| Year | 2010 | 2011 | 2012 | 2013 | 2014 | 2015 | 2016 | 2017 | 2018 | 2019 | 2020 |
| Female | 1,425,829 | 1,491,689 | 1,550,878 | 1,604,585 | 1,654,170 | 1,712,800 | 1,766,725 | 1,815,769 | 1,859,900 | 1,897,399 | 1,914,935 |
| Male | 1,483,322 | 1,551,852 | 1,613,706 | 1,671,375 | 1,722,703 | 1,782,902 | 1,838,870 | 1,889,641 | 1,935,542 | 1,975,047 | 1,993,196 |
CESG beneficiaries were 51% male and 49% female in 2020.
While the gap is small, it is persistent.
Beneficiaries of the CLB are almost evenly divided between males and females.
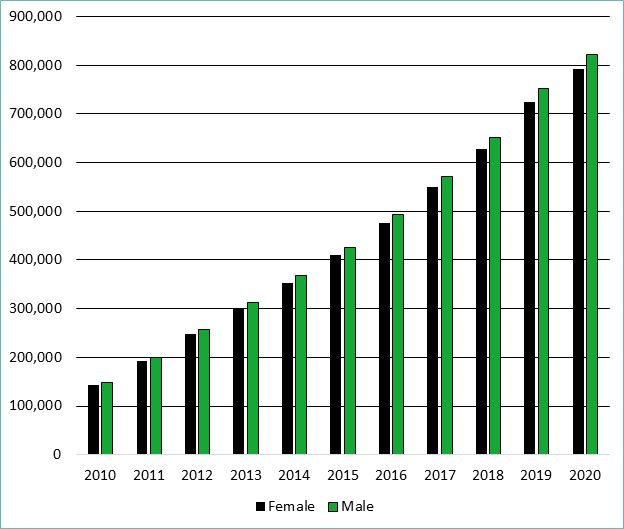
Figure 11 – Text version
| Year | 2010 | 2011 | 2012 | 2013 | 2014 | 2015 | 2016 | 2017 | 2018 | 2019 | 2020 |
| Female | 143,471 | 192,540 | 248,245 | 300,546 | 353,455 | 410,617 | 476,464 | 550,376 | 628,127 | 724,675 | 791,617 |
| Male | 148,840 | 199,734 | 258,079 | 312,397 | 367,332 | 426,190 | 494,058 | 570,775 | 651,865 | 752,113 | 821,631 |
CLB beneficiaries were 51% male and 49% female in 2020. While the gap is small, it is persistent.
Close to 90% of RESP subscribers are parents.
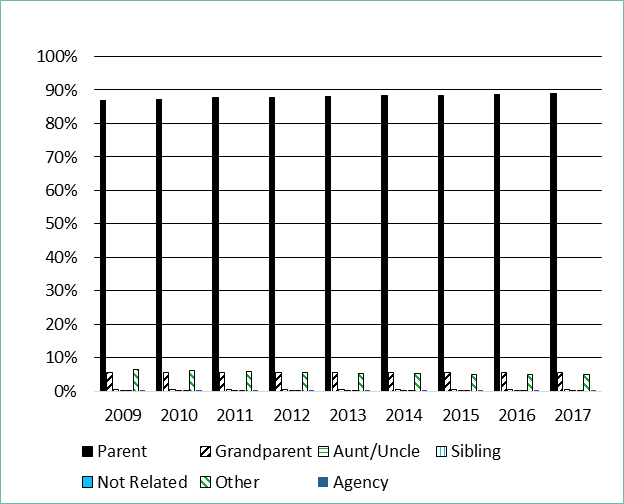
Figure 12 – Text version
| Subscriber | 2009 | 2010 | 2011 | 2012 | 2013 | 2014 | 2015 | 2016 | 2017 |
| Parent | 86.86% | 87.22% | 87.63% | 87.87% | 88.13% | 88.26% | 88.45% | 88.62% | 88.82% |
| Grandparent | 5.60% | 5.62% | 5.57% | 5.58% | 5.61% | 5.64% | 5.59% | 5.56% | 5.48% |
| Aunt/uncle | 0.50% | 0.50% | 0.48% | 0.48% | 0.47% | 0.46% | 0.45% | 0.44% | 0.42% |
| Sibling | 0.24% | 0.22% | 0.22% | 0.21% | 0.20% | 0.20% | 0.20% | 0.20% | 0.20% |
| Not related | 0.26% | 0.23% | 0.20% | 0.18% | 0.16% | 0.14% | 0.13% | 0.12% | 0.11% |
| Other | 6.51% | 6.20% | 5.87% | 5.65% | 5.42% | 5.29% | 5.15% | 5.03% | 4.94% |
| Agency | 0.02% | 0.02% | 0.02% | 0.03% | 0.02% | 0.02% | 0.04% | 0.04% | 0.03% |
In 2017, grandparents were the second most popular subscribers.
A greater proportion of 2-parent households had RESPs compared to single-parent families and other family types.
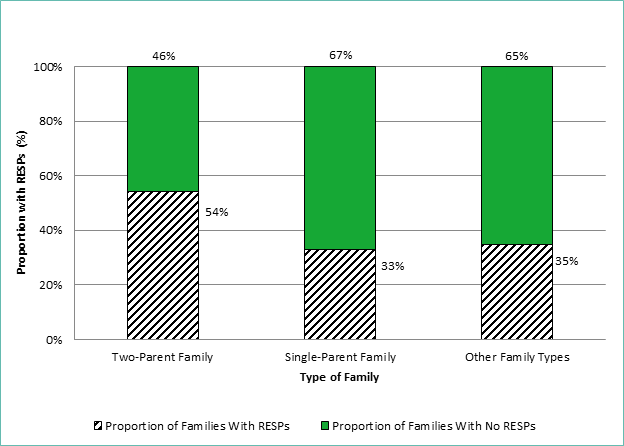
Figure 13 – Text version
Proportion of families with RESPs
- Two-parent: 54%
- Single-parent: 33%
- Other: 35%
Proportion of families with no RESPs
- Two-parent: 46%
- Single-parent: 67%
- Other: 65%
Single-parent families made up the lowest proportion of families with RESPs in 2016 (33%), compared to 2-parent families (54%) and other types of families (35%). This is indicative of a higher difficulty for single-parent families to save for education.
Non-Indigenous households proportionately have higher RESP uptake rates than their Indigenous counterparts do.
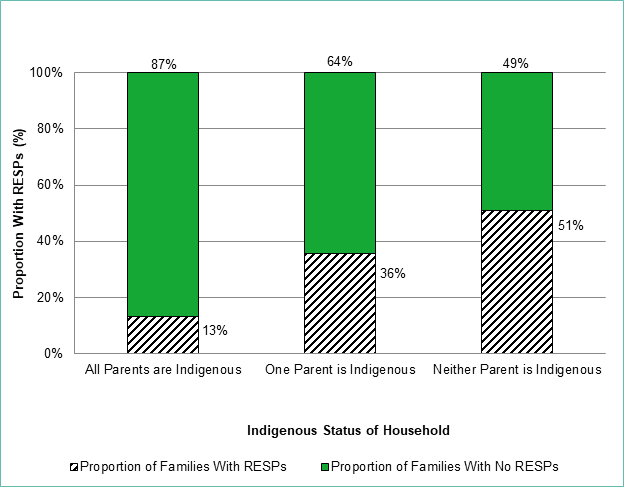
Note: All parents are Indigenous: includes both single-parent and 2-parent households.
Note: One parent is Indigenous: only includes 2-parent households.
Figure 14 – Text version
Proportion of families with RESPs
- All parents Indigenous: 13%
- One parent Indigenous: 36%
- Neither parent Indigenous: 51%
Proportion of families with no RESPs
- All parents Indigenous: 87%
- One parent Indigenous: 64%
- Neither parent Indigenous: 49%
In 2016, only 13% of families where all parents are Indigenous had an RESP. This indicates a need to investigate the barriers facing Indigenous populations.
Recent immigrants (those who had been in the country for less than 5 years) were less likely to have RESPs than non-immigrants and immigrants who had spent more than 5 years in Canada.
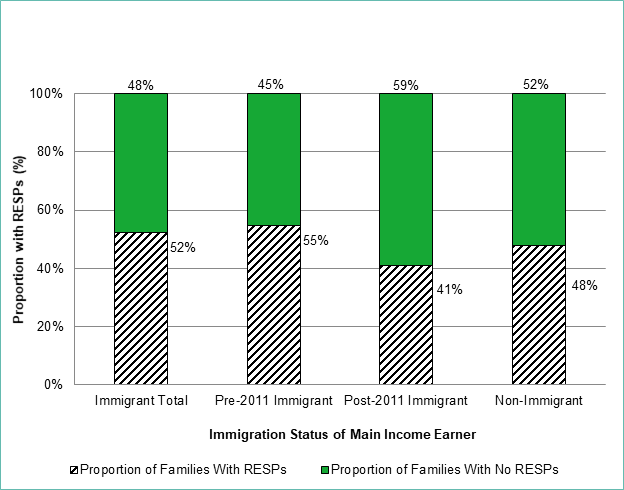
Figure 15 – Text version
Proportion of families with RESPs
- Immigrant: 52%
- Pre-2011 immigrant: 55%
- Post-2011 immigrant: 41%
- Non-immigrant: 48%
Proportion of families with no RESPs
- Immigrant: 48%
- Pre-2011 immigrant: 45%
- Post-2011 immigrant: 59%
- Non-immigrant: 52%
Investigating the barriers faced by new immigrants could explain the disparity and help close the gap with those who have resided since before 2011.
In general, immigrants use RESPs more than non-immigrants do.
The number of Canadians receiving the CLB every year steadily increased from the program’s inception until 2020.
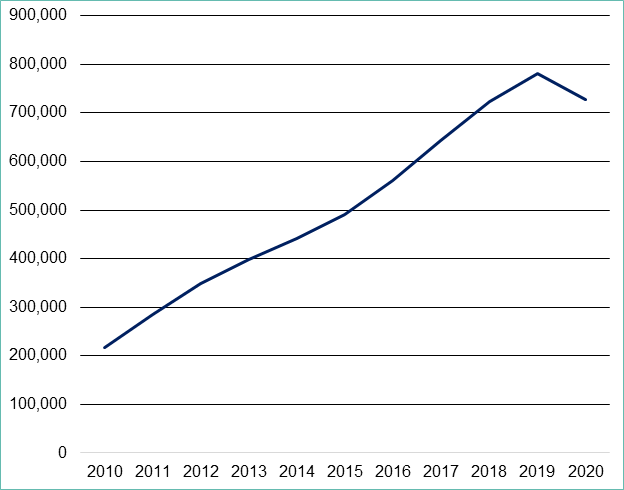
Figure 16 – Text version
| Year | 2010 | 2011 | 2012 | 2013 | 2014 | 2015 | 2016 | 2017 | 2018 | 2019 | 2020 |
| CLB beneficiaries | 217,821 | 284,635 | 348,678 | 398,065 | 441,663 | 491,332 | 559,735 | 643,525 | 723,424 | 780,499 | 728,088 |
There has been a 234% increase in the number of CLB beneficiaries from 2010 to 2020.
From 2019 to 2020, the number of CLB beneficiaries decreased 7% from 780,499 to 728,088 during the COVID-19 pandemic.
Approximately 41.9% of Canadians eligible for the CLB had received it as of 2020.
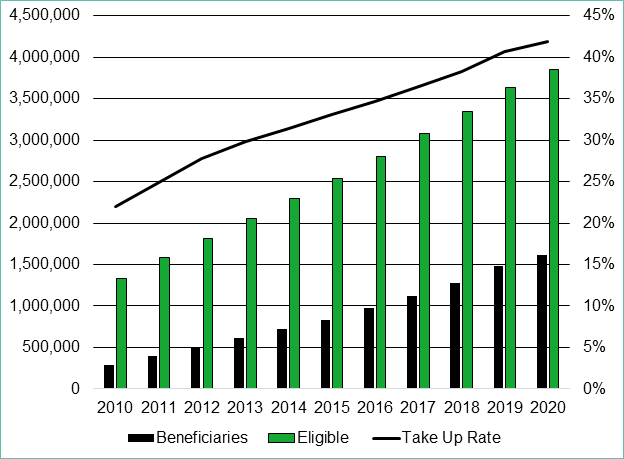
Figure 17 – Text version
| Year | 2010 | 2011 | 2012 | 2013 | 2014 | 2015 | 2016 | 2017 | 2018 | 2019 | 2020 |
| Beneficiaries | 292,311 | 392,274 | 506,324 | 612,943 | 720,787 | 836,807 | 970,522 | 1,121,151 | 1,279,992 | 1,476,788 | 1,613,248 |
| Eligible | 1,330,803 | 1,579,377 | 1,819,356 | 2,057,711 | 2,291,864 | 2,533,653 | 2,804,205 | 3,074,222 | 3,347,770 | 3,629,495 | 3,848,191 |
| Take-up rate | 22% | 25% | 28% | 30% | 31% | 33% | 35% | 36% | 38% | 41% | 42% |
The take-up rate has grown from approximately 22% in 2010 to over 41.9% in 2020.
This shows a significant increase in the use of the bond.
CLB take-up remains below 50% in urban areas and below 30% in rural areas.
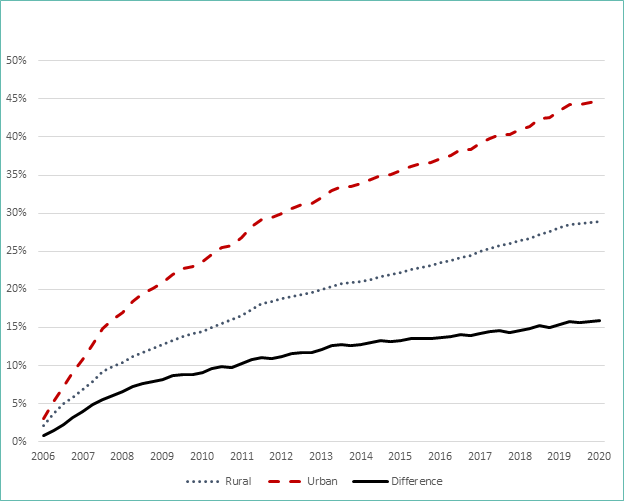
Figure 18 – Text version
| 2006 | 2007 | 2008 | 2009 | 2010 | 2011 | 2012 | 2013 | 2014 | 2015 | 2016 | 2017 | 2018 | 2019 | 2020 | |
| Rural | 2% | 7% | 10% | 13% | 14% | 17% | 19% | 20% | 21% | 22% | 24% | 25% | 26% | 28% | 29% |
| Urban | 3% | 11% | 17% | 21% | 24% | 27% | 30% | 32% | 34% | 36% | 37% | 39% | 41% | 43% | 45% |
| Difference | 1% | 4% | 7% | 8% | 9% | 10% | 11% | 12% | 13% | 13% | 14% | 14% | 15% | 15% | 16% |
There is a gap in take-up of approximately 15% in 2020 between eligible urban and rural children.
Urban take-up increased from 22% in 2010 to 45% in 2020.
Rural take-up increased from 13% in 2010 to 29% in 2020.
In 2020, approximately 526,000 (72%) CLB beneficiaries received personal contributions to their RESP while approximately 202,000 (28%) did not.
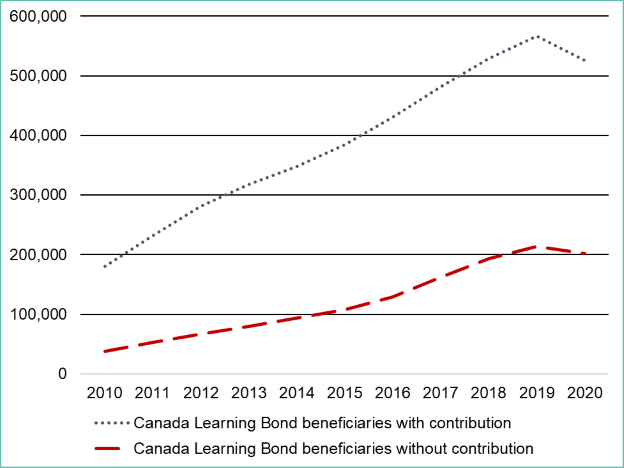
Figure 19 – Text version
| Year | 2010 | 2011 | 2012 | 2013 | 2014 | 2015 | 2016 | 2017 | 2018 | 2019 | 2020 |
| Canada Learning Bond recipient with contribution | 180,273 | 232,064 | 281,789 | 318,076 | 347,385 | 384,121 | 430,130 | 481,492 | 529,557 | 566,816 | 526,057 |
| Canada Learning Bond recipient without contribution | 37,548 | 52,571 | 66,889 | 79,989 | 94,278 | 107,211 | 129,605 | 162,033 | 193,867 | 213,683 | 202,031 |
The proportion of CLB beneficiaries without contributions to RESPs has increased from 17% in 2010 to over 27% in 2020.
From 2010 to 2020, the number of CLB recipients who received contributions increased 192%, from approximately 180,000 to 526,000. Meanwhile, the number of recipients who did not increased 438%, from approximately 37,500 to 202,000.
Provinces that offer an additional incentive beyond those offered by the federal government have a higher participation rate for the CLB.
Quebec and British Columbia have the highest uptake at 48.3% and 50.4%, respectively, according to the 2020 annual Statistical Review.
British Columbia and Quebec are the only 2 provinces that offer additional incentives: Footnote 30
- in British Columbia for example, an eligible beneficiary can receive $1,200 without any contributions in addition to the federal incentives
| Provinces and territories | Cumulative number of children in receipt of CLB | Cumulative number of children eligible for CLB | CLB take –up rate |
| Newfoundland and Labrador | 12,642 | 45,115 | 28.0% |
| Prince Edward Island | 4,963 | 15,371 | 32.3% |
| Nova Scotia | 30,550 | 94,337 | 32.4% |
| New Brunswick | 24,838 | 75,870 | 32.7% |
| Quebec | 407,632 | 844,018 | 48.3% |
| Ontario | 594,053 | 1,440,531 | 41.2% |
| Manitoba | 61,594 | 195,221 | 31.6% |
| Saskatchewan | 45,464 | 161,010 | 28.2% |
| Alberta | 200,975 | 496,194 | 40.5% |
| British Columbia | 222,724 | 441,853 | 50.4% |
| Yukon | 1,155 | 3,623 | 31.9% |
| Northwest Territories | 928 | 5,813 | 16.0% |
| Nunavut | 274 | 10,719 | 2.6% |
Barriers
Low income, Indigenous peoples, refugees, rural inhabitants, people with disabilities, and non-official language speakers are identified by key informants as more likely to face barriers. Footnote 32
Single-parent families, Indigenous groups and recent immigrants are less likely to access RESPs when compared to their counterparts. This also means that these groups are less likely to have access to the CLB.
Costs: There are several components to the cost to participate in the CESP. Many respondents indicated it takes time to find out information about the incentive, its requirements, and gain access:
- one respondent mentioned that there are costs associated with:
- applying for the birth certificate
- childcare
- transportation to the government office and financial institution
- a few participants mentioned being in "survival mode." They are not able to act on long-term goals, as they have to take care of their immediate needs of housing, clothing etc.
Indigenous peoples: Many respondents identified Indigenous populations as facing a unique mix of barriers:
- mistrust of government because of historical persecution may make interacting with the government less likely, and
- living in a remote area may reduce the availability of post-secondary options, government offices, and financial institutions
Refugees: Some focus group participants and interviewees also pointed to refugees and new immigrants:
- language barriers may increase administrative burden to participate, and
- previous persecution may decrease interaction with the government
Time
Some internal stakeholders, promoters and representatives of Community-based Organizations pointed out the following aspects related to time as a barrier:
- it takes time to meet with a financial institution representative
- parents and caregivers are not able to take time from work to go and open an account for their children due to the day-to-day constraints and priorities
- the same situation occurs for mothers of several children since they have difficulty taking time away from care of their children, and
- the difficulty for some is the time needed to get the required documents and go to the bank to set it up
Required documents and associated costs
The majority of stakeholders and recipients interviewed pointed out the difficulties in gathering the required documents. Associated costs are another barrier to applying for the CLB:
- to request the CLB requires both the parent and child to have a SIN
- to obtain the SIN requires supporting documentation such as the child's birth certificate, which further require the birth to have been registered, and
- the cost of obtaining the birth certificate ranges from $10 to $45, depending on the province, which can be expensive for low-income families
Remoteness, access to services and associated costs
Many noted that the limited number of promoters offering the CLB was a barrier to getting this benefit:
- given the lack of nearby service points and the distance between certain areas and the points of service, travel by plane may be required in some cases to get the required documents or open the RESP in order to request for the CLB. This increases costs considerably for those individuals affected, and
- parents/caregivers might have to pay transportation costs (for example bus fare, parking, and/or taxi) to attend multiple bank appointments
Mistrust
Some stakeholders and recipients mentioned mistrust as a major barrier to requesting the CLB:
- some participants were suspicious and worried that the program was a scam and that they might lose their savings
- some participants had negative experiences with financial institutions, which led to a lack of trust in the banking system, and
- some parents or guardians indicated that the idea of 'free money' increased their distrust of the program
Awareness and understanding
According to the stakeholder organizations, parents/caregivers sometimes fear that these savings incentives will have unintended consequences in the future, such as:
- tax penalties, and
- impact on other savings or reductions in other post-secondary funding opportunities
The lack of understanding of program specifics emerged as a concern during focus groups with parents/caregivers, with questions such as:
- what if my child studies outside of Canada?
- what happens if my child gets a scholarship?
- what expenses are covered by the CLB?
- what happens to the money if my child does not pursue post-secondary education?
Service Canada Citizen Services Specialists, as internal stakeholders, pointed out some barriers due to lack of awareness and understanding of the program. Some people:
- do not realize that they do not need to make personal contributions or, if they want to, do not have to make large contributions
- are not aware:
- of the flexibility of the program
- that they can use the money for a variety of school expenses
- that it does not necessarily have to be used right after high school
- need to get the information multiple times before understanding it
During the focus groups, only a few participants were able to discern between the CESG and the CLB:
- some focus group participants often asked the discussion moderator to explain the differences between the CESG and the CLB
- even after explaining the differences between the 2 incentives, only some participants were able to provide detail about which incentive they were referring to
- as a result, some comments from focus group participants on the challenges in requesting the CESG or the CLB were not specific
Language
Stakeholder organizations indicated that the complexity of the language used created further barriers to opening an RESP. This is particularly true for recent immigrants for whom English or French is not their first language.
Recent immigrants may need to hire the services of an interpreter to assist them in the process.
The complex language used in the CLB information materials was identified as a barrier by at least 1 parent/caregiver during the focus groups:
- some participants pointed out that the level of language in the information materials can be "off-putting" for people lacking high levels of financial literacy
Some internal stakeholders mentioned that the following barriers prevent participation:
- some promoters do not offer the CLB. For example, TD affiliates such as TD Securities Inc. and TD Asset Management Inc. offer the CESG but not the CLB
- changes in income can affect eligibility. Some parents who were not eligible for the CLB at one point in time were, due to reductions in income, eligible at another time
- human errors made by banks or private providers when applying for the RESP:
- when the financial institution opens the plan there are boxes to check, one of which is “I want to request additional grant.” Another is “yes I want to request the bond.” The agents in charge may omit to check the CLB box for eligible subscriber by mistake. It should be noted that in 2013 the forms were changed so that unless specified, by default, the subscriber will apply for the CLB
- although it is possible to open an RESP account for a child without being the primary caregiver, only the primary caregiver (or their cohabitating spouse or common-law partner) can request the CLB
- some RESP account holders eligible for the CLB do not benefit because the account was opened by someone other than the primary caregiver, who did not provide the primary caregiver’s information Footnote 33
Outreach and improving access
The CESP has collaborated with other government agencies to improve outreach and overcome barriers faced by potential beneficiaries.
In order to increase outreach the CESP team developed an outreach and partnership strategy in 2016 to promote awareness and understanding of the benefits of early savings to low-income families who are less aware of education savings incentives. They work to:
- increase program presence through partnerships and participation in community events, conferences and presentations to stakeholders
- further develop tools and resources such as brochures, pamphlets, posters, and social media to support Canadians and stakeholders
- train CRA and Service Canada officials through their program trainers
- increase mailing activities through sheer numbers and different types of mailings tailored to the targeted group. The program team cooperates with community partners to advertise sign-up events and CRA tax clinics
- include inserts in the CRA Canada Child Benefit notice of assessment (in the past 2 years). For instance, in 2019, 2 million inserts accompanied CCB notices of assessment. Inserts also accompanied SIN forms and birth registration packages in all provinces and territories
- partner with ESDC’s Innovation Lab (in 2018) to review these letters and outreach activities to help improve and adapt them as needed for best effectiveness
- review processes and adapt to increase participation of eligible children. For example, since 2018 the program permits either the mother or father to identify as the primary parent regardless of who receives or is eligible for the CCB
- the program is presently reviewing and processing all rejected requests. Program staff work with promoters/financial institutions so that eligible children who are not receiving the CLB start benefiting
Material from ESDC influenced approximately 37% of focus group participants to participate in the program.
The majority of focus group participants did not clearly remember how and when they first heard about either the CESG or the CLB.
- According to the administrative database, ESDC sent a letter to 14 of the focus group participants
- Out of these 14 participants, only 5 remembered receiving the ESDC letter, and
- A few participants said they brought the ESDC letter to their financial institution as a starting point of the conversation with their financial advisor
Key informant interview respondents and focus group participants agreed that the outreach activities effectively promote post-secondary education.
All those interviewed agreed that there is an increase in motivation, attitudes and aspirations towards post-secondary education for their children when they hear about the CLB, even if they may not be able to afford making personal contributions.
Some interviewees indicated that super clinics are an important factor that help influence decisions and overcome barriers.
- These clinics are one-stop shops where families can:
- apply for the birth certificate
- request the SIN
- get information about the program
- discuss the details, and
- take an appointment with a representative of a financial institution, if one is present
- Some of these clinics operate in remote areas, making the services more easily accessible to eligible families
A majority of stakeholders suggested measures to reduce administrative burden.
Some key informant interview and focus group respondents indicated several ways of lowering the administrative burden of applying for the CLB:
- to open an RESP and apply for the CLB on behalf of eligible children
- increase availability of guidance documents
- increase accessibility by using basic, plain language in promotional material, and
- explore alternative promotion strategies for those with literacy impairment or other needs
Management response action plan
Recommendation #1
Explore options to simplify the process to access the CLB, and consider targeted strategies to increase CLB take-up among marginalized groups and populations in remote areas.
Management response
Management agrees with this recommendation.
Building on previous and current efforts, ESDC will continue to explore and assess the feasibility of simplified service delivery options for the CLB. The Department will further refine its approach to reach marginalized groups and build the required tools and partnerships to achieve this goal.
Management action plan
- Implement the second phase of the CLB Gs & Cs Pilot Project and complete an evaluation to determine the impact of different approaches and models to increase CLB take-up among various target populations and highlight lessons learned from both phases of the project.
- Completion date: April 2024
- Partner with community organizations to connect with eligible caregivers though mailings to raise awareness of the CLB and offer direct support in gaining access to the CLB through events and online resources
- Completion date: January 2022
- Develop a package of tools and supports for partners to facilitate supported enrolment for marginalized groups and populations in remote areas
- Completion date: April 2023
- Explore innovative approaches, such as behavioural economics, targeted letters, online options and supported enrolment, to facilitate effective promotion and outreach
- Completion date: ongoing
Overall management response
Management would like to thank the individuals who contributed to this project, particularly the members of the Evaluation Project Team, as well as all focus group and interview participants who provided their insights as part of this evaluation.
ESDC’s education savings incentives, the CESG and the CLB, play an essential role within the continuum of federal supports for PSE. While the Canada Student Financial Assistance Program helps to make education more affordable by offering loans and grants to students when they are transitioning to PSE, the CESP provides education savings incentives that encourage early planning and saving for PSE. Education savings can also have a positive impact on children’s outcomes and aspirations for PSE. Ultimately, education savings can help reduce inequalities in PSE participation, lessen reliance on loans and decrease student debt.
The CLB is money that the Government adds to a RESP for children from low-income families. In 2020, the total number of children eligible for, but not receiving the CLB, was 2.2 million. Although CLB take-up has steadily increased each year since 2005, at the end of 2020, the overall percentage of children who had ever received the CLB represented 41.9% of eligible children. This evaluation report confirms the existence of access challenges, in particular among marginalized groups and populations in remote areas, and reiterates the need for greater awareness and easier access to the CLB.
Since 2015, the CESP has undertaken outreach initiatives to increase awareness and take-up of the CLB. These include:
- increasing the breadth and scope of the CLB Champions’ Network to include over 300 organizations who actively promote the CLB
- undertaking mailings (approximately three million letters) to the primary caregivers of CLB-eligible children to inform them of their child’s eligibility for the CLB and the amount that they are eligible for, and
- planning, organizing and supporting communications and outreach events, such as the annual Education Savings Week, ad hoc information sessions and regional engagement. By working with a variety of CESP partners and stakeholders, we have provided marginalized groups and those in remote areas with tailored outreach services and supports
As well, to help more low-income families benefit from the CLB, ESDC is investing $12 million over six years in the CLB Grants and Contributions (Gs & Cs) Pilot Project to fund community projects testing new and innovative ways to increase CLB awareness and reduce barriers to access. The first phase of projects is now complete, and we anticipate the completion of the second phase of projects for the fall of 2023. These projects target groups facing greater access challenges, including Indigenous Peoples, recent immigrants, rural and remote communities, and children in care.
The CESP has also implemented initiatives to make it easier for eligible clients to apply online for the CLB. This includes a strategic collaboration with the Province of Ontario to integrate an Education Savings Referral Service within ServiceOntario’s online Newborn Registration System to be referred to an RESP promoter, begin the process of opening an RESP, and access the education savings incentives.
Finally, the CESP has collaborated with various partners, such as the Privy Council Office’s Impact and Innovation Unit and ESDC’s Innovation Lab, to apply behavioural science to the CLB access challenges to help inform the development of mailing trials and simplified service delivery options.
Annexes
Annex A: Evaluation questions Footnote 34
- What barriers or factors beyond awareness and understanding of education savings incentives (including structural, cultural and institutional barriers) prevent parents or caregivers from opening a Registered Education Savings Plan and from requesting the Canada Learning Bond on behalf of eligible children?
- What segments of the population of Canadian children are underrepresented or overrepresented among beneficiaries of the Canada Education Savings Grant and of the Canada Learning Bond (taking eligibility criteria into consideration)?
- Are recipients of the Canada Learning Bond and/or of the Canada Education Savings Grant more likely to be male or female children, when compared to the population of potential beneficiaries?
- To what extent have the outreach and communication activities undertaken by the Department increased awareness and understanding of Registered Education Savings Plans and related federal education savings incentives among the target population?
- What other tools, programs or mechanisms have been implemented in Canada (at the provincial or territorial level) or in other countries or jurisdictions (for instance, in Organization for Economic Cooperation and Development countries) to make post-secondary education accessible to children from low-income families?
- How do parents or caregivers of Canada Learning Bond beneficiaries become aware of this education savings incentive?
1.1 Are these barriers or factors more likely to affect parents or caregivers who are more at risk of social stigmatization (including single mothers, same-sex parents, Indigenous peoples and members of a visible minority group), and how?
Annex B: Revised logic model – CESP Footnote 35
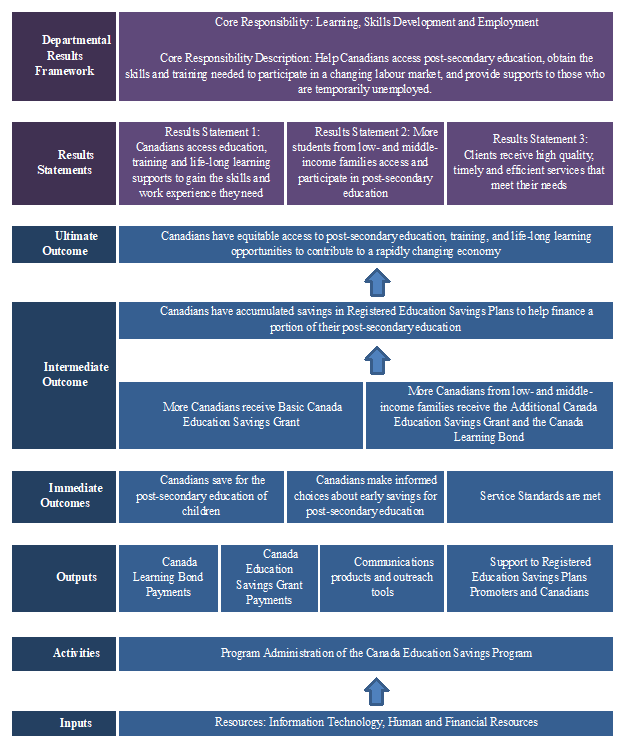
Annex B – Text version
Departmental Results Framework
Core Responsibility: Learning, Skills Development and Employment
Core Responsibility Description:
- help Canadians access post-secondary education
- obtain the skills and training needed to participate in a changing labour market, and
- provide supports to those who are temporarily unemployed
Results Statements
- Results Statement 1: Canadians access education, training and life-long learning supports to gain the skills and work experience they need
- Results Statement 2: More students from low- and middle-income families access and participate in post-secondary education
- Results Statement 3: Clients receive high quality, timely and efficient services that meet their needs
Ultimate outcome
Canadians have equitable access to post-secondary education, training, and life-long learning opportunities to contribute to a rapidly changing economy.
Intermediate outcomes
- Canadians have accumulated savings in Registered Education Savings Plans to help finance a portion of their post-secondary education
- More Canadians receive Basic Canada Education Savings Grant
- More Canadians from low- and middle-income families receive the Additional Canada Education Savings Grant and the Canada Learning Bond
Immediate outcomes
- Canadians save for the post-secondary education of children
- Canadians make informed choices about early savings for post-secondary education
- Service standards are met
Outputs
- Canada Learning Bond Payments
- Canada Education Savings Grant Payments
- Communications products and outreach tools
- Support to Registered Education Savings Plans Promoters and Canadians
Activities
Program Administration of the Canada Education Savings Program
Inputs
Resources: Information Technology, Human and Financial Resources
Annex C: International findings
Other countries or jurisdictions have implemented programs similar to the CESP and the CLB to make post-secondary education accessible to children from low-income families.
The literature review as part of this evaluation identified 3 models for programs aimed at increasing participation in post-secondary education among students from families with low income. The 3 models included:
- non-repayable grants
- child development accounts (for example: CESP)
- merit-based aid
The literature review examined programs for Australia, France, the United States of America, Oklahoma, Maine, and Georgia. All have programs that operate differently from the CESP. In addition, all of these jurisdictions have educational systems that share similarities with that of Canada.
Particular attention has been given to publications that:
- highlight the advantages and disadvantages associated with the implementation of different tools, programs or mechanisms designed to help students with lower socioeconomic backgrounds to finance their post-secondary education
- address issues related to equality of access or equality of opportunity (for example, while integrating variables such as the probability of individuals born in low-income families to obtain post-secondary credentials, and eventually climb the income ladder)
- do not use a comparative approach but discuss the impacts of specific interventions
Since they are typically interventions in early childhood, it takes time to see the impacts of child development accounts and similar savings-based programs on PSE access and completion. However, there is evidence from some jurisdictions that such programs have a positive impact on PSE participation. Footnote 36
While PSE outcomes are not known yet for the beneficiaries of all child development account programs, a number of studies have identified positive impacts on children’s grades, high school completion, and children’s aspirations for PSE. Footnote 37
Other countries or jurisdictions have implemented programs similar to the CESP and the CLB to make post-secondary education accessible to children from low-income families.
The evaluation examined 3 models of programs increasing low-income families’ participation in post-secondary education: Footnote 38
1) non-repayable grants
- Australia: The Youth Allowance for Students and Australian Apprentices
- France: Bourses sur Critères Sociaux
2) child development accounts
- United States of America:
- the 529 Plan
- the School Experiences and Early Development (SEED) for Oklahoma Kids program
3) merit-based aid
- United States of America: Georgia Helping Outstanding Pupils Educationally (HOPE) Scholarship
Among these examples, non-repayable grants in Australia and France were identified as initiatives impacting accessibility to post-secondary education for low-income families.
Non-repayable grants having a positive impact on accessibility to post-secondary education for children from low-income families. Footnote 39
1) The Youth Allowance for Students and Australian Apprentices (Australia)
- A means and assets-tested bi-monthly payment to full-time students and full-time apprentices aged 18 to 24, or those looking for work aged 18 to 21
- The level of grant depends on an applicant’s level of income and available assets, along with their parents’, unless they are independent
Impact on post-secondary education:
- students from families with low incomes who receive the Youth Allowance attend university at approximately the same rate as students from families with higher incomes
- receipt of the Youth Allowance is also positively associated with completion of university and full-time vocational programs
2) Bourses sur Critères Sociaux (France)
- A needs-assessed grant for post-secondary students from families with low incomes
- The grant has 7 levels. The lowest provides no cash benefits, but exemptions from tuition fees and social security contributions. The highest provides fee exemptions and €4,200 per year in cash benefits
- To be eligible, an applicant must:
- have applied to a full-time degree program at a French post-secondary institution
- be under 29 years of age at the time of application
- be a secondary school graduate
Impact on post-secondary education:
- enrollment rates are higher for those who are eligible for the first level of cash grant compared to those who are eligible only for the waiving of fees or who are not eligible at all. Enrollment rates increase at a lower increment for each additional level of grant
Annex D: Previous key evaluation findings Footnote 40
The 2015 (summative) evaluation examined the extent to which the CESP was achieving its objective.
- The CESG and the CLB have encouraged Canadians to amass a substantial amount of savings in RESPs, rising to $40.5 billion as of 2013 (increased from $2.4 billion in 1997). In 2013, $883 million in grants were disbursed via the CESP. The number of low-income families with RESPs continues to increase, reaching 400,000 families in 2012
- The proportion of children under 18 years of age who received the CESG at least once in their life increased from 9.7% in 1998 to 47.1% in 2013. More specifically, of the roughly 6.9 million children under the age of 18 in Canada in 2013, over 3.2 million had received the basic CESG
- Administrative data analysis also showed that children from families with income of $125,000 or more received 31.9% of all CESP payments made in 2012, even though they accounted for only 17.1% of children under 18
- The take-up of RESP has quadrupled for low-income families between 1999 and 2012. This four-fold increase may have been caused more by the Basic CESG, as the rate of increase did not change noticeably with the introduction of the Additional CESG. However, the evaluation showed that the CLB contributed to a significant increase in RESP take-up among low-income families
The 2015 summative evaluation offered 2 main recommendations:
- explore ways for funds to more effectively reach families with the greatest need for assistance and encouragement to save for their children’s future PSE
- continue to undertake outreach efforts on promoting both awareness and understanding of the CESP savings incentives to support increased participation among Canadian families
Annex E: Methodology
The evaluation used several methods to collect and analyze information from the 4 lines of evidence selected to answer the evaluation questions. Although arrangements are made to ensure better quality of data and results (triangulation), some challenges and limitations were noted.
Lines of evidence
Document and literature review
The document and literature review includes:
- a review of academic and government research related to the CESP
- a review of internal ESDC documents: reports, summaries, presentations, briefing notes, and
- a review of programs in other jurisdictions that operate differently from the CESP. These include: Australia, France, Ontario and the United States, including Oklahoma, Maine and Georgia
Key limitations
- The CESP is unique. However, the literature reviewed provided relevant information regarding other education savings programs
Administrative data review and analysis
Administrative data from the CESP were linked to tax data from the Canada Revenue Agency.
The evaluation assessed the overall quality and integrity of the program's administrative data.
Key limitations
- Statistics Canada performed a data linkage twice during this evaluation that was considered of unsatisfactory quality by the program, delaying the availability of data. For this reason, much of the analysis has been moved to the impact evaluation to be published in 2023
Focus groups
The objective of the focus groups is to gather qualitative data based primarily on participants’ experiences and perceptions of the CESG and CLB.
Seven focus groups were established for a total of 35 participants:
- 6 focus groups with parents and primary caregivers (28 participants), and
- 1 focus group composed of stakeholder organizations (7 participants)
The sampling was structured to differentiate between eligible children whose parents or primary caregivers requested the CLB and those who did not.
The sampling was designed to be representative of the different socio-economic characteristics within each focus group: gender, ethno-cultural profile, region, family status and number of children.
Scale used to report the findings for focus groups:
- “all/almost all” – findings reflect the views and opinions of 90% or more of the key informants in the group
- “large majority/most” – findings reflect the views and opinions of at least 75% but less than 90% of key informants in the group
- “majority” - findings reflect the views and opinions of at least 51% but less than 75% of key informants in the group
- “half” – findings reflect the views and opinions of 50% of the respondents in the group
- “some” - findings reflect the views and opinions of at least 25% but less than 50% of key informants in the group
- “a few” - findings reflect the views and opinions of at least 2 respondents but less than 25% of key informants in the group
- “one” – findings of 1 highly knowledgeable key informant
Key limitations
Only those with listed landlines and who continued to live at the same address as in the database could be contacted. This may have introduced some bias in the sample.
The presence of self-selection bias in the sampling was considered. Self-selection bias refers to the fact that some people are more or less likely to agree to participate in a certain focus group.
The method used for the records that supported sampling did not include a variable that could differentiate men from women. Since men are less likely to participate in focus groups, it was all the more difficult to ensure gender parity in each focus group.
While the sample was representative of gender, cultural profile, region, family status and number of children, it was not always possible to get the same representation throughout all focus groups due to limited recruitment for 2 focus groups during the Covid-19 lockdowns.
The academic community did not participate in the stakeholder organization focus group. Evaluators originally intended to include stakeholders from a variety of backgrounds, but efforts to recruit representatives from the university community were not successful.
As finances can be a sensitive subject, there may have been some degree of discomfort in discussing these topics for some participants, especially in cases when financial literacy varied among participants.
Throughout the focus groups, parents or primary caregivers were often unable to differentiate between education savings incentives and RESPs. As a result, feedback specifically related to the CESG or CLB was limited. It should be noted however, that the sampling included only those that registered for the CLB.
| Focus group | Facilitation mode Footnote 42 | Location | Number of participants |
| Parents/caregivers of eligible children | Teleconference | Victoria (British Columbia | 7 |
| Parents/caregivers of eligible children | Teleconference | Edmonton (the Prairies) | 5 |
| Parents/caregivers of eligible children | Teleconference | Toronto (Ontario) | 4 |
| Parents/caregivers of eligible children | In person | Montreal (Quebec) | 5 |
| Parents/caregivers of eligible children | In person | Halifax (Atlantic Provinces) | 5 |
| Parents/caregivers of eligible children | Teleconference | Across Canada, including Northern Canada | 2 |
| Stakeholder organizations | Teleconference | Across Canada | 7 |
Key informant interviews
Key informant interviews were conducted to answer each evaluation question and a number of sub-questions designed to incorporate Gender-Based Analysis (GBA+) into the evaluation.
Evaluators interviewed a total of 24 key informants:
- 12 internal stakeholders including 3 ESDC Apprenticeship Branch program staff working in the National Capital Region, and
- 12 external stakeholders, including 9 community organization representatives, 2 RESP promoters/trustees and 1 advocacy organization representative
Key limitations
- Due to the Coronavirus pandemic key informant interviews were conducted remotely over the phone
- The selection bias inherent to any optional response exists as respondents were aware of their participation and chose to participate
References
Brown, M (2018). “The cost of a Canadian university education in six charts,” Maclean’s, https://www.macleans.ca/education/the-cost-of-a-canadian-university-education-in-six-charts.
Clancy, M., Beverly, S., Sherraden, M., & Huang, J. (2016). “Testing Universal Child Development Accounts: Financial Effects in a Large Social Experiment,” Social Service Review.
ESDC (2020). 2020 Key Informant Interviews Report.
ESDC (2020). 2020 Stakeholders Focus Groups Report.
ESDC (2019). CESP 2019 Annual Statistical Review . https://www.canada.ca/content/dam/canada/employment-social-development/services/student-financial-aid/education-savings/reports/2019-annual-statistical-review-EN.pdf
ESDC (2019). High-Level Analysis of the 2016 Survey of Financial Security. Presented by the Canada Education Savings Program (CESP), Employment and Social Development Canada.
ESDC (2018). Backgrounder: Old Age Security (OAS) automatic enrolment. https://www.canada.ca/en/employment-social-development/news/2018/01/backgrounder_oldagesecurityoasautomaticenrolment.html
ESDC (2017). 2017 Memorandum of Understanding (MOU) between the Canada Revenue Agency (CRA) and ESDC regarding the Administration of the Registered Education Savings Plans and the CESP.
ESDC (2017). 2018 Memorandum of Understanding Concerning the Disclosure of Various Administrative Data Files from ESDC to Statistics Canada (signed in May 2017), and Amendment to Appendix B .
Fack, G. and Grenet, J. ( 2015). “Improving College Access and Success for Low-Income Students: Evidence from a Large Need-Based Grant Program,” American Economic Journal, April.
Ford, R. and Kwakye, I. (2016). Future to Discover: Sixth Year Post-secondary Impacts Report. Ottawa: Social Research and Demonstration Corporation.
Frenette, Marc (2017). “Which Families Invest in Registered Education Savings Plans and Does It Matter for Post-secondary Enrolment?” Analytical Studies Branch Research Paper Series, Social Analysis and Modelling Division, Statistics Canada. April 12.
Gale, T. and Parker, S. (2013) “Widening Participation in Australian Higher Education,” Australian Universities' Review, vol. 59 no. 1, pp. 37-46.
Government of Canada, Open Government Data Portal. https://search.open.canada.ca/en/od/?od-search-portal=Open%20Data&search_text=CESP
Government of Canada, Open Government Data Portal. https://open.canada.ca/data/en/dataset/0840231b-5bbf-447f-81ce-3ec0673aefc4
Government of Canada, Statistics Canada. Table: 37-10-0003-01 (formerly CANSIM 477-0021)Canadian Tuition Fees by Field of Study (Annual). https://www150.statcan.gc.ca/t1/tbl1/en/tv.action?pid=3710000301&pickMembers%5B0%5D=1.1&cubeTimeFrame.startYear=2010+%2F+2011&cubeTimeFrame.endYear=2020+%2F+2021&referencePeriods=20100101%2C20200101
Hardy, E. et al. (2018). Increasing Take-up of the Canada Learning Bond. Increasing Take-Up of the Canada Learning Bond – August 2018 - Canada.ca
Hetherington, K. and Hurley, T. (2016). “529 Plans: Federal Tax Benefits and State Tax Distinctions,” Journal of Taxation Investments.
Lightman, Ernie, et al. (2009). “Post-secondary education and social assistance in Ontario.” Canadian Social Work Review / Revue canadienne de service social, vol. 26, no. 1, pp. 97–113. www.jstor.org/stable/41669904.
Nam, Y. et al (2015). “Financial Capability and Asset Accumulation for Children’s Education: Evidence from an Experiment of Child Development Accounts,” Journal of Consumer Affairs, Spring.
Nam, Y. et al (2013). “Do Child Development Accounts Promote Holding, Saving, and Asset Accumulation for Children’s Future? Evidence from a Statewide Randomized Experiment,” Journal of Policy Analysis and Management.
Office of the Auditor General of Ontario (2018). 2018 Annual Report. https://www.auditor.on.ca/en/content/annualreports/arbyyear/ar2018.html#volume1
Robson, K. et al. (2018). “Underrepresented Students and the Transition to Postsecondary Education: Comparing Two Toronto Cohorts.“ Canadian Journal of Higher Education 48(1):39-59.
Ryan, C. (2013). Student Income Support and Education and Training Participation in Australia.
Ryan, C. (2014). Youth Allowance and the Financial Position of Young Australians.
Sjoquist, D. and Winters, J. (2015). “State Merit-Based Aid Programs and College Attainment,” Journal of Regional Science. Vol 55 Issue 3 Pages 364-390.
United States Government Accountability Office (2012). Higher Education: A Small Percentage of Families Save in 529 Plans.
Glossary
Additional CESG
Additional Amount of the Canada Education Savings Grant for low- (20%) and middle- (10%) income individuals
Beneficiary
An individual receiving payments from an RESP
Contributor
An individual depositing funds into an RESP
Program
Canada Education Savings Program
Subscriber
An individual opening an RESP