
Archived - The Fiscal Monitor - March 2022

Highlights
March 2022
There was a budgetary deficit of $25.7 billion in March 2022, compared to a deficit of $31.4 billion in March 2021. The budgetary deficit before net actuarial losses was $24.9 billion, compared to a deficit of $30.2 billion in the same period of 2020-21. The budgetary balance before net actuarial losses is intended to supplement the traditional budgetary balance and improve the transparency of the government’s financial reporting by isolating the impact of the amortization of net actuarial losses arising from the revaluation of the government’s pension and other employee future benefit plans.
As expected, the government’s 2021–22 financial results show a marked improvement compared to the peak of the COVID-19 crisis reached in 2020–21, and the unprecedented level of temporary COVID-19 response measures at the time.
Monthly Budgetary Balance and Budgetary Balance Excluding Net Actuarial Losses
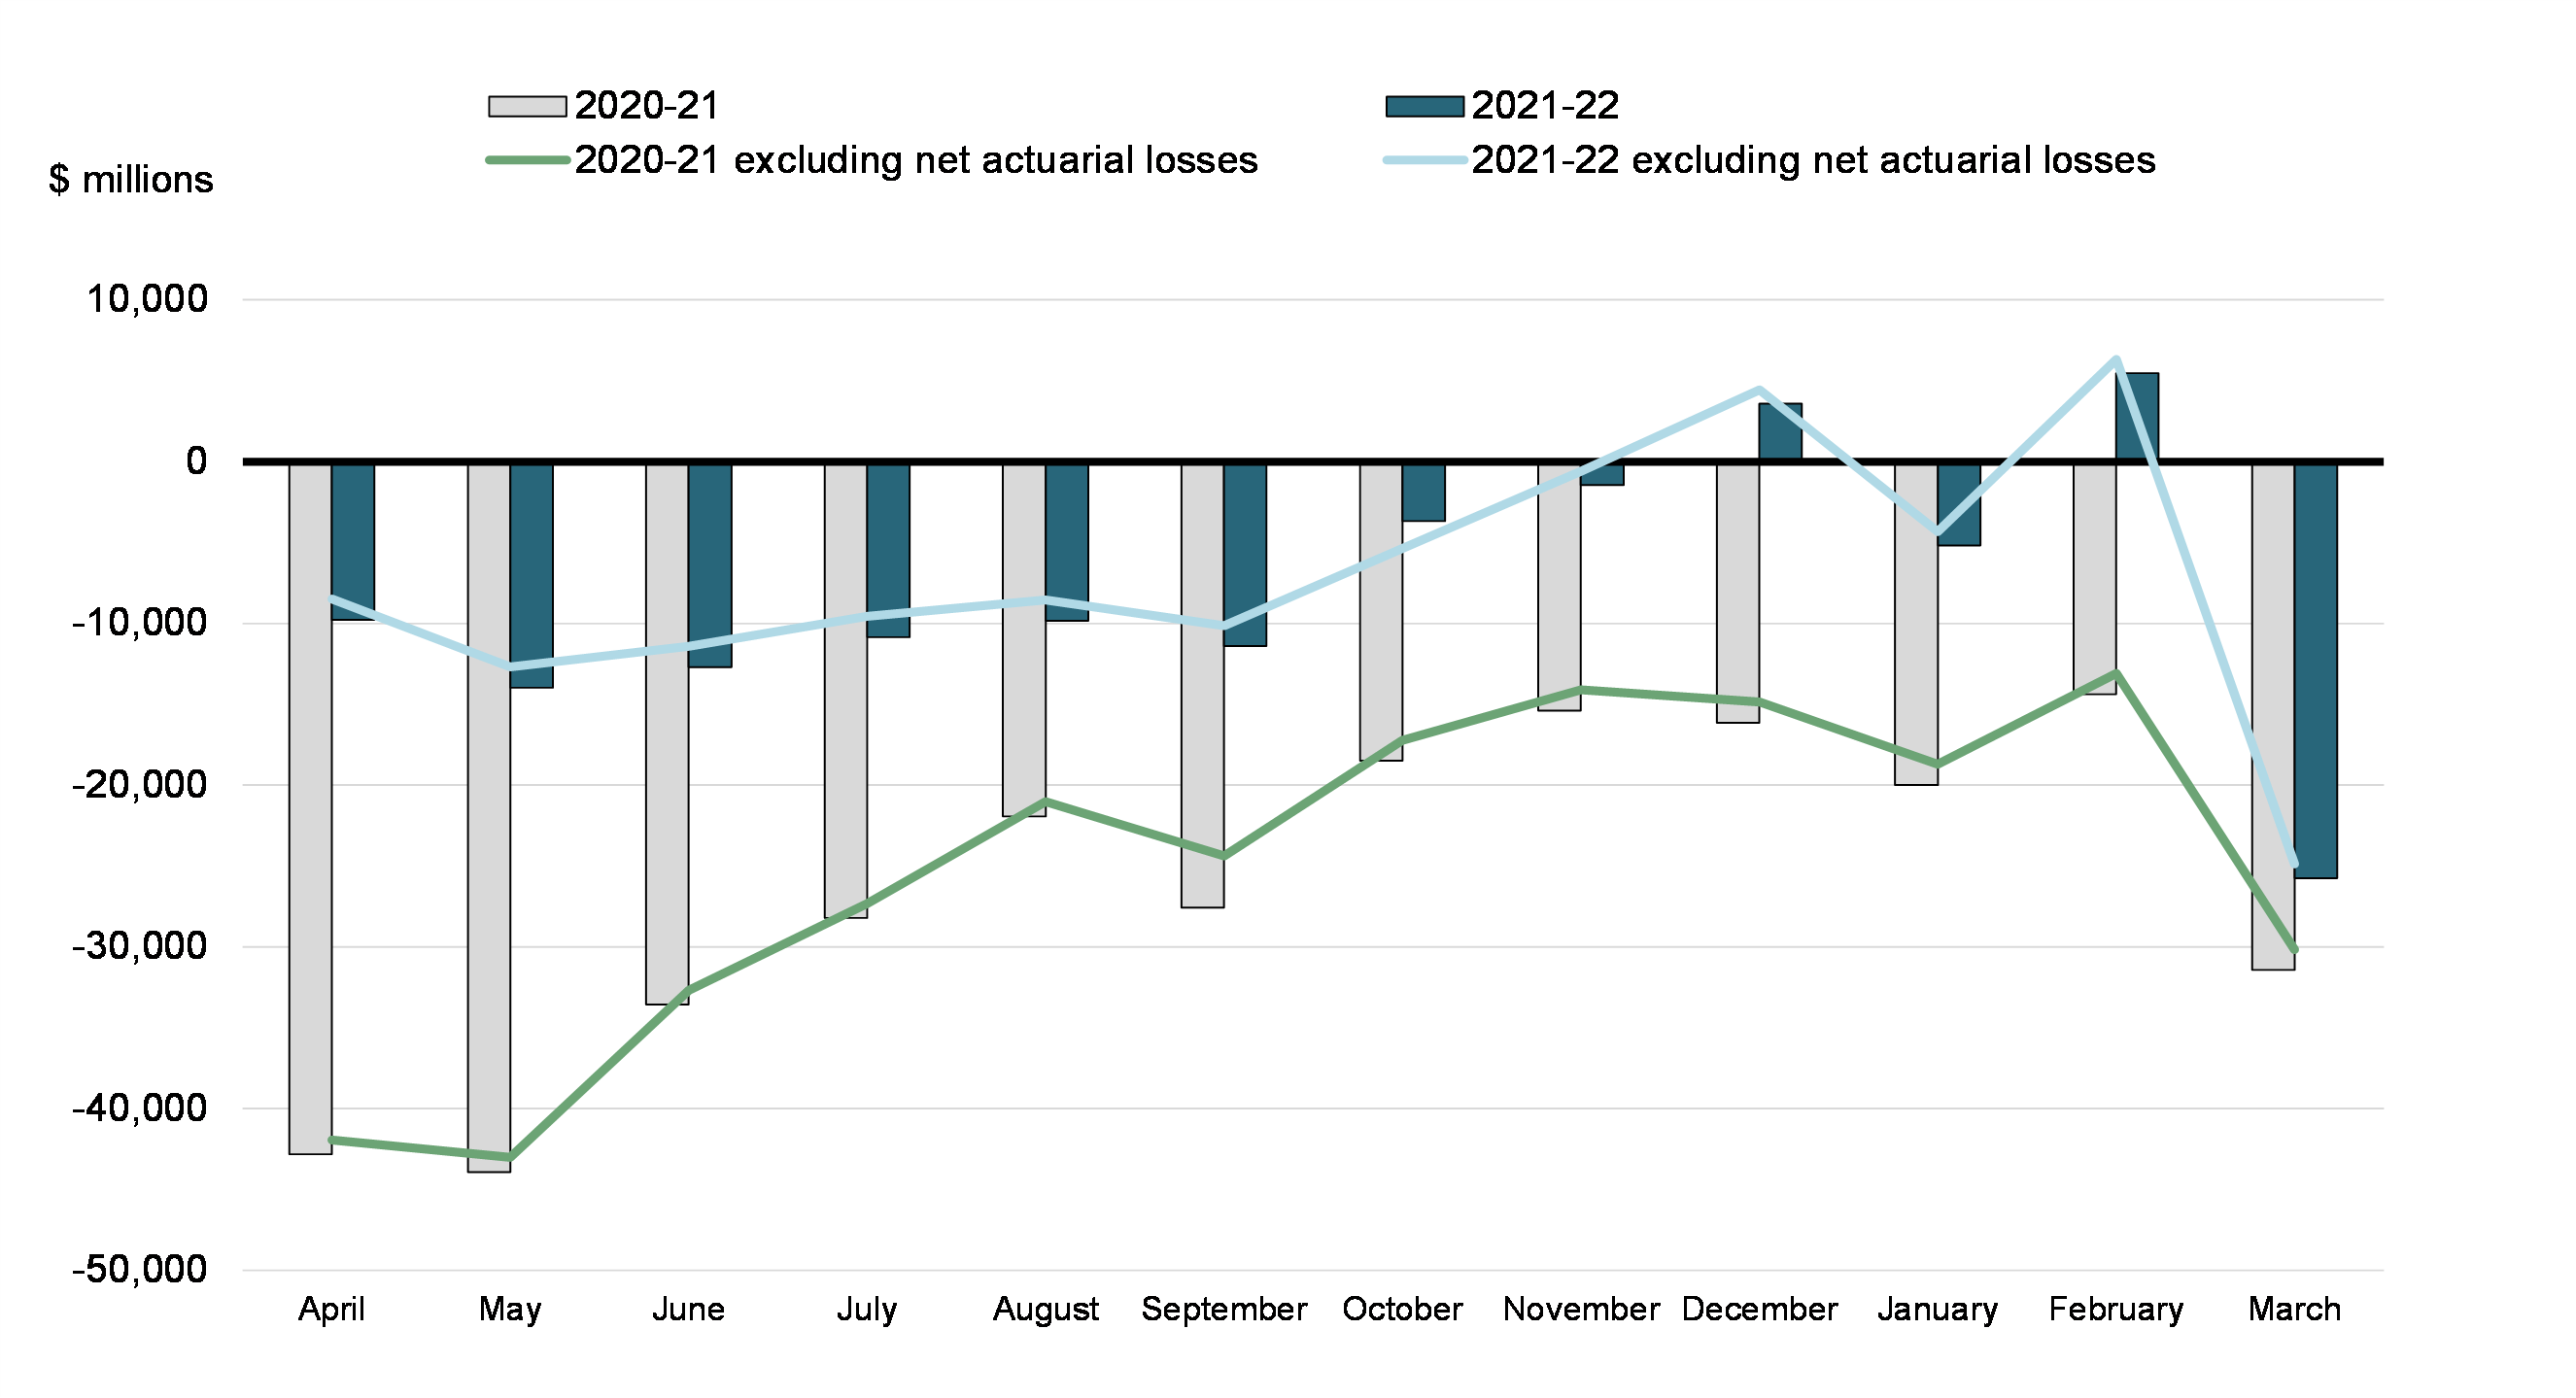
Compared to March 2021:
- Revenues increased by $4.9 billion, or 14.2 per cent, on a year-over-year basis, largely reflecting an increase in tax revenues and other revenues.
- Program expenses excluding net actuarial losses were down $0.9 billion, or 1.4 per cent, reflecting decreased transfers under the COVID-19 Economic Response Plan, including the Canada Emergency Wage Subsidy (CEWS) and Canada Recovery Benefits, offset in part by estimated costs recorded for disaster assistance and environmental liabilities.
- Public debt charges were up $0.5 billion, or 26.5 per cent, reflecting higher Consumer Price Index adjustments on Real Return Bonds, higher interest on the government's pension and other employee future benefit obligations, and higher interest on marketable bonds.
- Net actuarial losses were down $0.4 billion, or 33.0 per cent, reflecting the amortization of a decrease in the government’s obligations for pensions and other employee future benefits based on actuarial valuations prepared for the Public Accounts of Canada 2021. This decrease is due to a year-over-year increase in year-end interest rates used in valuing these obligations.
April 2021 to March 2022
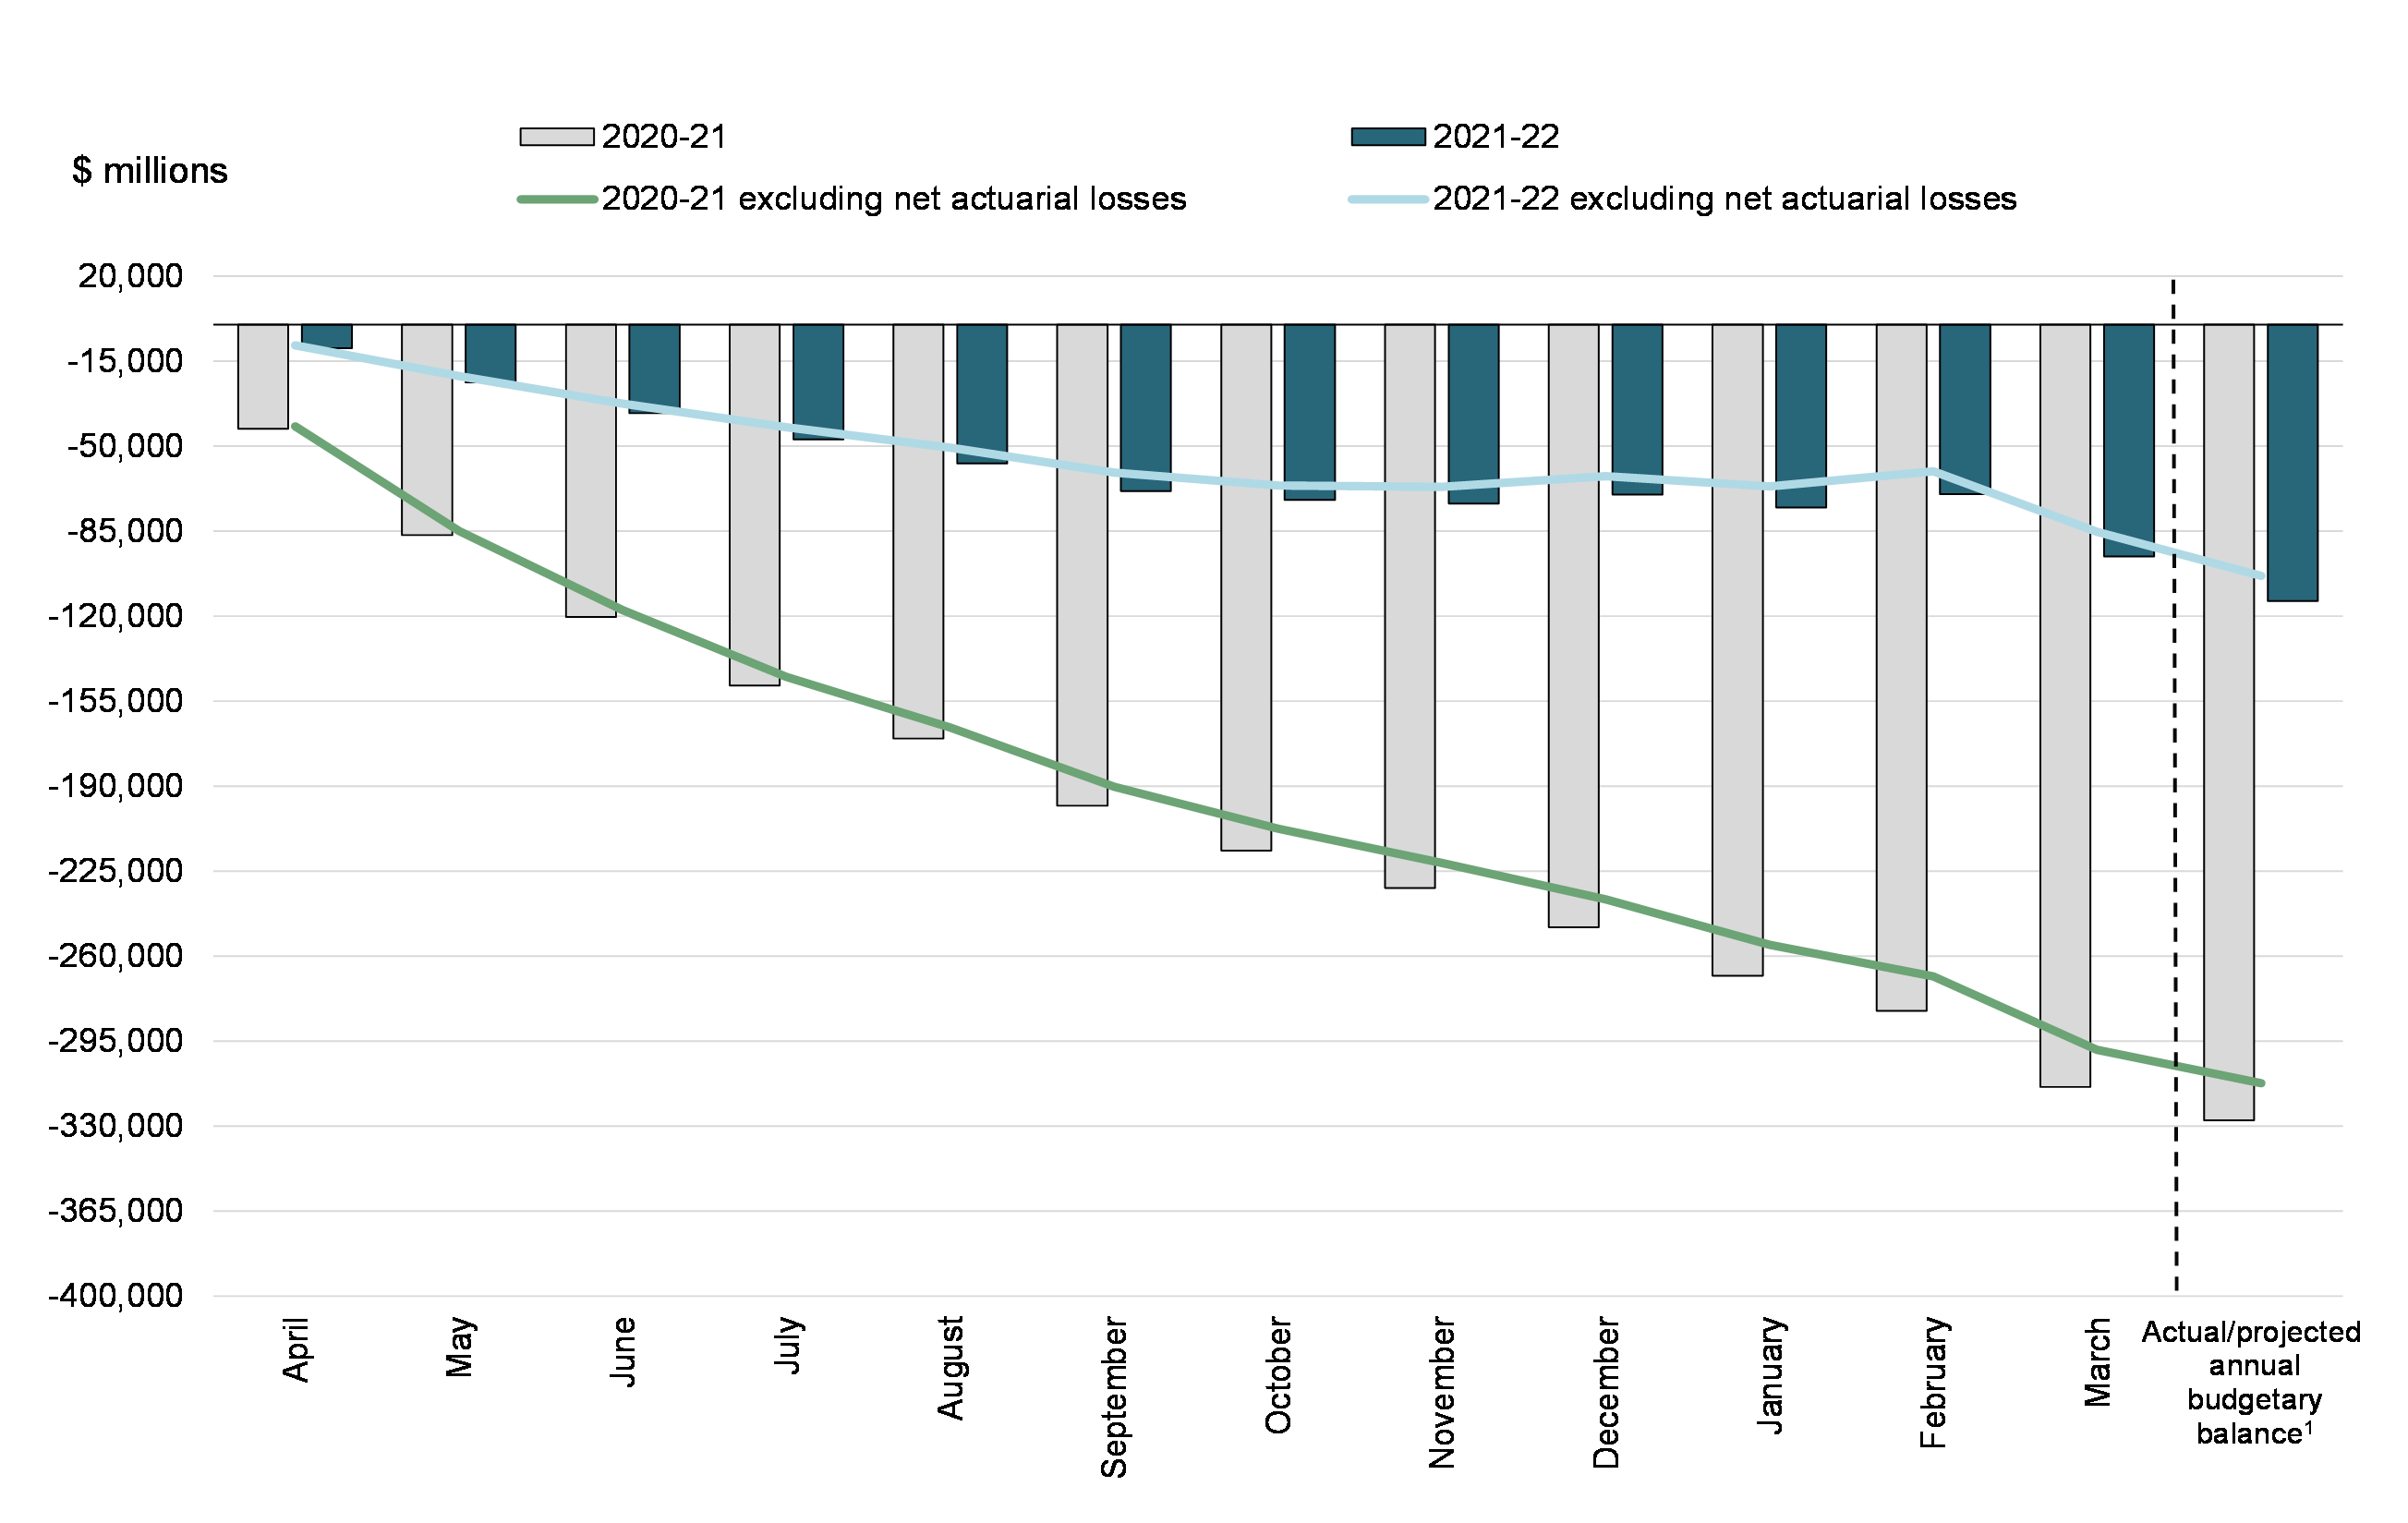
The government posted a budgetary deficit of $95.6 billion for the April to March period of the 2021-22 fiscal year, compared to a deficit of $314.0 billion reported for the same period of 2020-21. The budgetary deficit before net actuarial losses was $85.2 billion, compared to a deficit of $298.6 billion in the April to March period of 2020-21.
Compared to 2020-21:
- Revenues were up $97.4 billion, or 32.5 per cent, primarily reflecting higher tax revenues and other revenues.
- Program expenses excluding net actuarial losses were down $120.3 billion, or 20.8 per cent, largely reflecting lower transfers to businesses, individuals, and other levels of government under the Economic Response Plan.
- Public debt charges increased by $4.3 billion, or 20.9 per cent, primarily driven by higher Consumer Price Index adjustments on Real Return Bonds, higher interest on the government's pension and other employee future benefit obligations, and higher interest on marketable bonds.
- Net actuarial losses decreased by $5.1 billion, or 33.0 per cent, reflecting a decrease in the measurement of the government's obligations for pensions and other employee future benefits based on the government’s latest actuarial valuations. This decrease reflects higher prevailing interest rates at the end of 2020–21 used in valuing these obligations.
Year-to-Date Budgetary Balance and Budgetary Balance Excluding Net Actuarial Losses
| March | April to March | |||
|---|---|---|---|---|
| 2021 | 2022 | 2020-21 | 2021-22 | |
| Budgetary transactions | ||||
Revenues |
34,517 | 39,403 | 299,466 | 396,821 |
Expenses |
||||
Program expenses, excluding net actuarial losses |
-62,738 | -61,839 | -577,576 | -457,296 |
Public debt charges |
-1,939 | -2,452 | -20,490 | -24,771 |
Budgetary balance, excluding net actuarial losses |
-30,160 | -24,888 | -298,600 | -85,246 |
Net actuarial losses |
-1,283 | -860 | -15,399 | -10,320 |
Budgetary balance (deficit/surplus) |
-31,443 | -25,748 | -313,999 | -95,566 |
| Non-budgetary transactions | 25,167 | 28,876 | -13,146 | 10,325 |
| Financial source/requirement | -6,276 | 3,128 | -327,145 | -85,241 |
| Net change in financing activities | -2,880 | 5,288 | 341,562 | 118,113 |
| Net change in cash balances | -9,156 | 8,416 | 14,417 | 32,872 |
| Cash balance at end of period | 59,097 | 92,261 | ||
|
Note: Positive numbers indicate net source of funds. Negative numbers indicate net requirement for funds. |
||||
Revenues
Revenues have been affected by the economic impacts of the COVID-19 crisis and by measures introduced under the government’s Economic Response Plan, including tax deferrals and the one-time Goods and Services Tax (GST) credit payment offered in 2020–21. However, due to challenges in isolating these impacts from underlying economic activity, it is not possible to provide an accurate measure of the impact of COVID-19 on federal revenues.
Revenues in March 2022 totalled $39.4 billion, up $4.9 billion, or 14.2 per cent, from March 2021.
- Tax revenues increased by $3.1 billion, or 11.3 per cent, mainly due to higher personal income tax revenue. This reflects a higher number of individuals in employment compared to the same period in 2020-21, when COVID-19 restrictions continued to weigh on labour markets.
- Employment Insurance (EI) premium revenues were up $0.5 billion, or 18.6 per cent.
- Proceeds from the pollution pricing framework were down $40 million, or 5.5 per cent.
- Other revenues, consisting of enterprise Crown corporations’ net profits, sales of goods and services, returns on investments, and net foreign exchange revenues, were up $1.4 billion, or 34.9 per cent, from March 2021. This increase largely reflects higher profits from enterprise Crown corporations, including Bank of Canada profits related to its secondary market purchases of Government of Canada securities to support liquidity in financial markets. Under public sector accounting standards, premiums paid on bond purchases by the Bank of Canada are expensed immediately. Whereas premiums more than offset interest earnings on the securities in 2020-21, premiums paid have since decreased and interest earnings have increased.
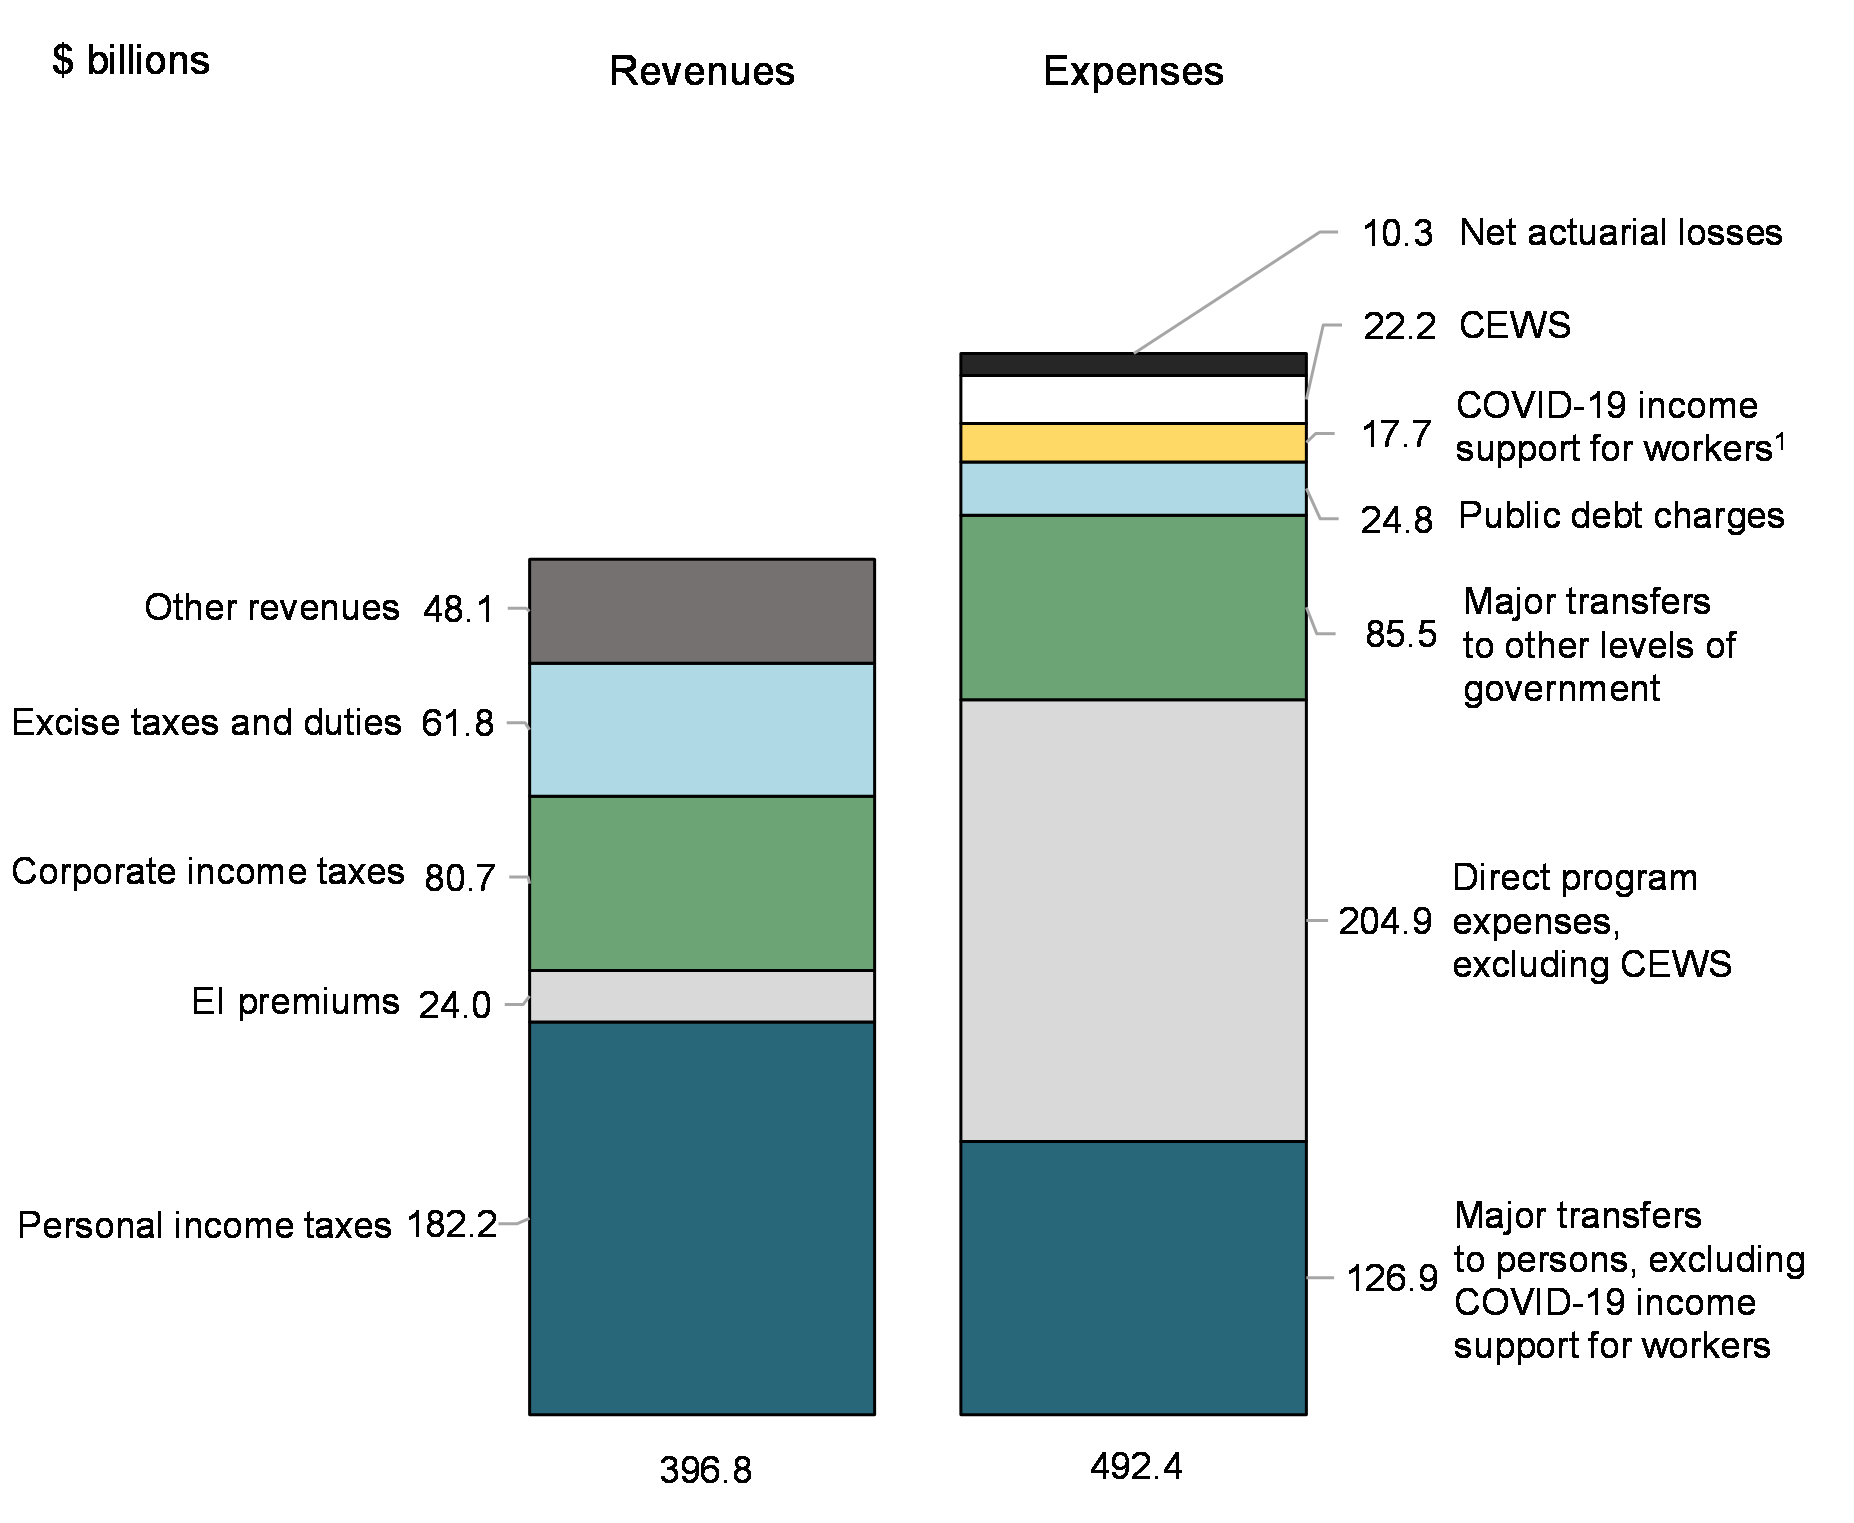
Revenues for the April to March period of 2021-22 totalled $396.8 billion, up $97.4 billion, or 32.5 per cent, from the same period in 2020-21.
- Tax revenues increased by $65.3 billion, or 24.2 per cent, compared to the same period in 2020-21, when COVID-19 resulted in the shutdown of large portions of the economy and government support measures such as the one-time enhanced GST credit payment. In particular, corporate income tax revenue showed strong improvement supported by broad-based gains across industry sectors. For its part, the federal portion of assessed cannabis excise duties increased by $50 million to $153 million over the April to March period.
- EI premium revenues were up $1.8 billion, or 7.9 per cent, reflecting better labour market conditions.
- Proceeds from the pollution pricing framework were up $1.5 billion, or 36.1 per cent, reflecting higher carbon pollution pricing and consumption in 2021.
- Other revenues were up $28.8 billion, from $3.5 billion in 2020-21 to $32.3 billion in 2021-22, largely reflecting higher Bank of Canada and other enterprise Crown corporation profits.
| March | April to March | |||||
|---|---|---|---|---|---|---|
| 2021 | 2022 | Change | 2020-21 | 2021-22 | Change | |
| ($ millions) | (%) | ($ millions) | (%) | |||
| Tax revenues | ||||||
Income taxes |
||||||
Personal |
13,655 | 16,599 | 21.6 | 164,164 | 182,180 | 11.0 |
Corporate |
8,211 | 8,412 | 2.4 | 51,415 | 80,683 | 56.9 |
Non-resident |
900 | 655 | -27.2 | 8,695 | 9,972 | 14.7 |
Total income tax revenues |
22,766 | 25,666 | 12.7 | 224,274 | 272,835 | 21.7 |
Other taxes and duties |
||||||
Goods and Services Tax |
3,221 | 3,238 | 0.5 | 30,534 | 45,465 | 48.9 |
Energy taxes |
360 | 386 | 7.2 | 4,934 | 5,301 | 7.4 |
Customs import duties |
526 | 390 | -25.9 | 4,242 | 5,211 | 22.8 |
Other excise taxes and duties |
261 | 507 | 94.3 | 5,414 | 5,837 | 7.8 |
Total excise taxes and duties |
4,368 | 4,521 | 3.5 | 45,124 | 61,814 | 37.0 |
Total tax revenues |
27,134 | 30,187 | 11.3 | 269,398 | 334,649 | 24.2 |
| Proceeds from the pollution pricing framework | 732 | 692 | -5.5 | 4,256 | 5,791 | 36.1 |
| Employment Insurance premiums | 2,759 | 3,272 | 18.6 | 22,273 | 24,038 | 7.9 |
| Other revenues | 3,892 | 5,252 | 34.9 | 3,539 | 32,343 | 813.9 |
| Total revenues | 34,517 | 39,403 | 14.2 | 299,466 | 396,821 | 32.5 |
|
Note: Totals may not add due to rounding. |
||||||
Expenses
Program expenses have been significantly affected by spending measures under the Economic Response Plan, including the Canada Emergency Response Benefit (CERB), CEWS, Canada Recovery Benefits, and the Canada Emergency Business Account (CEBA) repayment incentive. Further information regarding these measures is provided below.
Program expenses excluding net actuarial losses in March 2022 were $61.8 billion, down $0.9 billion, or 1.4 per cent, from March 2021.
- Major transfers to persons, consisting of elderly benefits, EI benefits, COVID-19 income support for workers, and children’s benefits, were down $5.0 billion or 32.6 per cent.
- Elderly benefits increased by $0.3 billion, or 6.0 per cent, reflecting changes in consumer prices to which benefits are fully indexed, and growth in the number of recipients.
- EI benefits decreased by $2.9 billion, or 53.3 per cent, reflecting improved labour market conditions.
- COVID-19 income support for workers, which includes Canada Recovery Benefits, the Canada Worker Lockdown Benefit, and CERB payments to individuals processed outside of the EI Operating Account, decreased $2.4 billion, or 86.4 per cent, largely reflecting the wind-down of the Canada Recovery Benefit.
- Children’s benefits were up $10 million, or 0.5 per cent.
- Major transfers to other levels of government were up $1.1 billion, or 14.9 per cent, largely reflecting new funding under the Canada-wide early learning and child care plan and increased home care and mental health transfers. This increase was partly offset by transfers made in the prior year under the Safe Restart Agreement and the Essential Workers Support Fund.
- Direct program expenses were up $3.0 billion, or 7.4 per cent. Within direct program expenses:
- Proceeds from the pollution pricing framework returned decreased by $1.4 billion, or 96.7 per cent, reflecting a change in the delivery of the Climate Action Incentive, from annually on personal income tax returns to a quarterly benefit.
- CEWS payments decreased by $3.5 billion, or 92.9 per cent, reflecting the wind-down of the program.
- Other transfer payments increased by $5.3 billion, or 29.1 per cent, largely reflecting provisions for the estimated federal share of recovery costs related to recent natural disasters in British Columbia.
- Operating expenses of the government’s departments, agencies, and consolidated Crown corporations and other entities increased by $2.6 billion, or 15.6 per cent, largely reflecting the revaluation of obligations for environmental liabilities and increased public health expenses.
Public debt charges increased $0.5 billion, or 26.5 per cent, largely due to higher Consumer Price Index adjustments on Real Return Bonds, higher interest on the government's pension and other employee future benefit obligations, and higher interest on marketable bonds.
Net actuarial losses, which represent the amortization of changes in the value of the government’s obligations for pensions and other employee future benefits accrued in previous fiscal years, decreased $0.4 billion, or 33.0 per cent, in large part due to an increase in prevailing interest rates at the end of 2020-21 used in valuing these obligations.
For the April to March period of 2021-22, program expenses excluding net actuarial losses were $457.3 billion, down $120.3 billion, or 20.8 per cent, from the same period the previous year.
- Major transfers to persons were down $58.9 billion or 28.9 per cent.
- Elderly benefits increased by $2.5 billion, or 4.2 per cent, reflecting growth in the number of recipients and changes in consumer prices, to which benefits are fully indexed.
- EI benefits decreased by $22.4 billion, or 36.3 per cent, reflecting improved labour market conditions. In addition, EI benefits for the same period of the previous year included $27.5 billion in CERB benefits processed through the EI Operating Account. However, there is no impact on premiums to be collected as the EI Operating Account has since been credited for CERB benefits in the Public Accounts of Canada 2021.
- COVID-19 income support for workers decreased $38.4 billion, or 68.3 per cent, reflecting the wind-down of the CERB in 2020-21 and the transition to the suite of Canada Recovery Benefits.
- Children’s benefits were down $0.5 billion, or 2.0 per cent, largely reflecting the one-time enhanced Canada Child Benefit (CCB) payment in May 2020. This decrease was offset in part by the introduction of the CCB young child supplement for 2021.
- Major transfers to other levels of government were down $13.9 billion, or 13.9 per cent, primarily reflecting transfers made to provinces and territories in the prior year under the Safe Restart Agreement, the Essential Workers Support Fund, and the Safe Return to Class Fund. These decreases were offset in part by new funding under the Canada-wide early learning and child care plan in the current year, as well as legislated growth in the Canada Health Transfer, the Canada Social Transfer, Equalization transfers and transfers to the territories.
- Direct program expenses were down $47.6 billion, or 17.3 per cent. Within direct program expenses:
- Proceeds from the pollution pricing framework returned decreased by $0.7 billion, or 16.1 per cent, largely reflecting the change in the delivery of the Climate Action Incentive, from annually on personal income tax returns to a quarterly benefit.
- CEWS payments decreased by $52.8 billion, or 70.4 per cent, reflecting declines in the number of eligible employees and the average subsidy per employee, and the wind-down of the program.
- Other transfer payments decreased by $7.6 billion, or 8.1 per cent, largely reflecting a decrease in repayment incentive costs under the CEBA program owing to lower take-up compared to 2020-21 and the end of other temporary COVID-19 response measures introduced in the previous year. This decrease was partly offset by increased provisions for disaster assistance.
- Operating expenses of the government’s departments, agencies, and consolidated Crown corporations and other entities increased by $13.6 billion, or 13.3 per cent, largely reflecting changes in provisions for contingent and environmental liabilities, increased public health expenses, and increased personnel costs.
Public debt charges increased by $4.3 billion, or 20.9 per cent, primarily driven by higher Consumer Price Index adjustments on Real Return Bonds, higher interest on the government's pension and other employee future benefit obligations, and higher interest on marketable bonds.
Net actuarial losses decreased by $5.1 billion, or 33.0 per cent, reflecting the amortization of a decrease in the government's obligations for pensions and other employee future benefits based on actuarial valuations prepared for the Public Accounts of Canada 2021. This decrease reflects higher prevailing interest rates at the end of 2020–21 used in valuing these obligations.
| March | April to March | |||||
|---|---|---|---|---|---|---|
| 2021 | 2022 | Change | 2020-21 | 2021-22 | Change | |
| ($ millions) | (%) | ($ millions) | (%) | |||
| Major transfers to persons | ||||||
Elderly benefits |
4,965 | 5,263 | 6.0 | 58,732 | 61,222 | 4.2 |
Employment Insurance benefits |
5,452 | 2,544 | -53.3 | 61,869 | 39,425 | -36.3 |
COVID-19 income support for workers1 |
2,729 | 370 | -86.4 | 56,166 | 17,787 | -68.3 |
Children’s benefits |
2,056 | 2,066 | 0.5 | 26,796 | 26,261 | -2.0 |
Total major transfers to persons |
15,202 | 10,243 | -32.6 | 203,563 | 144,695 | -28.9 |
| Major transfers to other levels ofgovernment | ||||||
Canada Health Transfer |
3,500 | 3,601 | 2.9 | 41,880 | 43,133 | 3.0 |
Canada Social Transfer |
1,252 | 1,289 | 3.0 | 15,023 | 15,474 | 3.0 |
Equalization |
1,714 | 1,787 | 4.3 | 20,573 | 20,955 | 1.9 |
Territorial Formula Financing |
284 | 298 | 4.9 | 4,180 | 4,380 | 4.8 |
Canada-wide early learning and child care |
- | 1,117 | n/a | - | 2,948 | n/a |
Canada Community-Building Fund |
- | - | n/a | 2,170 | 2,320 | 6.9 |
Home care and mental health |
1 | 908 | 90,700.0 | 1,250 | 2,500 | 100.0 |
Other fiscal arrangements2 |
634 | -511 | -180.6 | 14,321 | -6,173 | -143.1 |
Total major transfers to other levels ofgovernment |
7,385 | 8,489 | 14.9 | 99,397 | 85,537 | -13.9 |
| Direct program expenses | ||||||
Proceeds from the pollution pricing framework returned |
1,499 | 50 | -96.7 | 4,526 | 3,796 | -16.1 |
Canada Emergency Wage Subsidy |
3,749 | 266 | -92.9 | 74,988 | 22,165 | -70.4 |
Other transfer payments |
18,184 | 23,469 | 29.1 | 93,061 | 85,488 | -8.1 |
Operating expenses |
16,719 | 19,322 | 15.6 | 102,041 | 115,615 | 13.3 |
Total direct program expenses |
40,151 | 43,107 | 7.4 | 274,616 | 227,064 | -17.3 |
| Total program expenses, excluding net actuarial losses | 62,738 | 61,839 | -1.4 | 577,576 | 457,296 | -20.8 |
| Public debt charges | 1,939 | 2,452 | 26.5 | 20,490 | 24,771 | 20.9 |
| Total expenses, excluding net actuarial losses | 64,677 | 64,291 | -0.6 | 598,066 | 482,067 | -19.4 |
Net actuarial losses |
1,283 | 860 | -33.0 | 15,399 | 10,320 | -33.0 |
| Total expenses | 65,960 | 65,151 | -1.2 | 613,465 | 492,387 | -19.7 |
|
Note: Totals may not add due to rounding.
|
||||||
The following table presents total expenses by main object of expense.
| March | April to March | |||||
|---|---|---|---|---|---|---|
| 2021 | 2022 | Change | 2020-21 | 2021-22 | Change | |
| ($ millions) | (%) | ($ millions) | (%) | |||
| Transfer payments | 46,019 | 42,517 | -7.6 | 475,535 | 341,681 | -28.1 |
| Other expenses | ||||||
Personnel, excluding net actuarial losses |
7,904 | 6,740 | -14.7 | 57,848 | 60,145 | 4.0 |
Transportation and communications |
501 | 858 | 71.3 | 2,086 | 2,940 | 40.9 |
Information |
176 | 187 | 6.3 | 539 | 650 | 20.6 |
Professional and special services |
4,097 | 4,530 | 10.6 | 14,169 | 17,441 | 23.1 |
Rentals |
587 | 616 | 4.9 | 3,611 | 4,033 | 11.7 |
Repair and maintenance |
928 | 968 | 4.3 | 3,531 | 3,785 | 7.2 |
Utilities, materials and supplies |
1,846 | 2,968 | 60.8 | 8,341 | 10,732 | 28.7 |
Other subsidies and expenses |
542 | 2,388 | 340.6 | 6,741 | 11,222 | 66.5 |
Amortization of tangible capital assets |
112 | 55 | -50.9 | 5,050 | 4,549 | -9.9 |
Net loss on disposal of assets |
26 | 12 | -53.8 | 125 | 118 | -5.6 |
Total other expenses |
16,719 | 19,322 | 15.6 | 102,041 | 115,615 | 13.3 |
| Total program expenses, excluding net actuarial losses | 62,738 | 61,839 | -1.4 | 577,576 | 457,296 | -20.8 |
| Public debt charges | 1,939 | 2,452 | 26.5 | 20,490 | 24,771 | 20.9 |
| Total expenses, excluding net actuarial losses | 64,677 | 64,291 | -0.6 | 598,066 | 482,067 | -19.4 |
Net actuarial losses |
1,283 | 860 | -33.0 | 15,399 | 10,320 | -33.0 |
| Total expenses | 65,960 | 65,151 | -1.2 | 613,465 | 492,387 | -19.7 |
|
Note: Totals may not add due to rounding. |
||||||
Revenues and expenses (April 2021 to March 2022)
Financial requirement of $85.2 billion for April 2021 to March 2022
The budgetary balance is presented on an accrual basis of accounting, recording government revenues and expenses when they are earned or incurred, regardless of when the cash is received or paid. In contrast, the financial source/requirement measures the difference between cash coming in to the government and cash going out. This measure is affected not only by changes in the budgetary balance but also by the cash source/requirement resulting from the government’s investing activities through its acquisition of capital assets and its loans, financial investments and advances, as well as from other activities, including payment of accounts payable and collection of accounts receivable, foreign exchange activities, and the amortization of its tangible capital assets. The difference between the budgetary balance and financial source/requirement is recorded in non-budgetary transactions.
With a budgetary deficit of $95.6 billion and a financial source of $10.3 billion from non-budgetary transactions, there was a financial requirement of $85.2 billion for the April 2021 to March 2022 period, compared to a financial requirement of $327.1 billion for the same period of the previous year.
The decrease in the financial requirement for non-budgetary transactions is due to a number of factors, including year-over-year changes in the balances of deferred revenues, environmental liabilities, and provisions for claims and disaster assistance, which affected accounts payable, accrued liabilities and accounts receivable; and, a decrease in loans advanced under the CEBA program in 2021–22, reflected in the financial requirement associated with loans, investments and advances. These decreases were partly offset by a year-over-year increase in the balance of foreign exchange accounts.
| March | April to March | |||
|---|---|---|---|---|
| 2021 | 2022 | 2020-21 | 2021-22 | |
| Budgetary balance (deficit/surplus) | -31,443 | -25,748 | -313,999 | -95,566 |
| Non-budgetary transactions | ||||
Accounts payable, accrued liabilities and accounts receivable |
16,545 | 25,869 | -3,434 | 30,350 |
Pensions, other future benefits, and other liabilities |
1,978 | 9,767 | 16,803 | 19,982 |
Foreign exchange accounts |
4,359 | -1,916 | 12,280 | -11,409 |
Loans, investments and advances |
4,801 | -3,439 | -32,772 | -25,434 |
Non-financial assets |
-2,516 | -1,405 | -6,023 | -3,164 |
Total non-budgetary transactions |
25,167 | 28,876 | -13,146 | 10,325 |
| Financial source/requirement | -6,276 | 3,128 | -327,145 | -85,241 |
|
Note: Totals may not add due to rounding. |
||||
Net financing activities up $118.1 billion
The government financed this financial requirement of $85.2 billion and increased cash balances by $32.9 billion by increasing unmatured debt by $118.1 billion. The increase in unmatured debt was achieved primarily through the issuance of marketable bonds.
Cash balances at the end of March 2022 stood at $92.3 billion.
| March | April to March | |||
|---|---|---|---|---|
| 2021 | 2022 | 2020-21 | 2021-22 | |
| Financial source/requirement | -6,276 | 3,128 | -327,145 | -85,241 |
| Net increase (+)/decrease (-) in financing activities | ||||
Unmatured debt transactions |
||||
Canadian currency borrowings |
||||
Marketable bonds |
13,380 | 4,355 | 278,482 | 155,611 |
Treasury bills |
-11,800 | 2,800 | 66,933 | -31,400 |
Retail debt |
-4 | - | -198 | -299 |
Total Canadian currency borrowings |
1,576 | 7,155 | 345,217 | 123,912 |
Foreign currency borrowings |
-1,224 | 458 | -514 | -976 |
Total market debt transactions |
352 | 7,613 | 344,703 | 122,936 |
Cross-currency swap revaluation |
-2,102 | -1,939 | -10,142 | -2,697 |
Unamortized discounts and premiums on market debt |
-1,149 | -497 | 7,204 | -2,247 |
Obligations related to capital leases and other unmatured debt |
19 | 111 | -203 | 121 |
| Net change in financing activities | -2,880 | 5,288 | 341,562 | 118,113 |
| Change in cash balance | -9,156 | 8,416 | 14,417 | 32,872 |
| Cash balance at end of period | 59,097 | 92,261 | ||
|
Note: Totals may not add due to rounding. |
||||
Federal debt
The federal debt, or accumulated deficit, is the difference between the government's total liabilities and total assets. The year-over-year change in the accumulated deficit reflects the year-to-date budgetary balance plus other comprehensive income or loss. Other comprehensive income or loss represents certain unrealized gains and losses on financial instruments and certain actuarial gains and losses related to pensions and other employee future benefits reported by enterprise Crown corporations and other government business enterprises.
The accumulated deficit increased by $91.4 billion over the April 2021 to March 2022 period, reflecting the $95.6-billion budgetary deficit, offset in part by $4.2 billion in other comprehensive income.
| March 31, 2021 |
March 31, 2022 |
Change | |
|---|---|---|---|
| Liabilities | |||
Accounts payable and accrued liabilities |
207,397 | 234,214 | 26,817 |
Interest-bearing debt |
|||
Unmatured debt |
|||
Payable in Canadian currency |
|||
Marketable bonds |
875,306 | 1,030,917 | 155,611 |
Treasury bills |
218,775 | 187,375 | -31,400 |
Retail debt |
299 | - | -299 |
Subtotal |
1,094,380 | 1,218,292 | 123,912 |
Payable in foreign currencies |
15,427 | 14,451 | -976 |
Cross-currency swap revaluation |
450 | -2,247 | -2,697 |
Unamortized discounts and premiums on market debt |
9,690 | 7,443 | -2,247 |
Obligations related to capital leases and other unmatured debt |
5,239 | 5,360 | 121 |
Total unmatured debt |
1,125,186 | 1,243,299 | 118,113 |
Pension and other liabilities |
|||
Public sector pensions |
168,761 | 172,875 | 4,114 |
Other employee and veteran future benefits |
144,186 | 159,048 | 14,862 |
Other liabilities |
6,711 | 7,717 | 1,006 |
Total pension and other liabilities |
319,658 | 339,640 | 19,982 |
Total interest-bearing debt |
1,444,844 | 1,582,939 | 138,095 |
| Total liabilities | 1,652,241 | 1,817,153 | 164,912 |
| Financial assets | |||
Cash and accounts receivable |
224,196 | 253,535 | 29,339 |
Foreign exchange accounts |
92,622 | 104,031 | 11,409 |
Loans, investments, and advances (net of allowances)1 |
179,278 | 208,907 | 29,629 |
Public sector pension assets |
6,320 | 6,320 | - |
Total financial assets |
502,416 | 572,793 | 70,377 |
| Net debt | 1,149,825 | 1,244,360 | 94,535 |
| Non-financial assets | 101,079 | 104,243 | 3,164 |
| Federal debt (accumulated deficit) | 1,048,746 | 1,140,117 | 91,371 |
|
Note: Totals may not add due to rounding. 1 March 31, 2022 amount includes $4.2 billion in other comprehensive income from enterprise Crown corporations and other government business enterprises for the April 2021 to March 2022 period. |
|||
Notes
- The Fiscal Monitor is a report on the consolidated financial results of the Government of Canada, prepared monthly by the Department of Finance Canada. The government is committed to releasing The Fiscal Monitor on a timely basis in accordance with the International Monetary Fund’s Special Data Dissemination Standards Plus, which are designed to promote member countries’ data transparency and promote the development of sound statistical systems.
- The financial results reported in The Fiscal Monitor are drawn from the accounts of Canada, which are maintained by the Receiver General and used to prepare the annual Public Accounts of Canada.
- The Fiscal Monitor is generally prepared in accordance with the same accounting policies as used to prepare the government’s annual consolidated financial statements, which are summarized in Section 2 of Volume I of the Public Accounts of Canada, available through the Public Services and Procurement Canada website.
- The financial results presented in The Fiscal Monitor have not been audited or reviewed by an external auditor.
- There can be substantial volatility in monthly results due to the timing of revenue receipts and expense recognition. For instance, a large share of government spending is typically reported in the March Fiscal Monitor.
- The April to March results reported in The Fiscal Monitor are not the final results for the fiscal year as a whole. The final results are published in the annual Public Accounts of Canada and incorporate post-March end-of-year adjustments made once further information becomes available, including the accrual of tax revenues reflecting assessments of tax returns and valuation adjustments for assets and liabilities. Post-March adjustments may also include the accrual of measures announced in the budget that are recorded upon receipt of Royal Assent of enabling legislation.
- Table 7, Condensed Statement of Assets and Liabilities, is included in the monthly Fiscal Monitor following the finalization and publication of the government’s financial results for the preceding fiscal year, typically in the fall.
Note: Unless otherwise noted, changes in financial results are presented on a year-over-year basis.
For inquiries about this publication, contact Bradley Recker at bradley.recker@fin.gc.ca.
May 2022